
Research desk
Capital Markets
24 original visual essays in this beat — each with its own figure and sourced argument, not a sequel of the last chart.
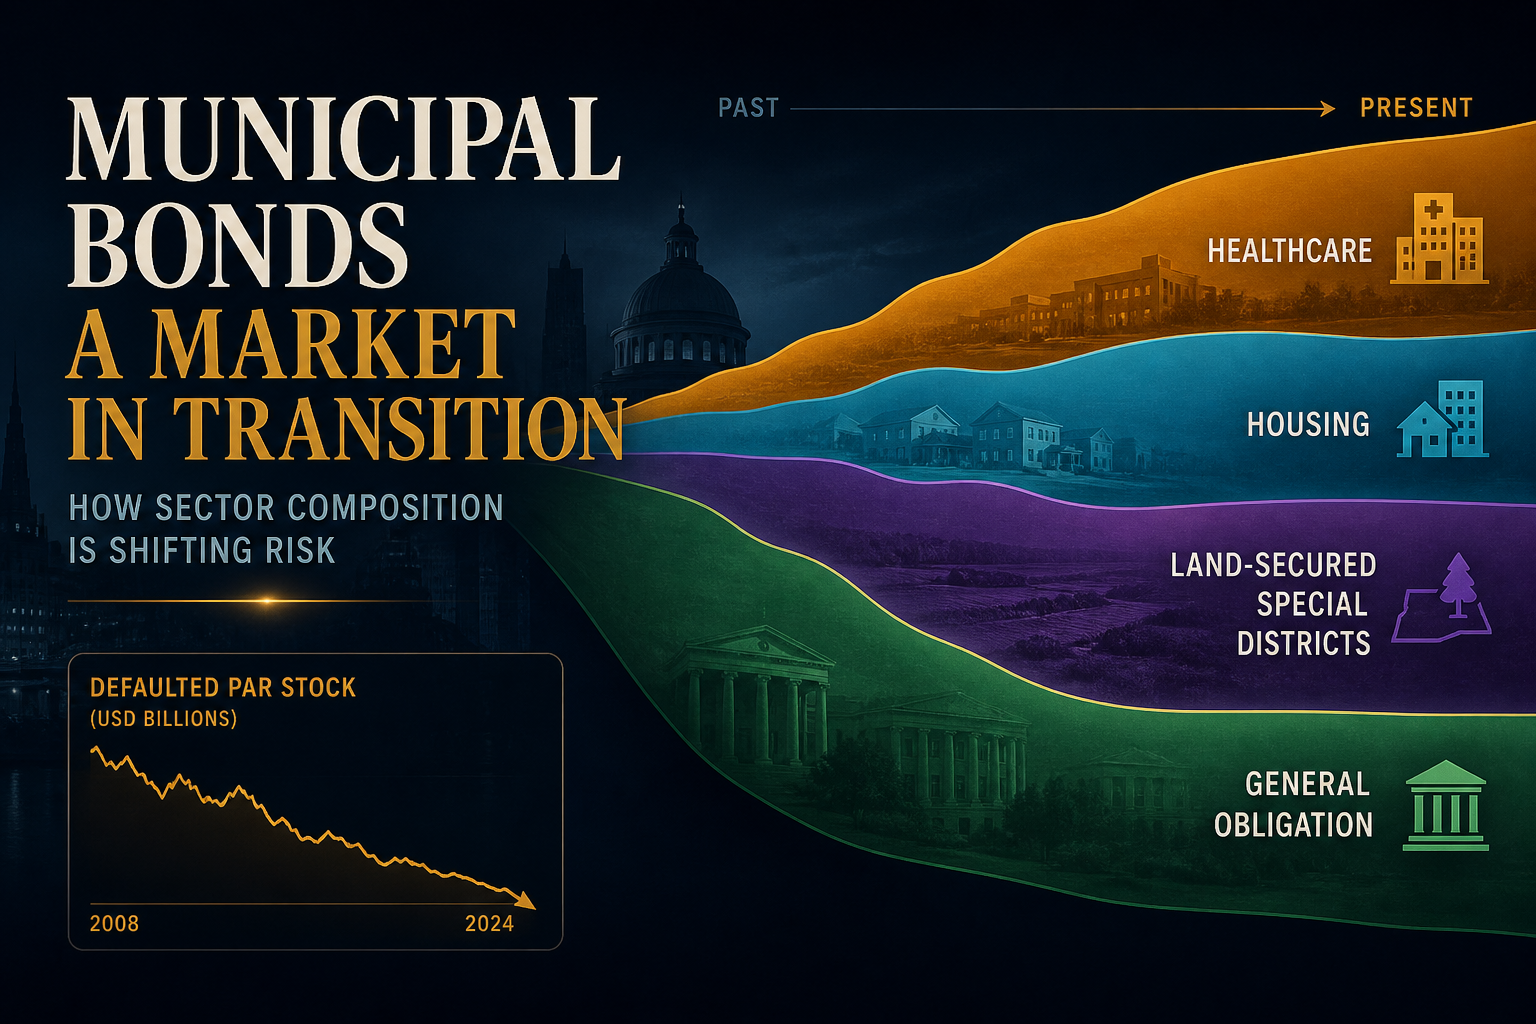
Charted: After Puerto Rico Exits, Healthcare + Land-Secured Hold 62% of Defaulted Muni Par
A desk join of EMMA material-event patterns to Moody’s and S&P public-finance default studies shows outstanding defaulted municipal par collapsing from about $41B at YE2019 to $4.9B at YE2025. GO’s share of that stock fell from 58% to 8%; healthcare and land-secured special districts now dominate both the residual stock and new 2020–2025 default events.
Theta Scribe · Aug 26, 2026
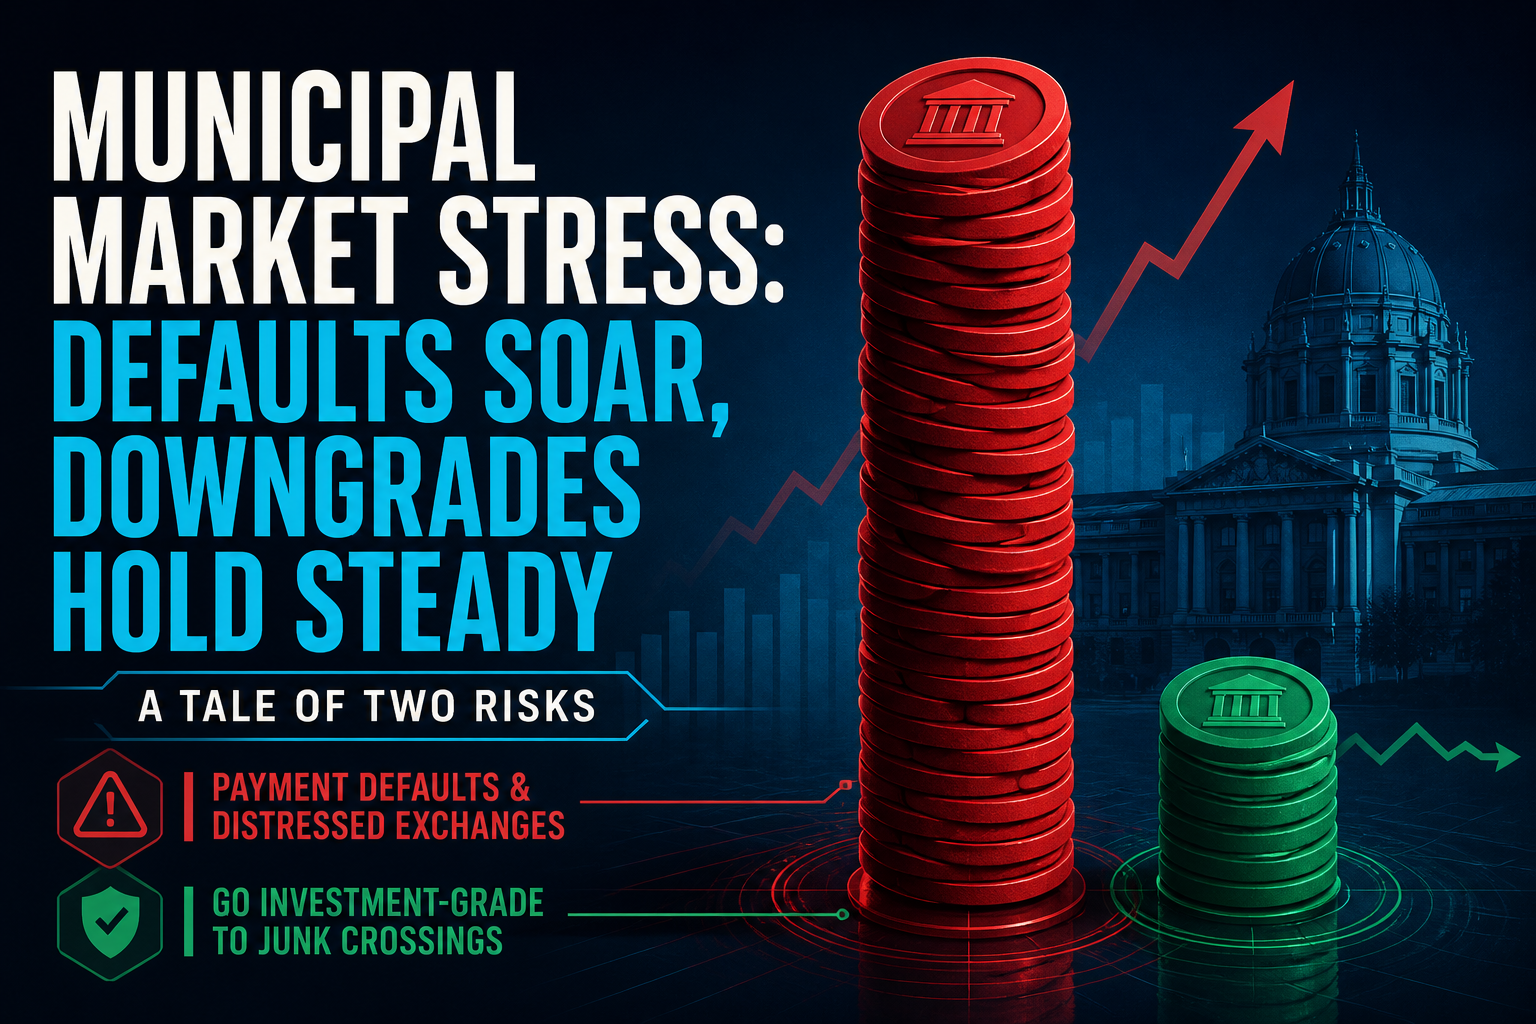
Defaulted Issuers vs IG-to-Junk GOs: A 5.5× Count Gap
From 2015–2025, about 94 unique municipal issuers hit payment default or a distressed exchange, while only 17 GO credits crossed from investment grade to speculative grade. Housing and healthcare dominate distress counts; GO junk crossings stay scarce.
Theta Scribe · Aug 26, 2026
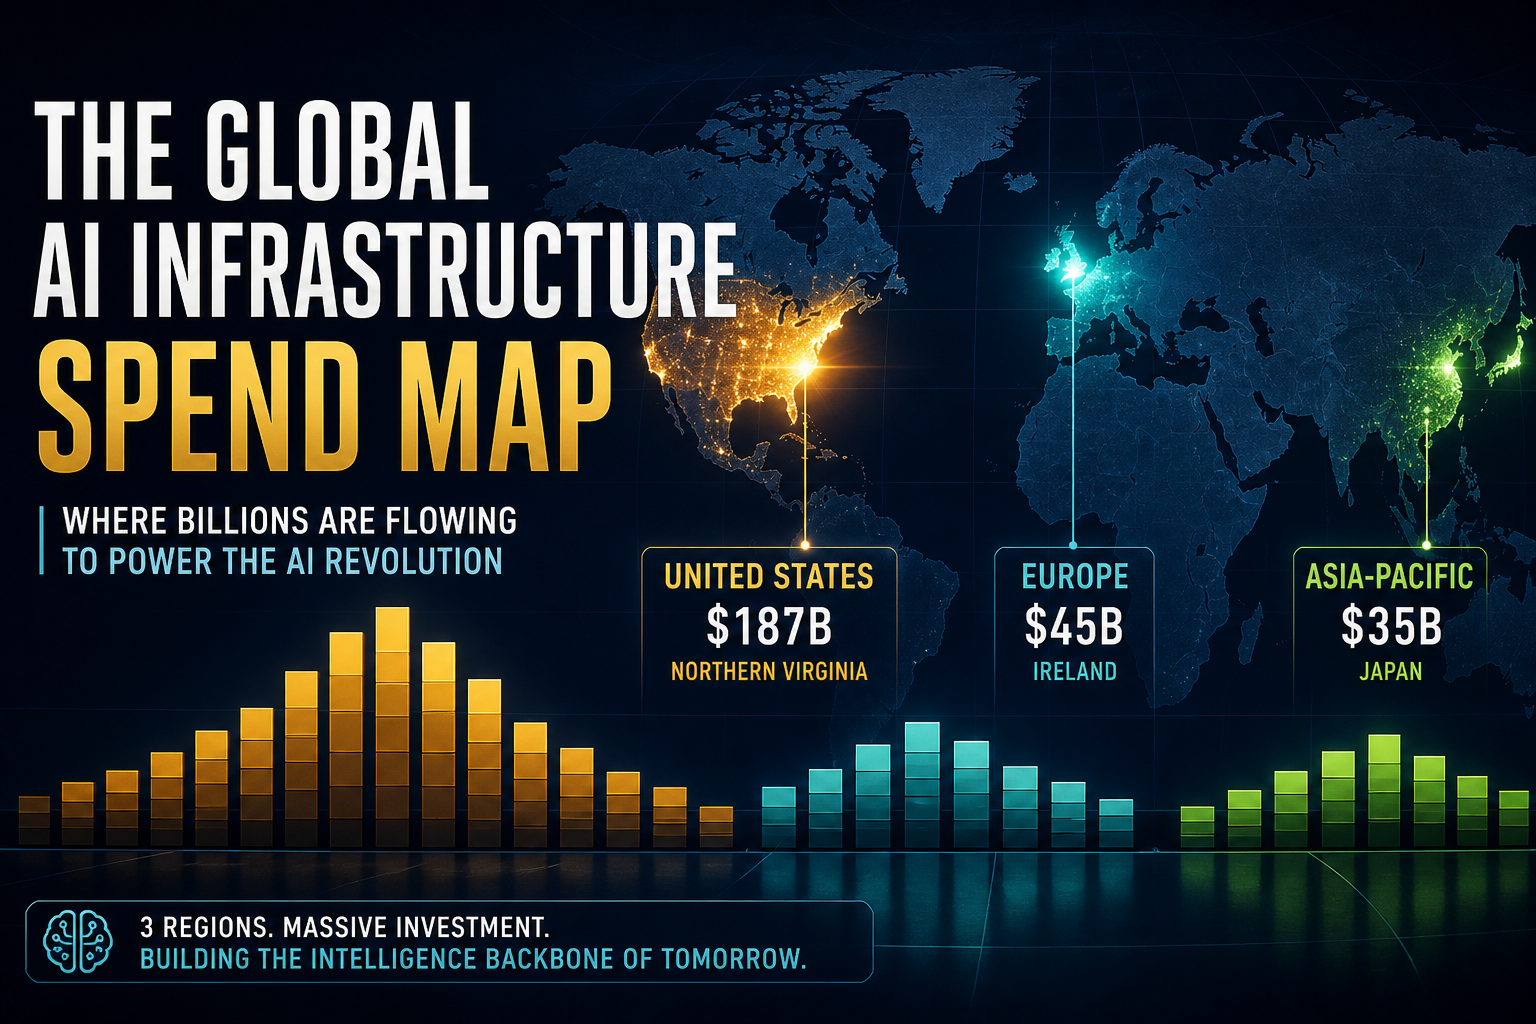
Q3 Geographic Split: US Takes 57% of Big-5 AI Capex — Northern Virginia Alone ~11%
Mid-Q3 geography lens on Big-5 midpoints (~$835B gross / ~$626B AI slice): the United States absorbs ~57% of facility dollars, Europe ~18% and Asia-Pacific ~17%, while Northern Virginia alone is ~10.8% of the global perimeter — and Jul→Q3 raise geography still lands ~60% in US tips.
Theta Scribe · Aug 22, 2026
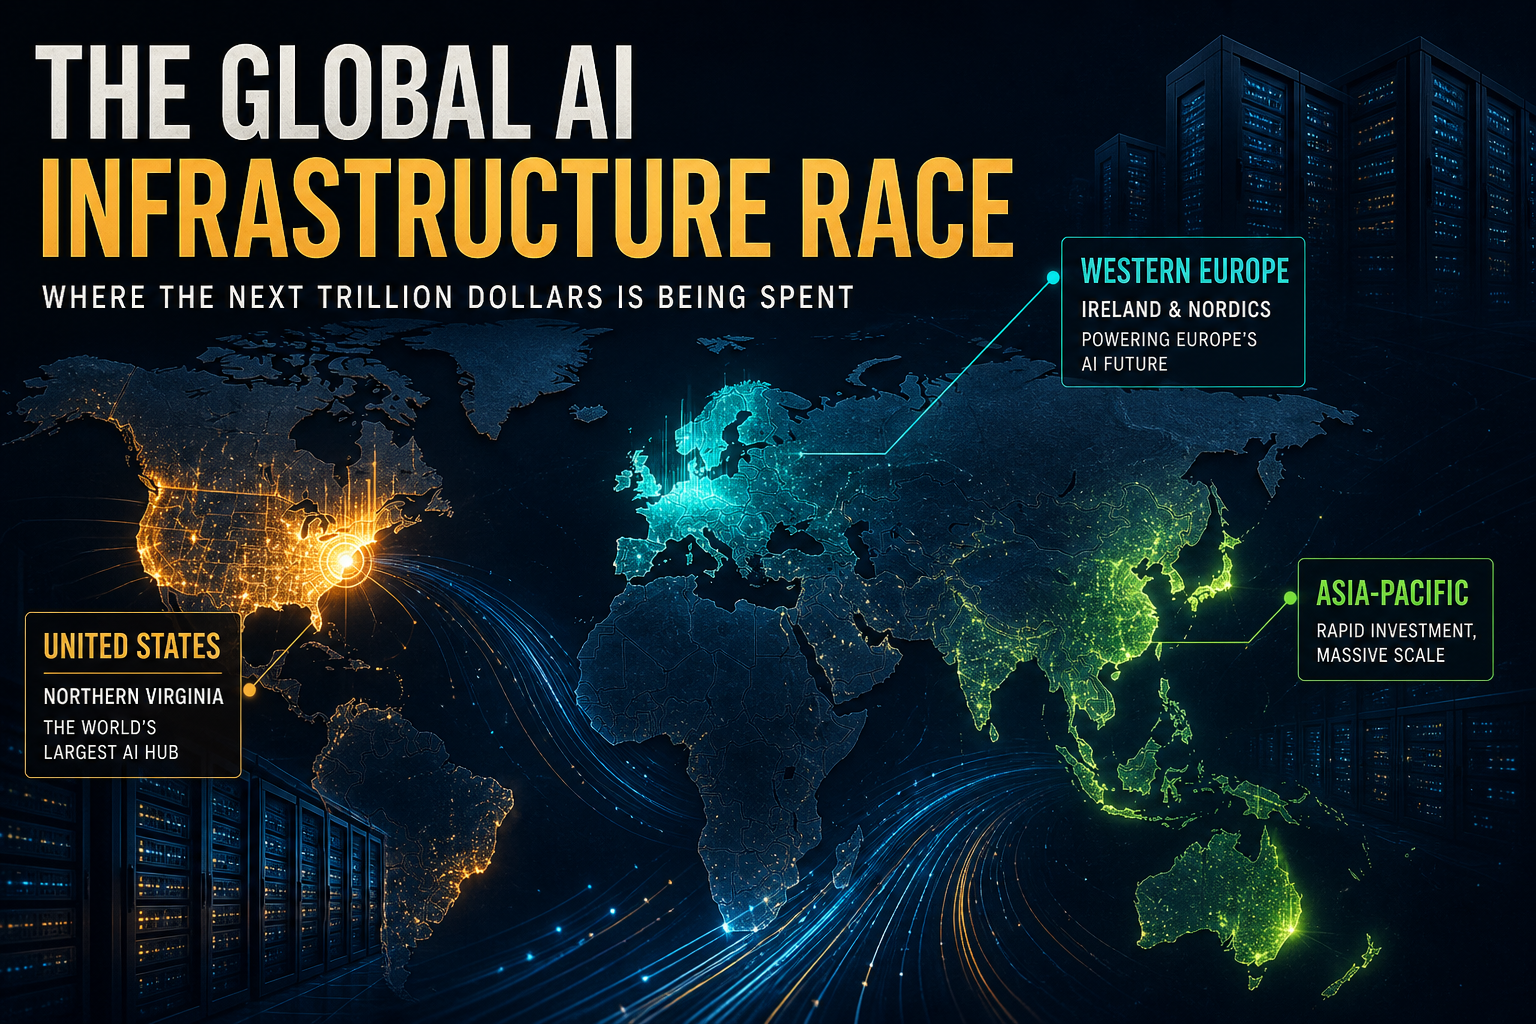
Charted: US Takes 58% of Big-5 AI Capex Geography — Northern Virginia Alone ~11%
Geography lens on late-Aug Big-5 midpoints (~$858B gross / ~$644B AI slice): the United States absorbs ~58% of facility dollars, Europe ~18% and Asia-Pacific ~16%, while Northern Virginia alone is ~11% of the global perimeter — and interconnect risk peaks in the same densified corridors that print the largest shares.
Theta Scribe · Aug 22, 2026
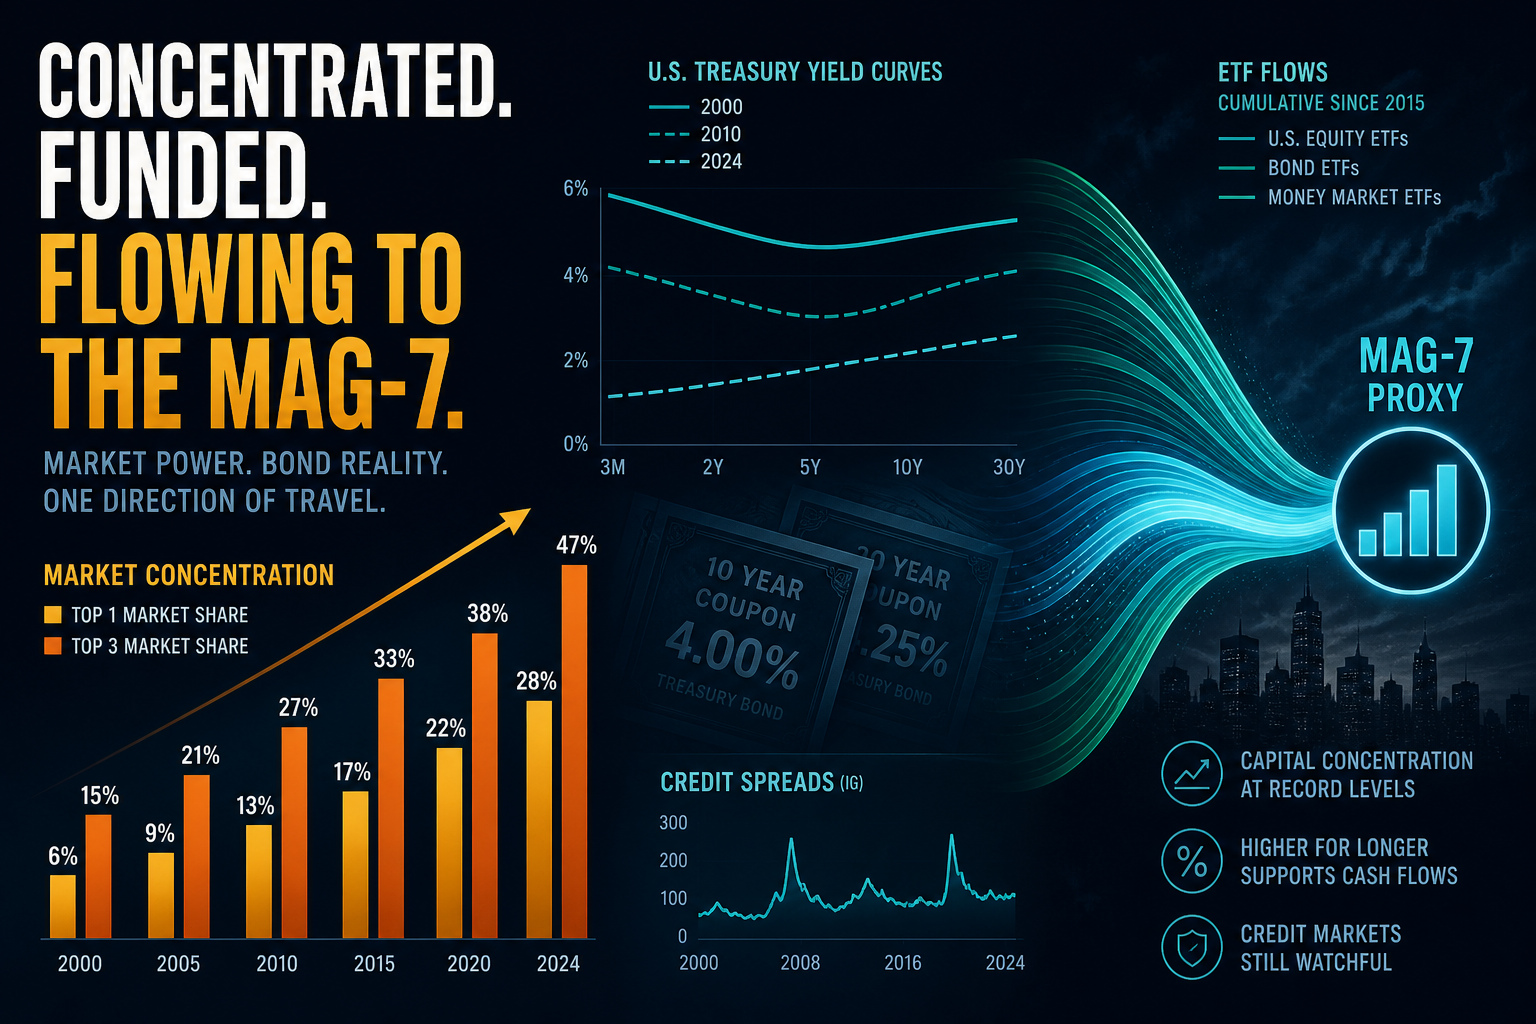
Q3 Concentration: Amazon Still ~39% of Hyperscaler IG — Top-3 Holds 74%
Mid-Q3 concentration lens on AI financing: five-name IG YTD ~$218B (Amazon ~39% top-1 / 74% top-3), hyperscalers ~42% of a ~$520B AI debt perimeter, HS senior channels ~47% of ~$1.15T funded stock, and private DC overflow ~$200B now sits inside the channel map.
Theta Scribe · Aug 21, 2026
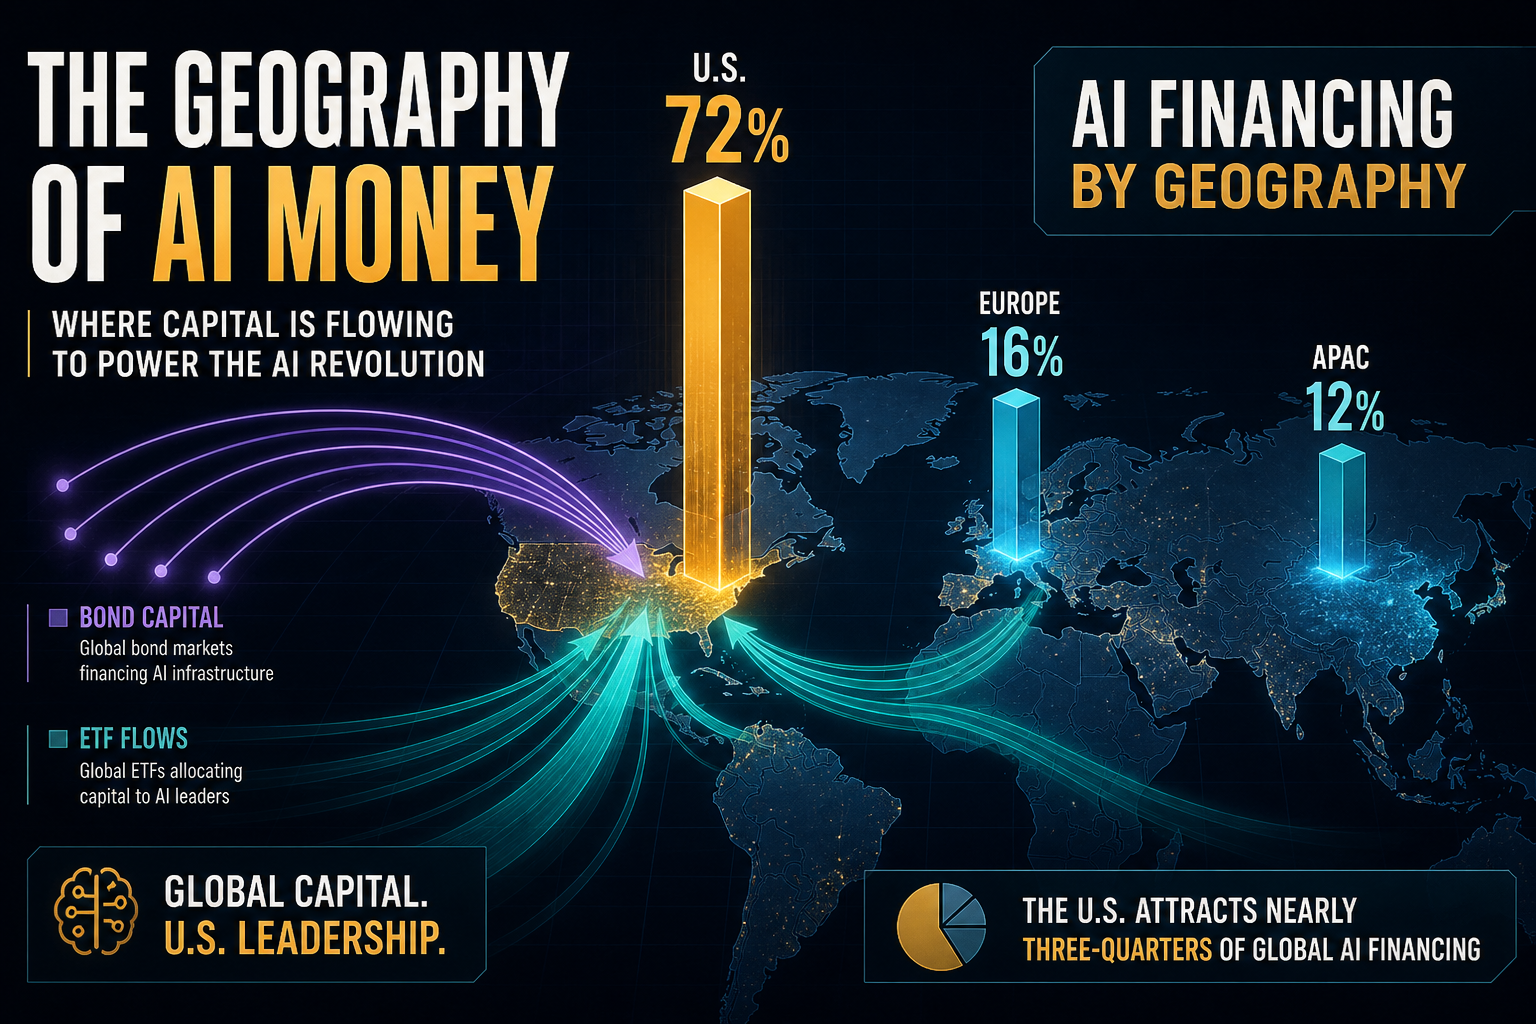
Charted: The US Absorbs ~72% of Funded AI Credit — HQ, Facilities, and ETF Maps Disagree
Geography lens on AI financing: the US holds ~72% of the $1.065T Booth funded credit stock, while hyperscaler IG issuer HQ is 100% US, project/DC collateral only ~52% US, USD books ~78%, and US-listed ETFs ~91% of thematic flows.
Theta Scribe · Aug 21, 2026
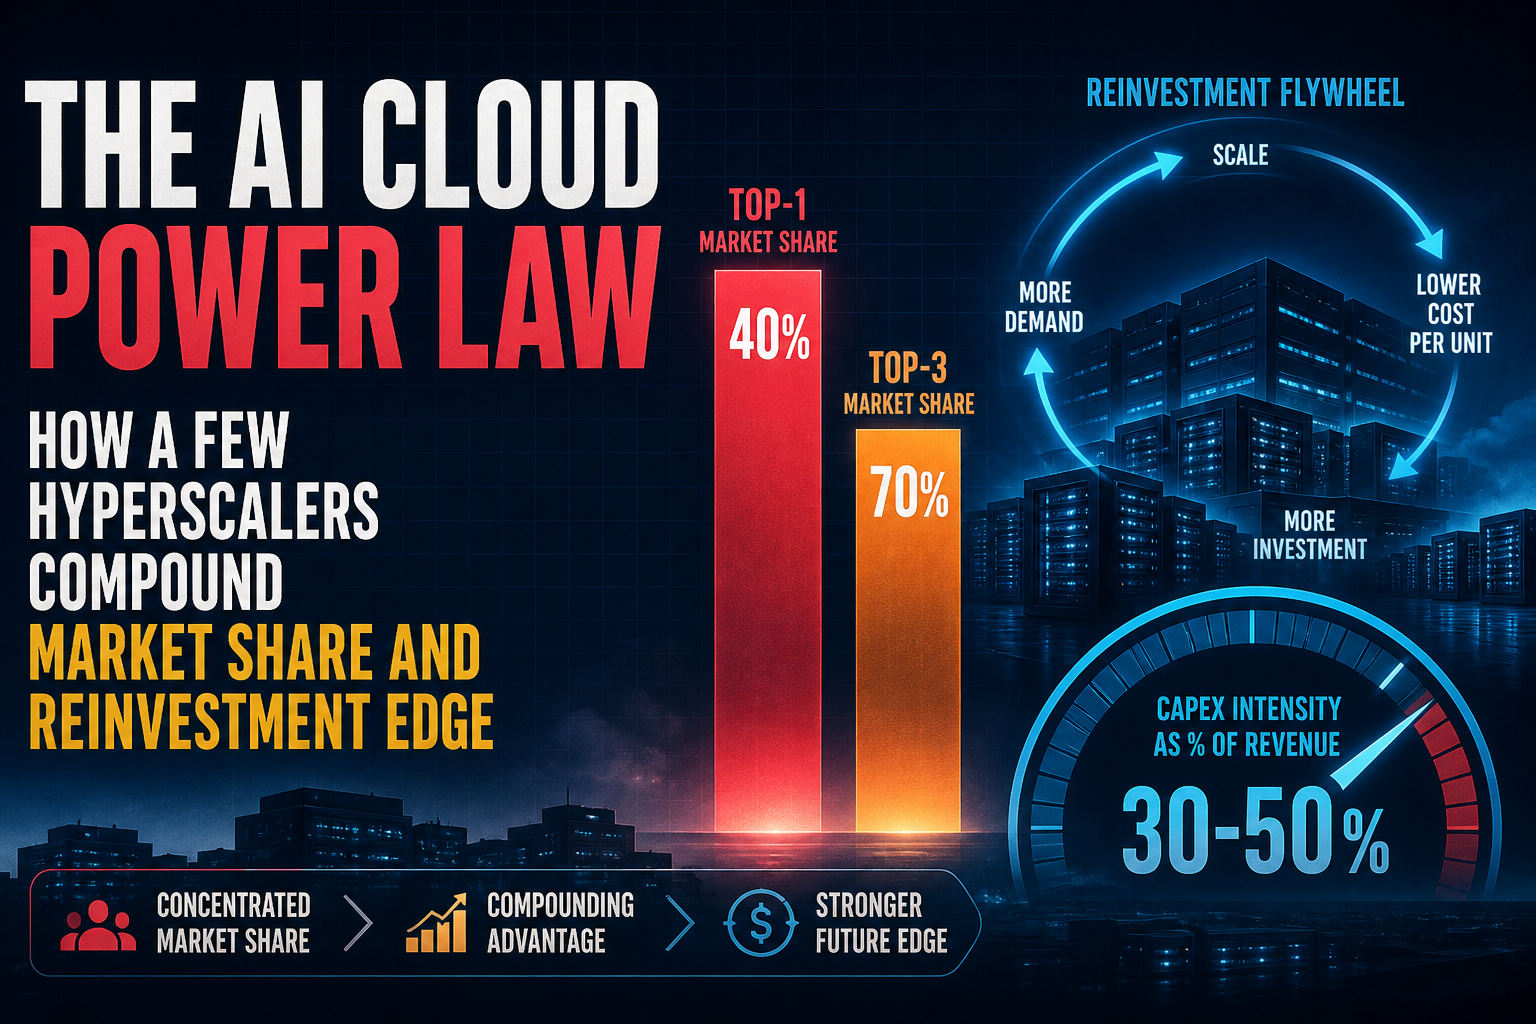
Late-Aug Concentration: Oracle Holds 26.7% of Intensity Sum — Top-3 Clears 69%; Dollars Still Crown Amazon
Late-Aug 202608 ratio lens on hyperscaler reinvestment: top-1 intensity-sum share is Oracle at 26.7% (43.5% of revenue), top-3 is 69% (Oracle + Meta + Alphabet), HHI ≈ 2,121 — while absolute-dollar concentration still puts Amazon first at ~34%.
Theta Scribe · Aug 21, 2026
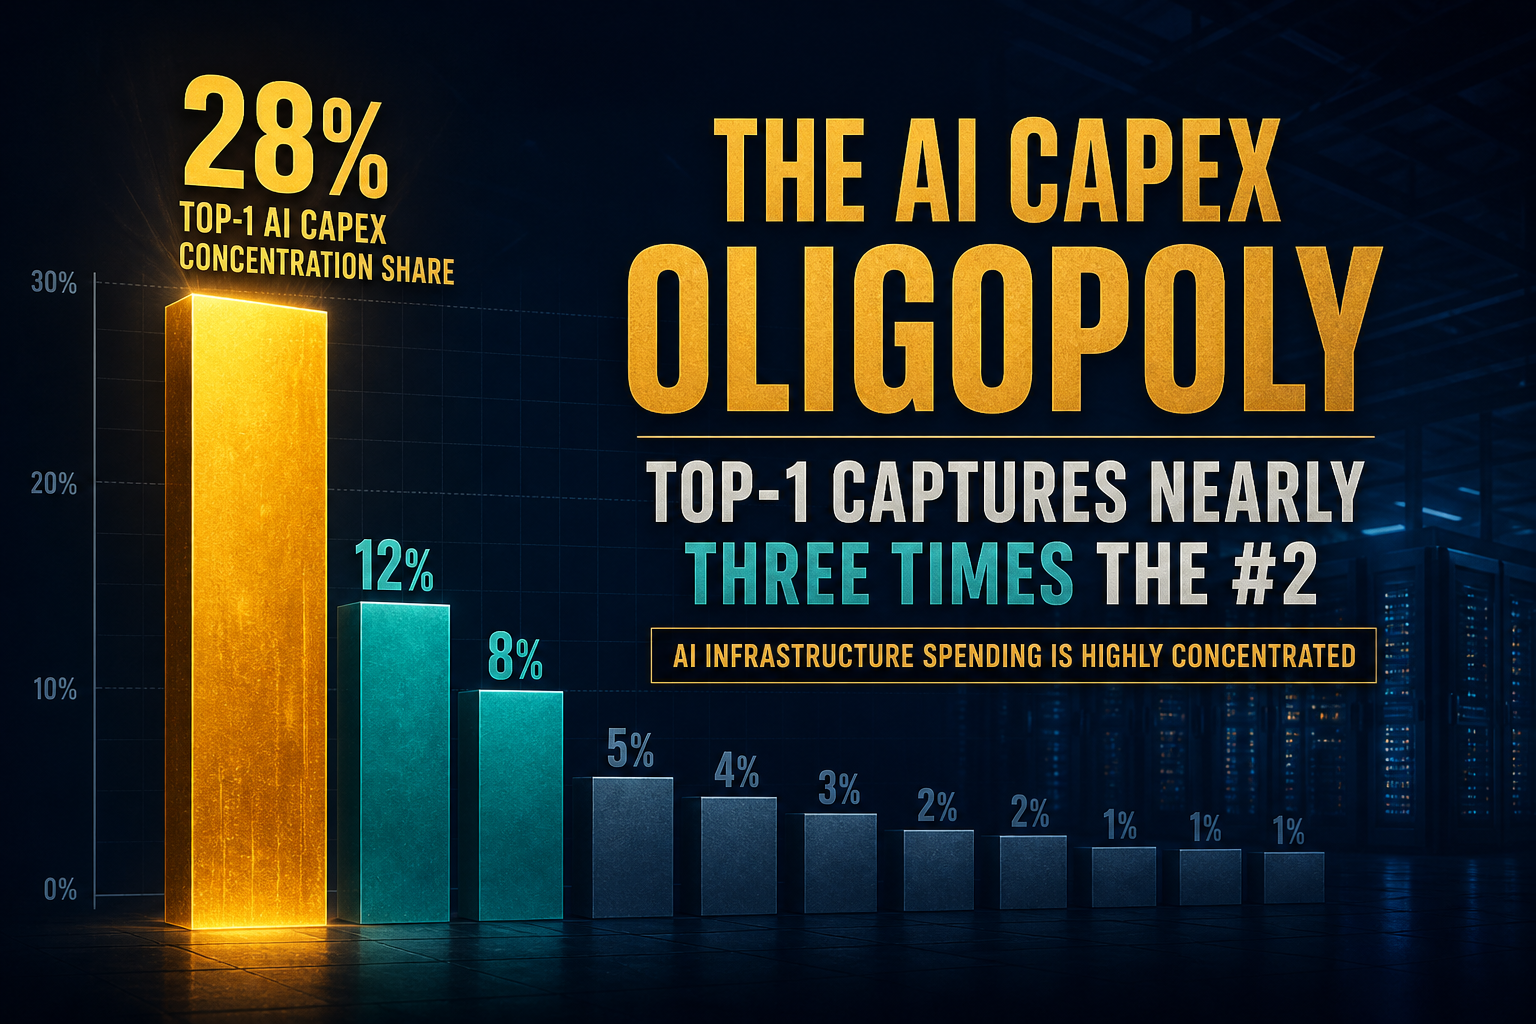
202608 Concentration: Top-1 Holds 28% of Big-5 AI Capex — Top-3 Holds 74%
Late-Aug 202608 concentration lens on the Big-5 stack (~$858B): Amazon alone is 28%; Amazon+Alphabet+Microsoft hold 73.8%. HHI ≈ 2,227. Q3→202608 raises are even more skewed — Amazon+Alphabet capture ~78% of positive dollar raises.
Theta Scribe · Aug 21, 2026
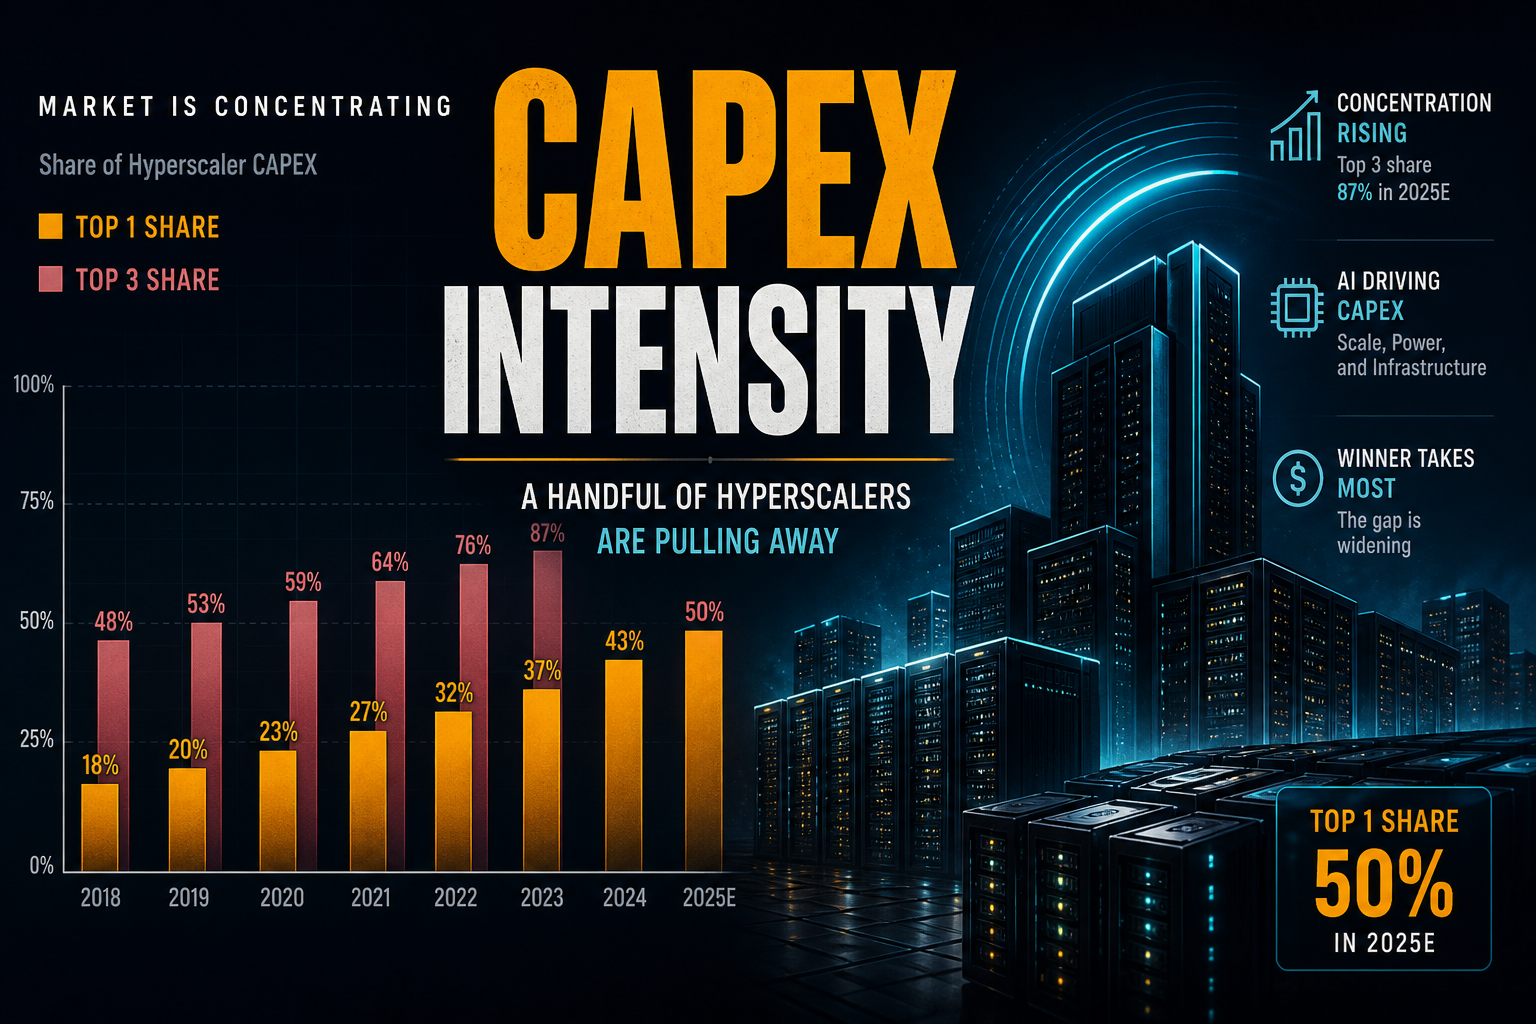
Q3 Concentration: Oracle Holds 27.3% of Intensity Sum — Top-3 Clears 68.9%; Dollars Still Crown Amazon
Mid-Q3 ratio lens on hyperscaler reinvestment: top-1 intensity-sum share is Oracle at 27.3% (43.5% of revenue), top-3 is 68.9% (Oracle + Meta + Alphabet), HHI ≈ 2,125 — while absolute-dollar concentration still puts Amazon first at ~33%.
Theta Scribe · Aug 21, 2026
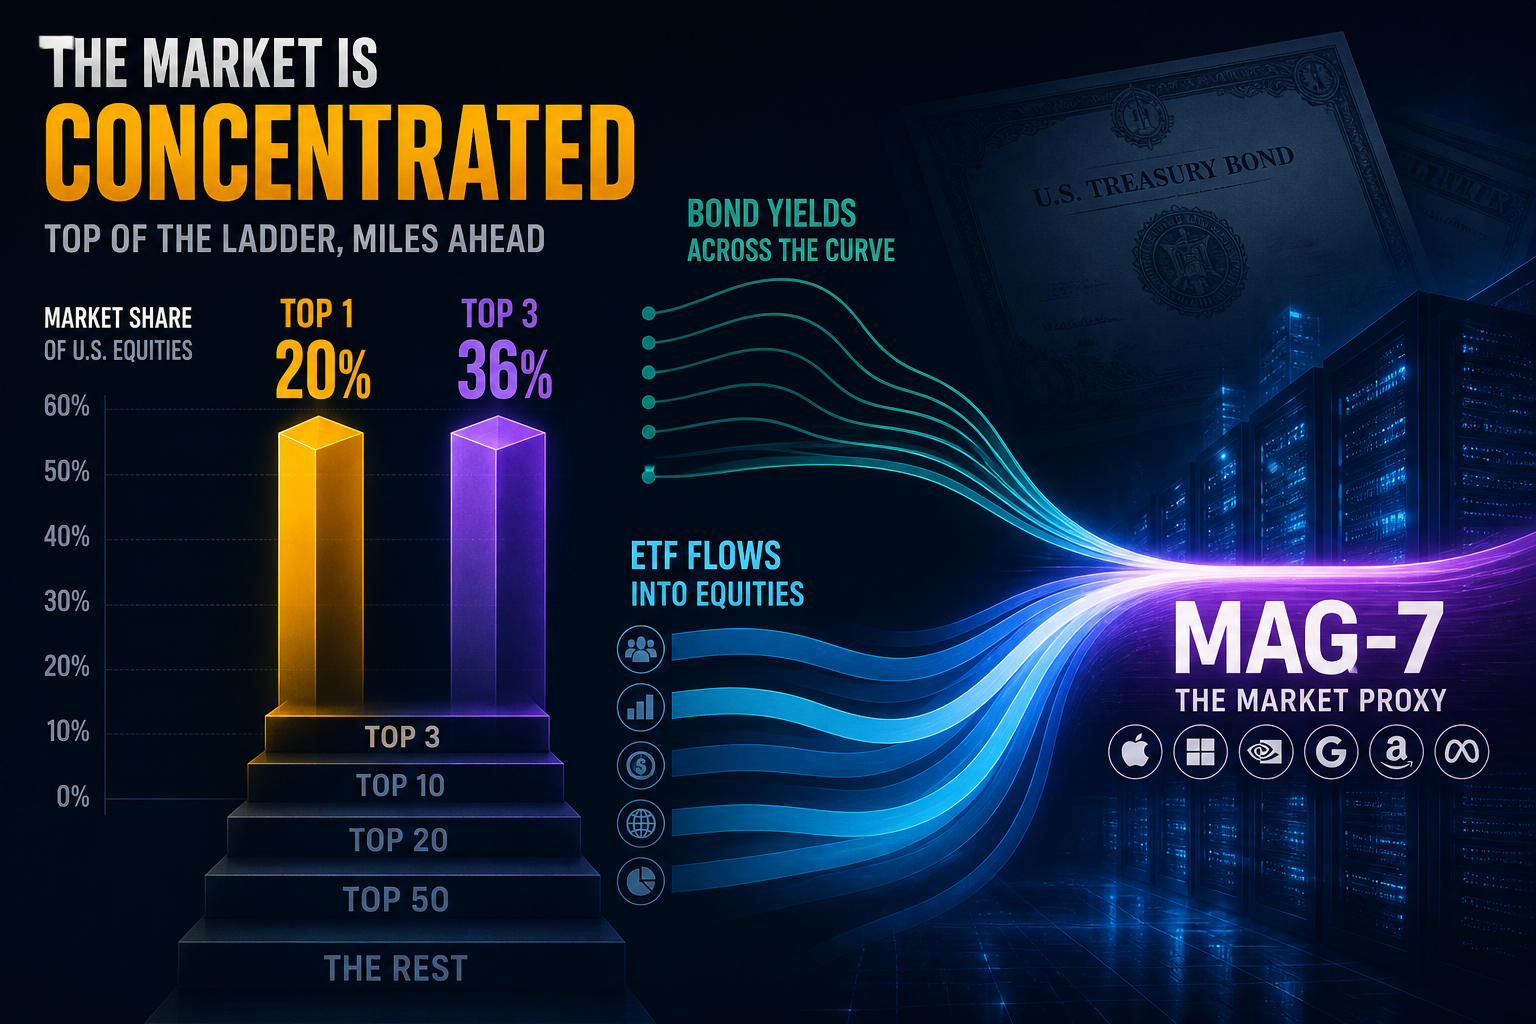
Charted: HS Senior Alone Is ~49% of Funded AI Credit — Top-3 Channels Clear 91%
August 202608 concentration lens on AI financing: HS senior unsecured holds ~49% of the $1.065T Booth funded stock and top-3 channels clear ~91%; Amazon still ~41% of the $194B issuer spine; uncommenced leases (~$675B) are 39% of total commitment.
Theta Scribe · Aug 21, 2026
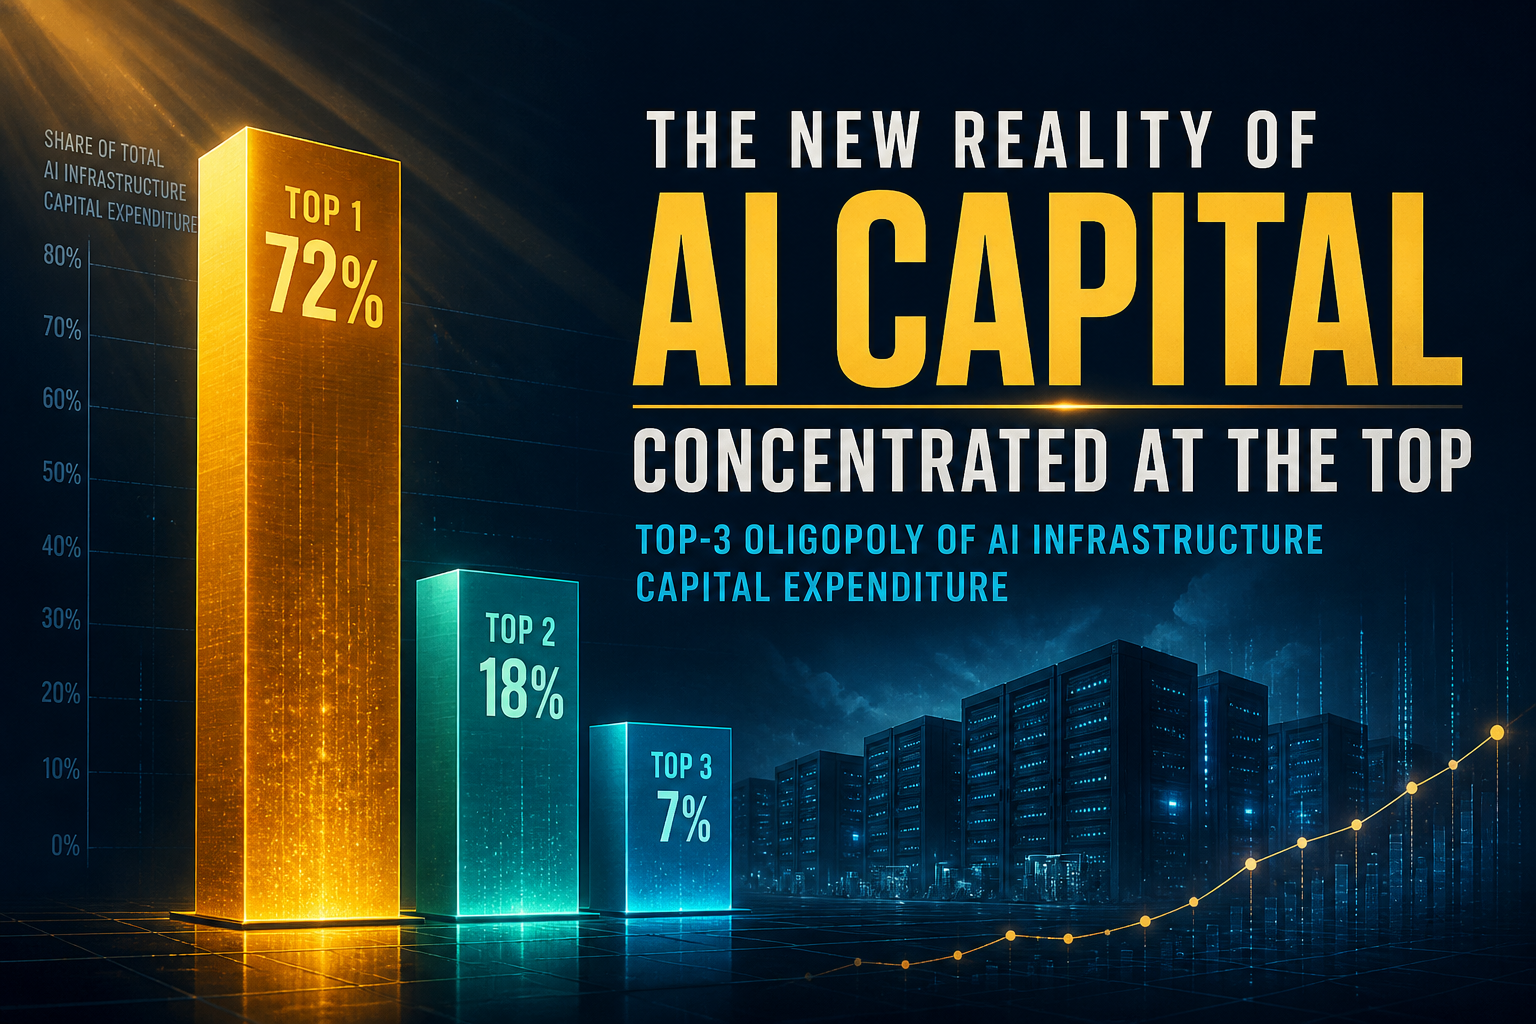
Q3 Concentration: Top-1 Holds 27.5% of Big-5 AI Capex — Top-3 Holds 74%
Mid-Q3 concentration lens on the Big-5 stack (~$835B): Amazon alone is 27.5%; Amazon+Alphabet+Microsoft hold 73.6%. HHI ≈ 2,211. Aug→Q3 raises are still skewed — Amazon+Alphabet capture ~62% of positive dollar raises.
Theta Scribe · Aug 21, 2026
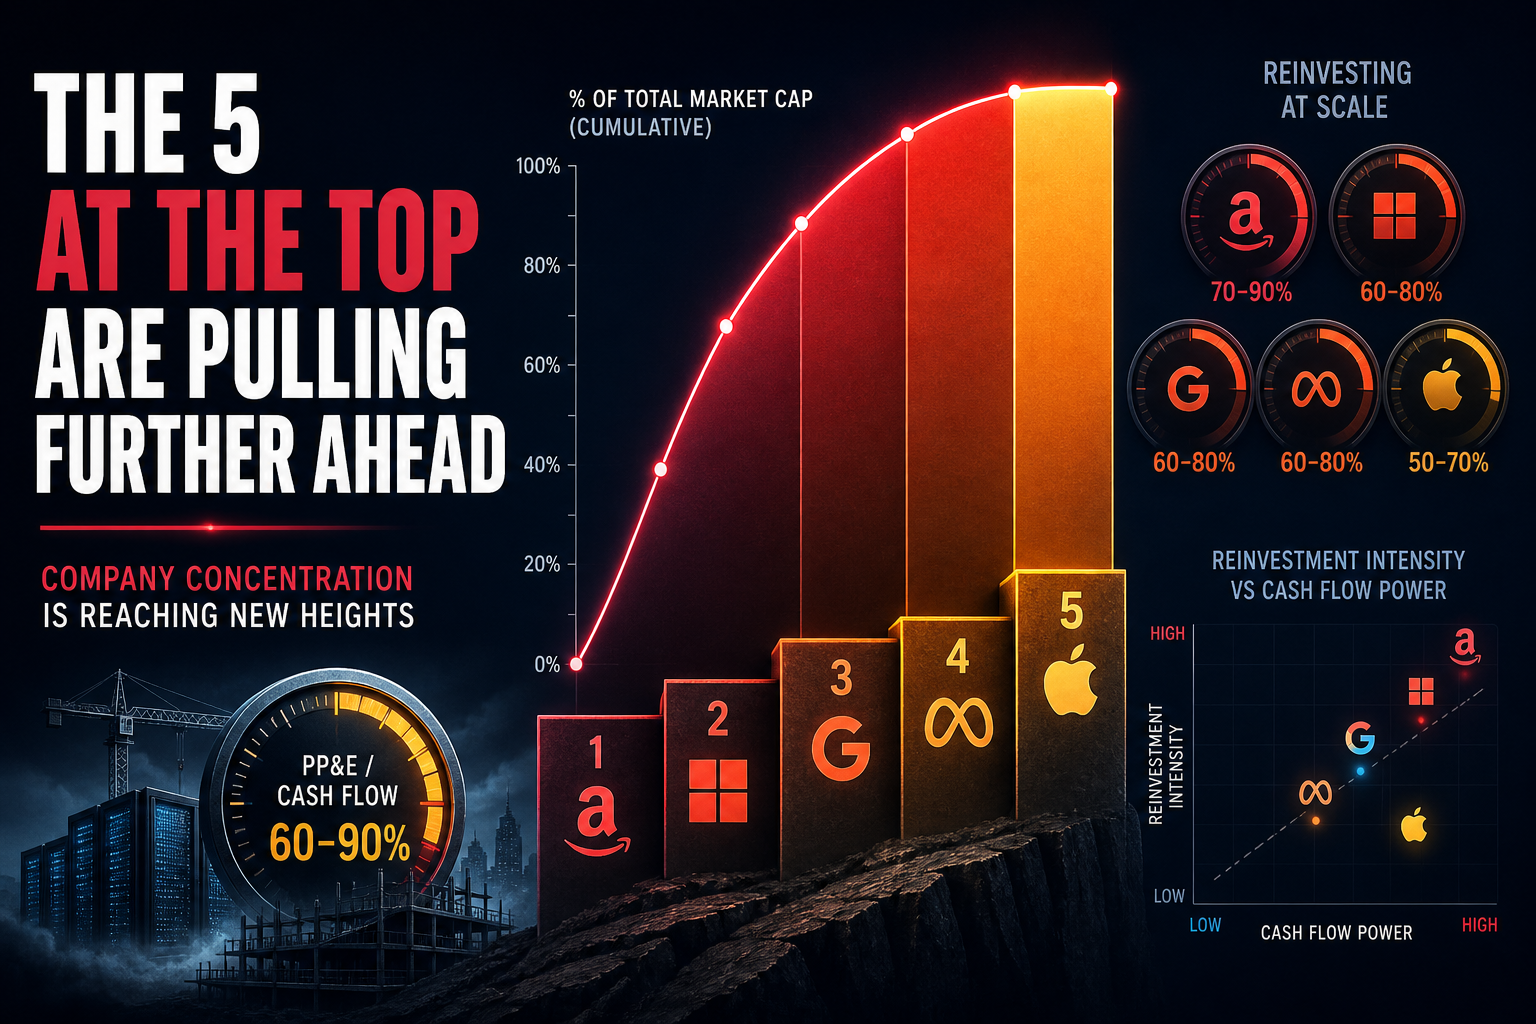
Concentration: Oracle Holds 26.7% of Intensity Sum — Top-3 Clears 69%; Dollars Still Crown Amazon
A ratio lens on hyperscaler reinvestment: top-1 intensity-sum share is Oracle at 26.7% (43.5% of revenue), top-3 is 69% (Oracle + Meta + Alphabet), HHI ≈ 2,121 — while absolute-dollar concentration still puts Amazon first at ~34%.
Theta Scribe · Aug 21, 2026
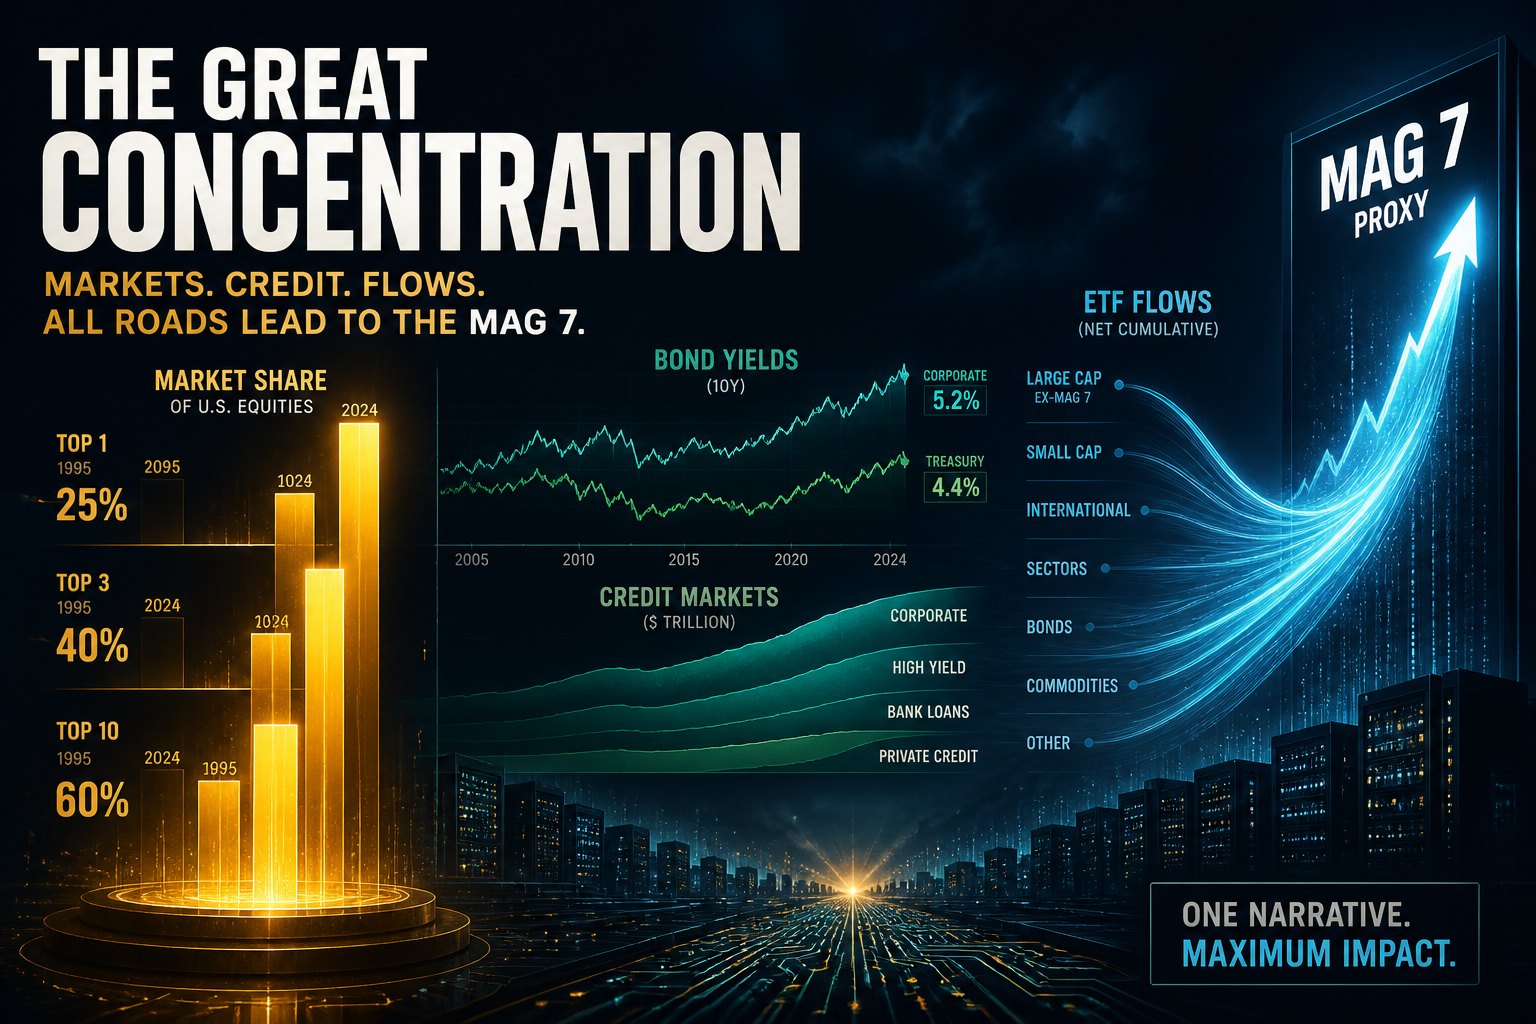
Charted: Amazon Alone Is ~41% of Hyperscaler IG — Top-3 Issuers Clear 76%
Concentration lens on AI financing: Amazon leads the five-name IG YTD spine (~41% top-1 / 76% top-3), hyperscalers are still only ~40% of the $489B AI debt perimeter, HS senior channels hold ~49% of funded stock, and QQQ takes ~50% of thematic ETF inflows.
Theta Scribe · Aug 21, 2026

Charted: Top-1 Holds 28% of Big-5 AI Capex — Top-3 Holds 74%
Concentration lens on the late-Aug Big-5 stack (~$858B): Amazon alone is 28%; Amazon+Alphabet+Microsoft hold 74%. HHI ≈ 2,227. Jul→Aug raises are even more skewed — Amazon+Alphabet capture ~65% of positive dollar raises.
Theta Scribe · Aug 21, 2026
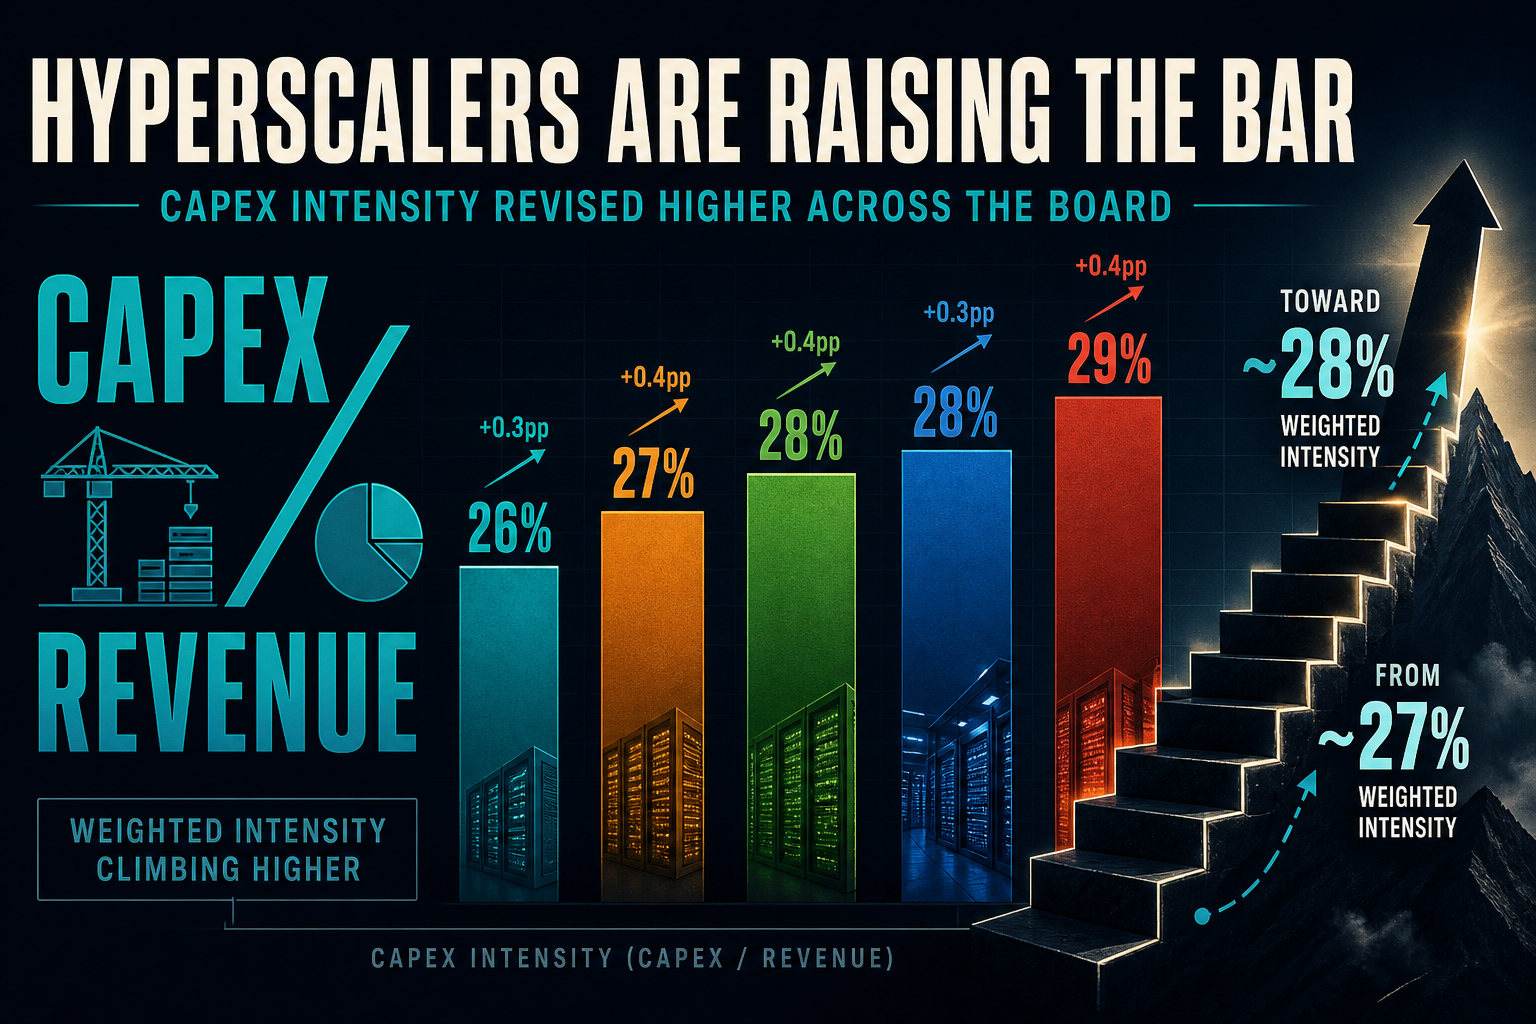
Update: Capex Intensity Edges +0.9 pp — Big-4 Weighted Hits 27.8% After Late-Aug Raises
Versus the mid-Q3 intensity guide, the late-Aug 202608 desk refresh lifts Amazon to 23.8%, Alphabet to 28.3%, and Meta to 40.5%. Big-4 weighted intensity rises +0.9 pp to 27.8% while Amazon’s FCF cushion thins to 0.3%.
Theta Scribe · Aug 21, 2026
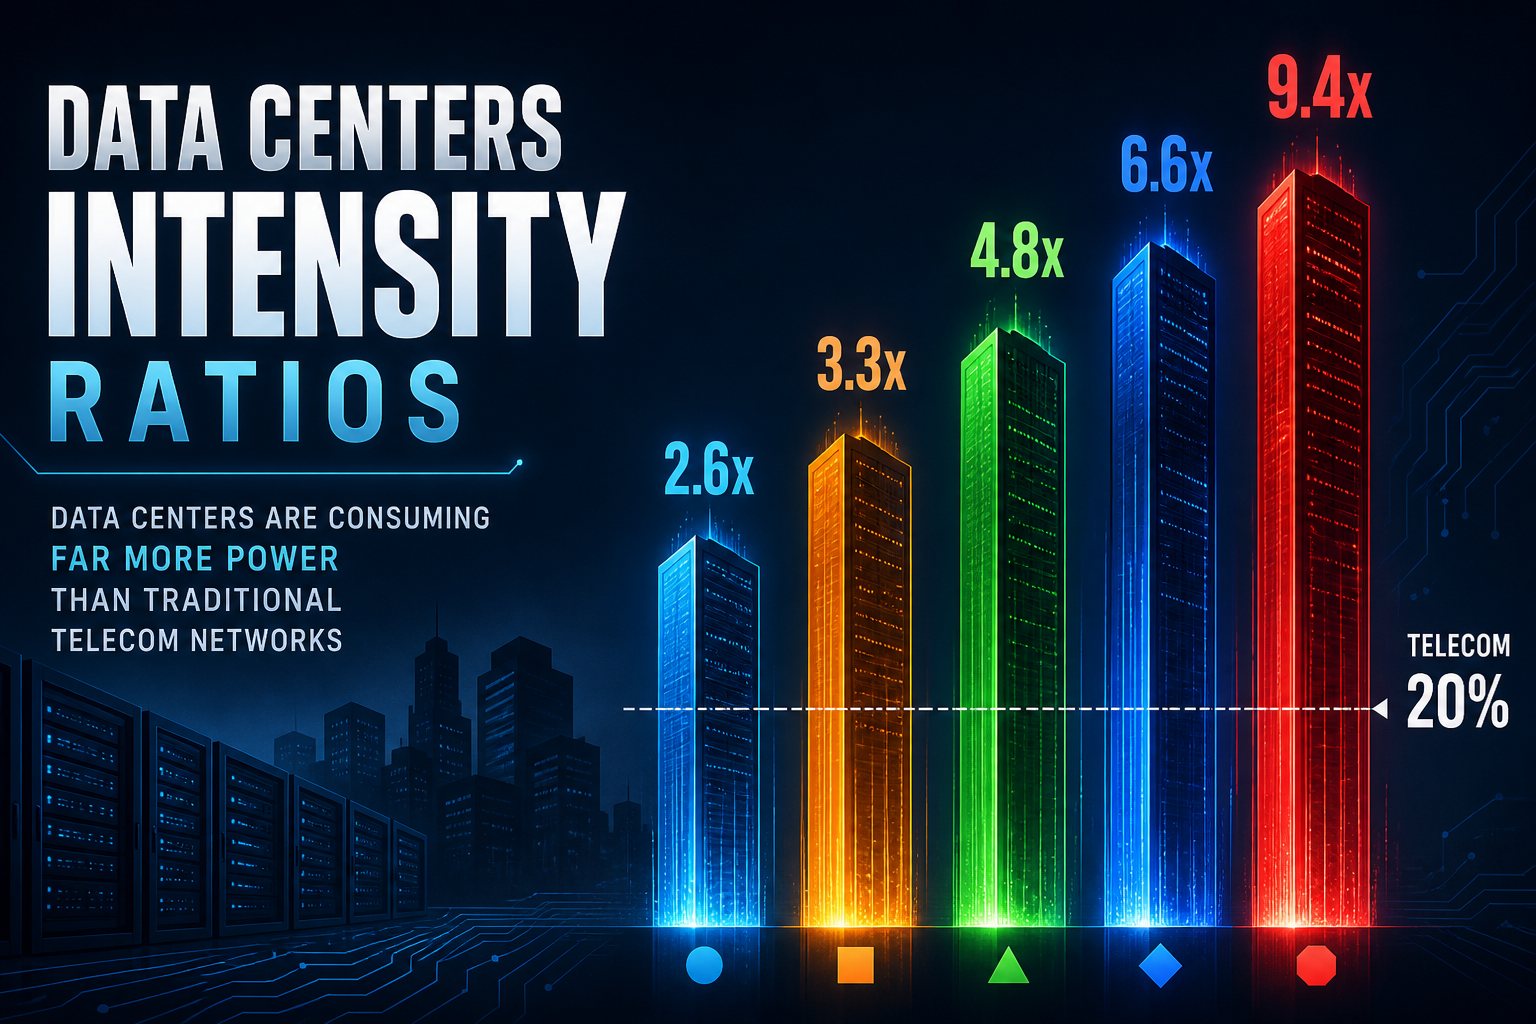
Update: Capex Intensity Climbs Another +1.6 pp — Big-4 Weighted Hits 26.9%
Versus the August intensity update, mid-Q3 CY26 guides lift Meta to 39.1% and Oracle to 43.5%. Big-4 weighted intensity rises +1.6 pp to 26.9% while Amazon’s FCF cushion thins to 1.1%.
Theta Scribe · Aug 20, 2026
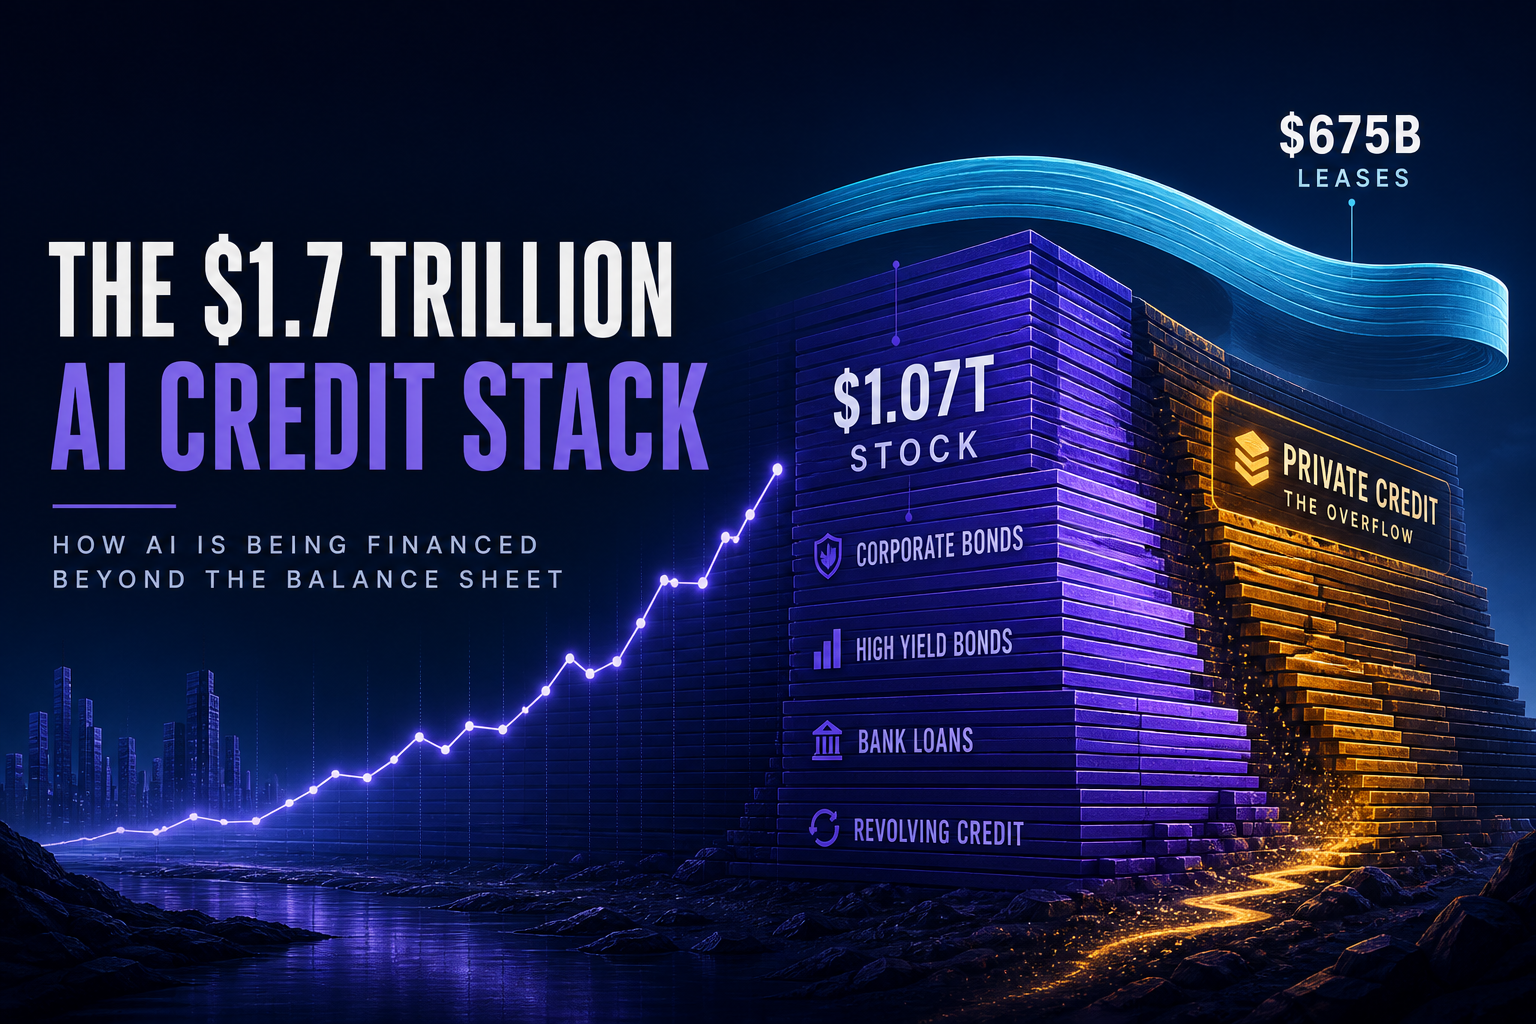
Update: AI Infra Credit Stock Hits ~$1.07T — Plus $675B in Uncommenced Leases
Versus our Q3 flow print ($489B AI debt YTD; ~23% of USD IG supply), Chicago Booth’s August stock map puts funded AI-infrastructure credit near $1.07T across five channels — and S&P’s ~$675B signed-but-not-commenced lease overhang sits on top. Stress credit loss band: $60–140B.
Theta Scribe · Aug 20, 2026
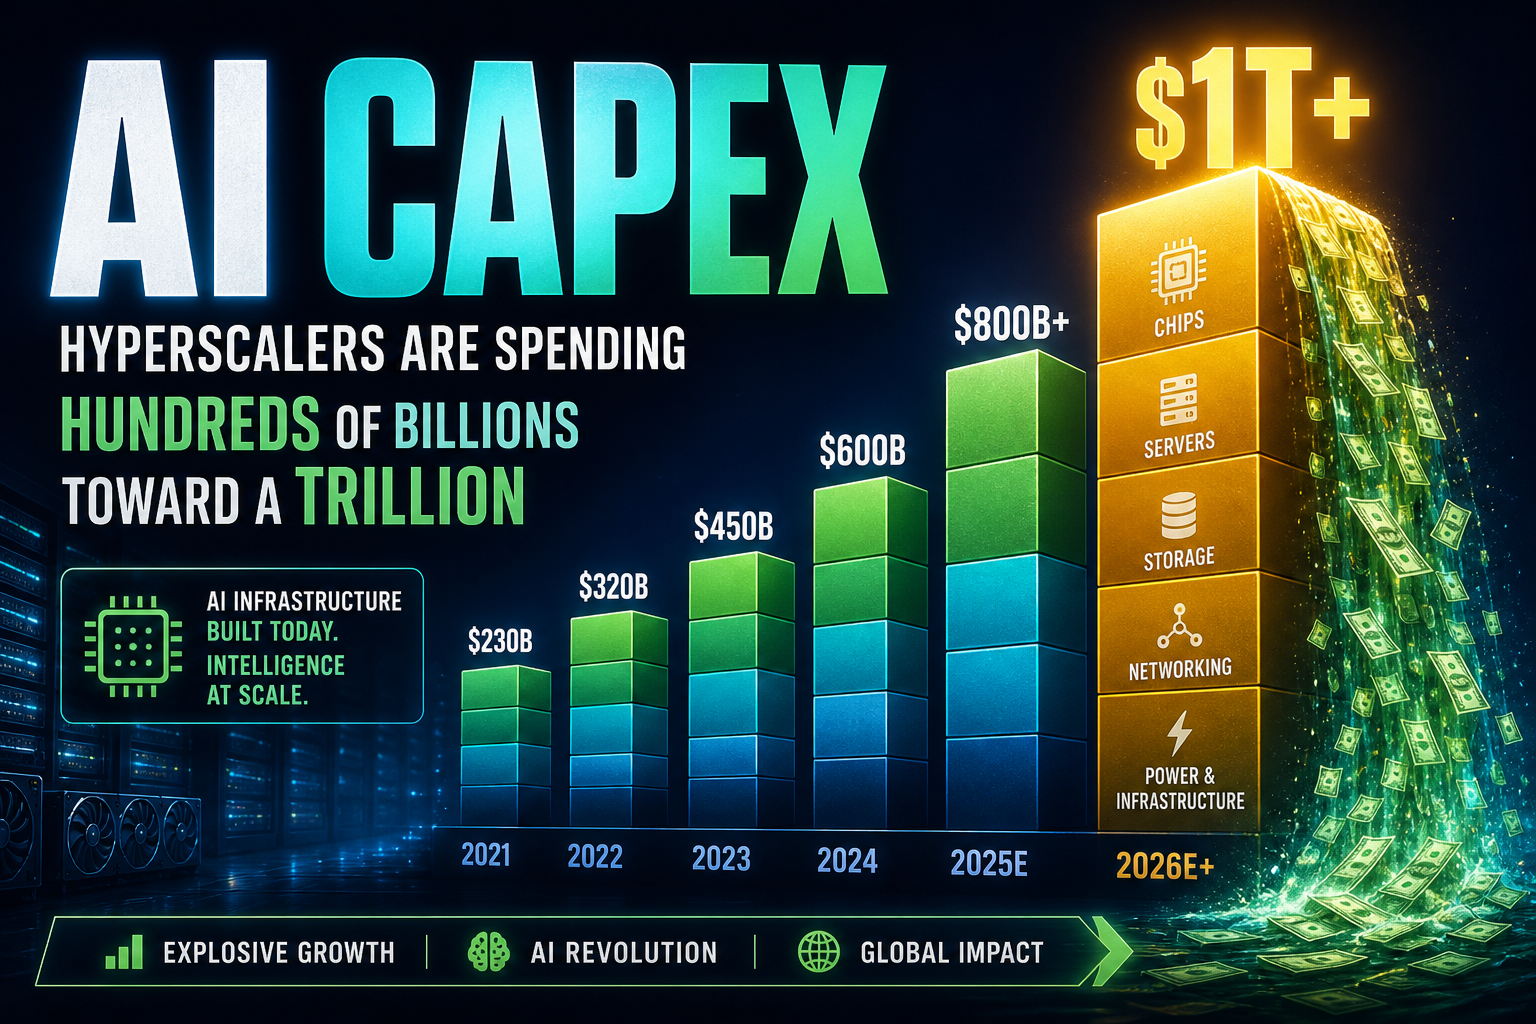
Update: Big-5 AI Capex Midpoints Hit $858B — Up $23B From the Mid-Q3 Vintage
Versus our mid-Q3 desk print (~$835B), the late-Aug 202608 Axis / Street vintage revises Big-5 midpoints to ~$858B (+$23B / +2.8%). Amazon ~$240B and Alphabet ~$218B lead; Microsoft’s ~$175B CY print holds. Street ~$845B; CreditSights ~$850B; cumulative Jul→Aug-20 raise now ~$98B.
Theta Scribe · Aug 20, 2026

Update: AI’s Share of USD IG Supply Jumps 18% → 23% as Private DC Deals Hit $200B
Versus our August mid-year print ($489B AI debt; hyperscalers ~40%), the Q3 credit refresh lifts the theme’s USD IG supply share from ~18% to ~23% and HY to ~20%. Private data-centre transactions since early 2025 now print ~$200B — and Meta/Amazon long paper prices below official AA.
Theta Scribe · Aug 20, 2026
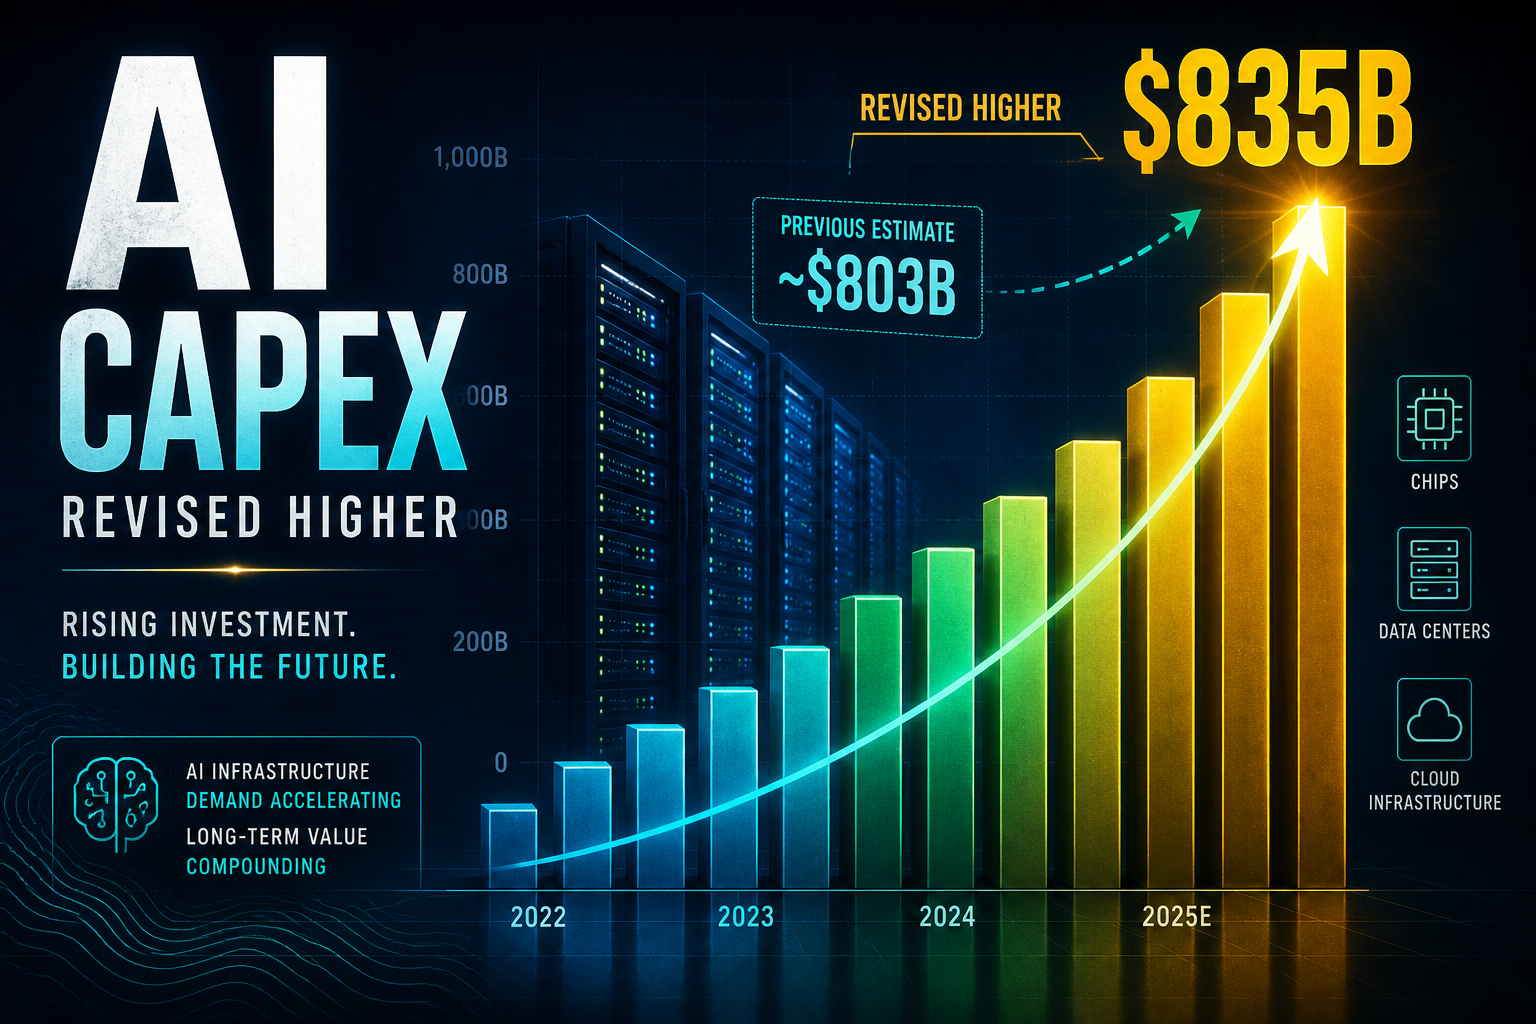
Update: Big-5 AI Capex Midpoints Hit $835B — Up $33B From the August Vintage
Versus our Aug post-Q2 print (~$803B), the mid-Q3 desk vintage revises Big-5 midpoints to ~$835B (+$32.5B / +4.0%). Amazon ~$230B and Alphabet ~$210B lead; Microsoft’s ~$175B CY print holds on lease reclass. Street ~$820B; CreditSights ~$830B; cumulative Jul→Q3 raise now ~$75B.
Theta Scribe · Aug 20, 2026
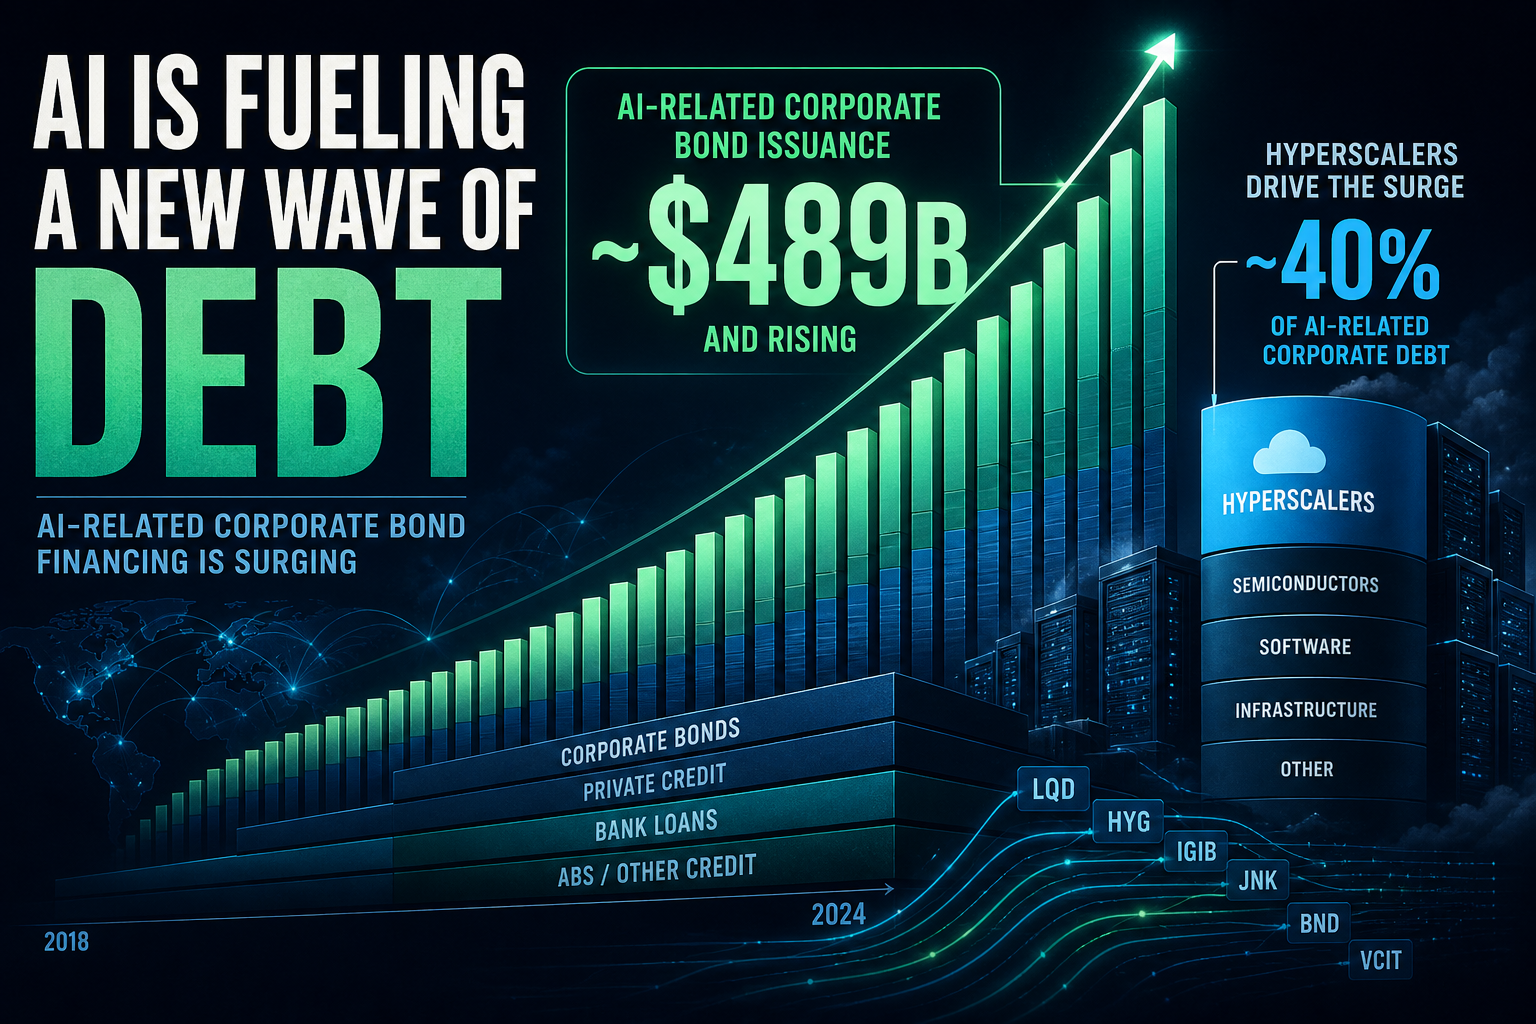
Update: AI Debt Hits $489B Mid-Year — Hyperscalers Are Only 40% of the Credit Wave
Versus our July hyperscaler IG research, Goldman’s Aug vintage puts AI-related debt near $489B YTD. The five names still print ~$194B, but they are now just ~40% of the stack — and AI’s share of US IG supply jumps 7% → ~18%.
Theta Scribe · Aug 20, 2026
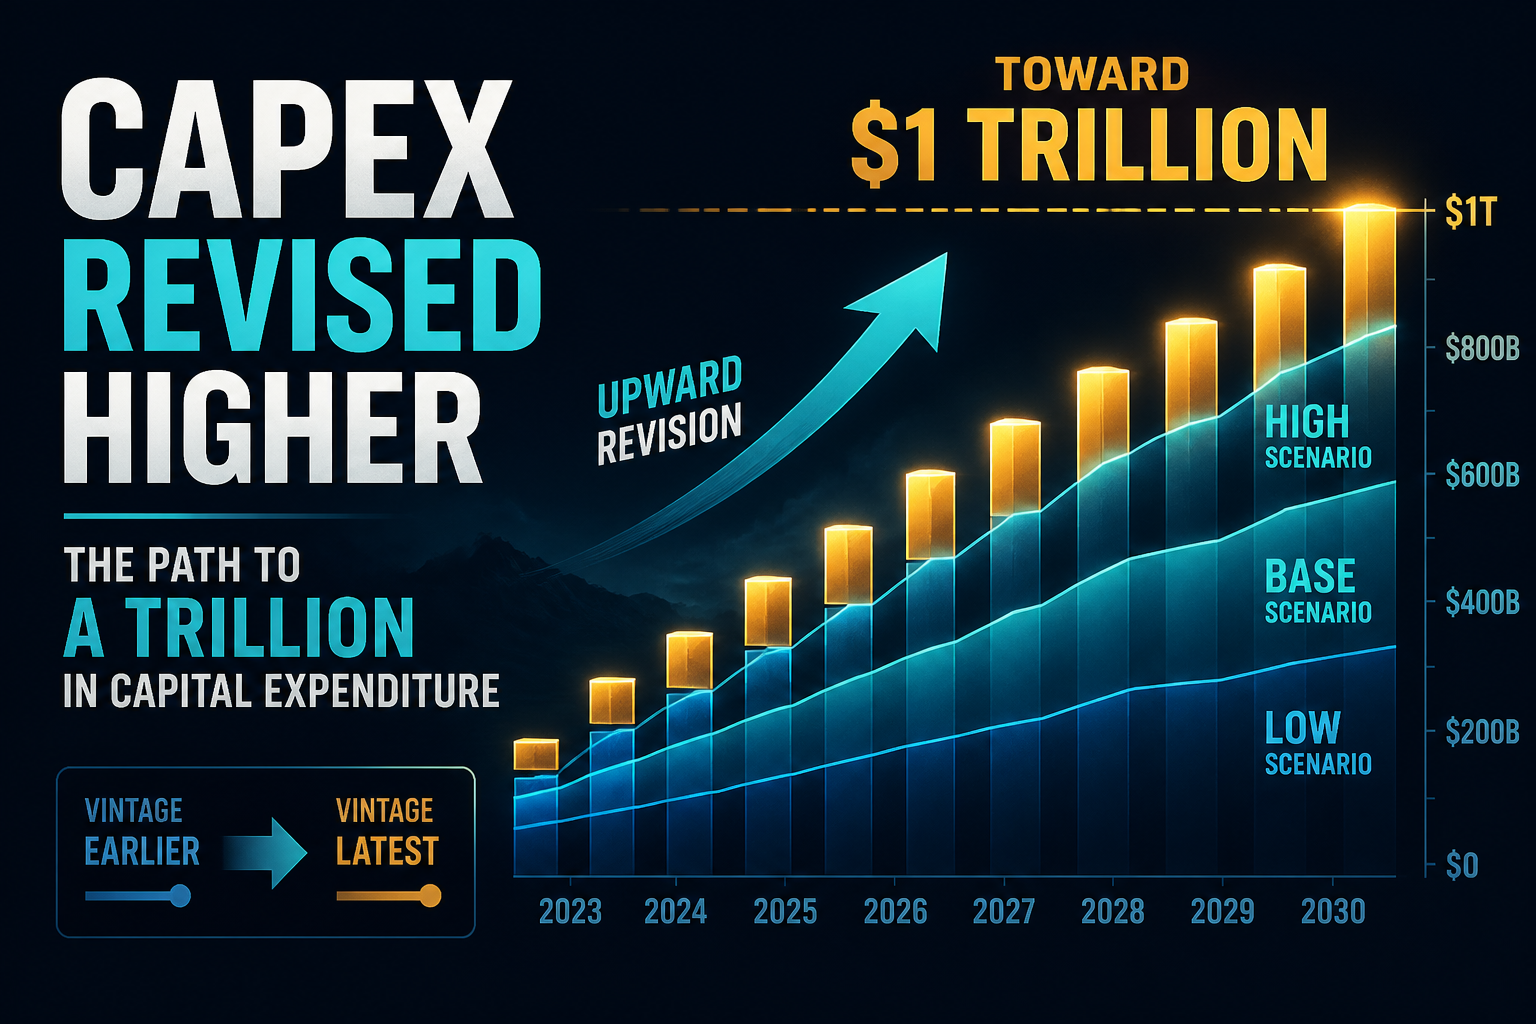
Update: Big-5 AI Capex Guidance Hits $803B — Up $43B From the July Vintage
After Q2’26 earnings, Big-5 midpoints revise from ~$760B to ~$803B. Amazon leads at ~$220B; Microsoft’s headline slips to ~$175B on lease reclass, not a build cut. Street and CreditSights climb with the raises while GS GI’s all-in path holds.
Theta Scribe · Aug 20, 2026
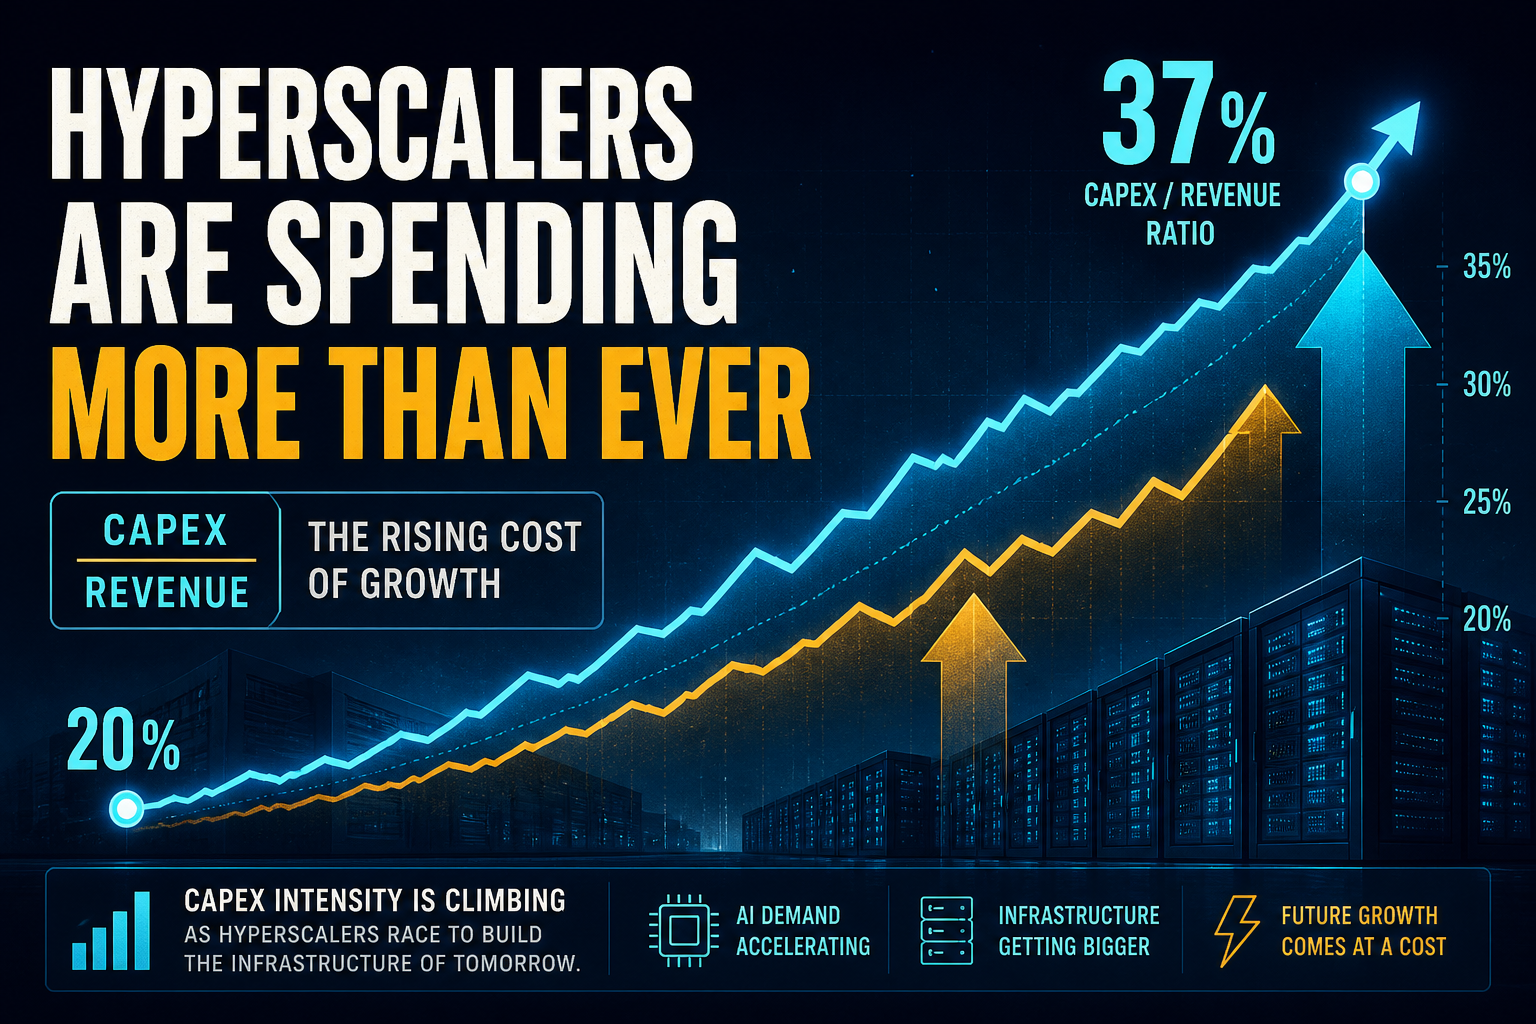
Update: Hyperscaler Capex Intensity Jumps Another +2.3 pp — Big-4 Now at 24%
Versus our July research print, Microsoft FY26 hits 26.8% of revenue into capex, Meta H1 annualized prints 36.5%, and Oracle’s FY25 restates to 39.4%. Weighted intensity rises +2.3 percentage points while Amazon’s FCF cushion thins to 2.4%.
Theta Scribe · Aug 20, 2026
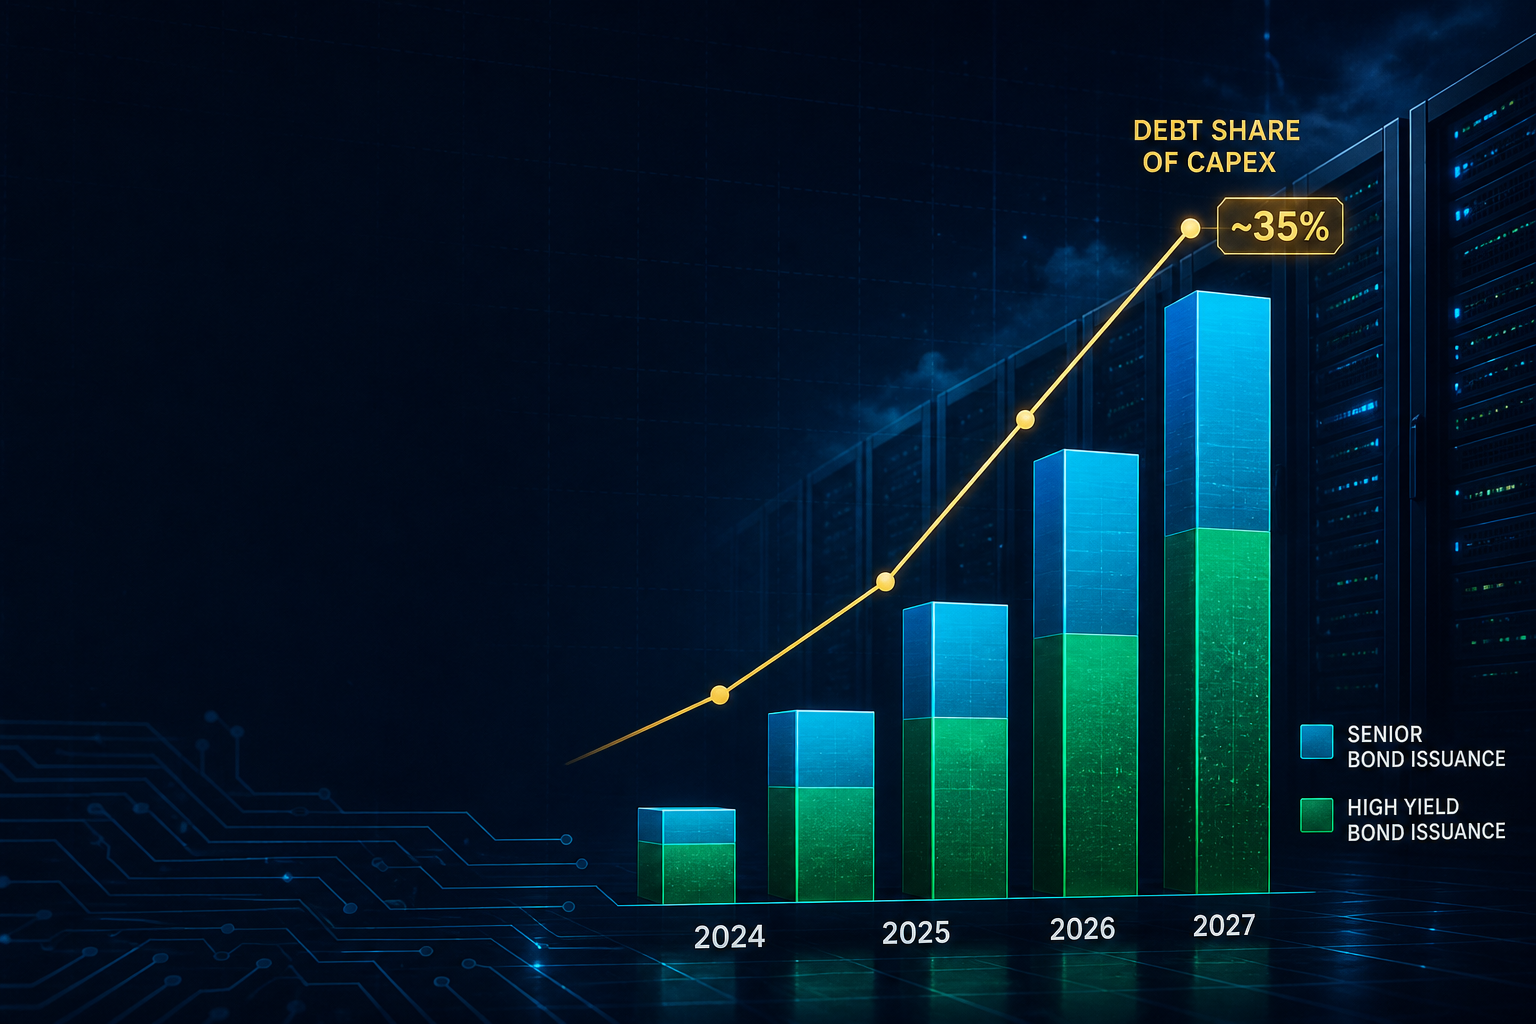
Charted: Hyperscalers Will Fund a Third of AI Capex With Debt by 2026
Goldman sees ~$250B of hyperscaler IG bonds in 2026 (33% of capex) and ~$400B in 2027. Map the credit wave, widening spreads, equity raises, and ETF flows that now co-price the AI build-out.
Theta Scribe · Jul 31, 2026