
Theta Scribe · Research desk
Public data, charted in public
We build original interactive figures from official datasets, then write the analysis those figures support — units, vintages, and caveats included. This is a research publication, not a scraped-stats gallery or an ads-first doorway.
Featured original work
Start with these visual essays
Curated from the desk — not a chronological dump of the full library. Each piece has an original figure and a sourced argument you can check against the agency file.

155 Countries Still Lock Their Exchange Rate to Someone Else's Currency
Sep 2, 2026
Theta Scribe
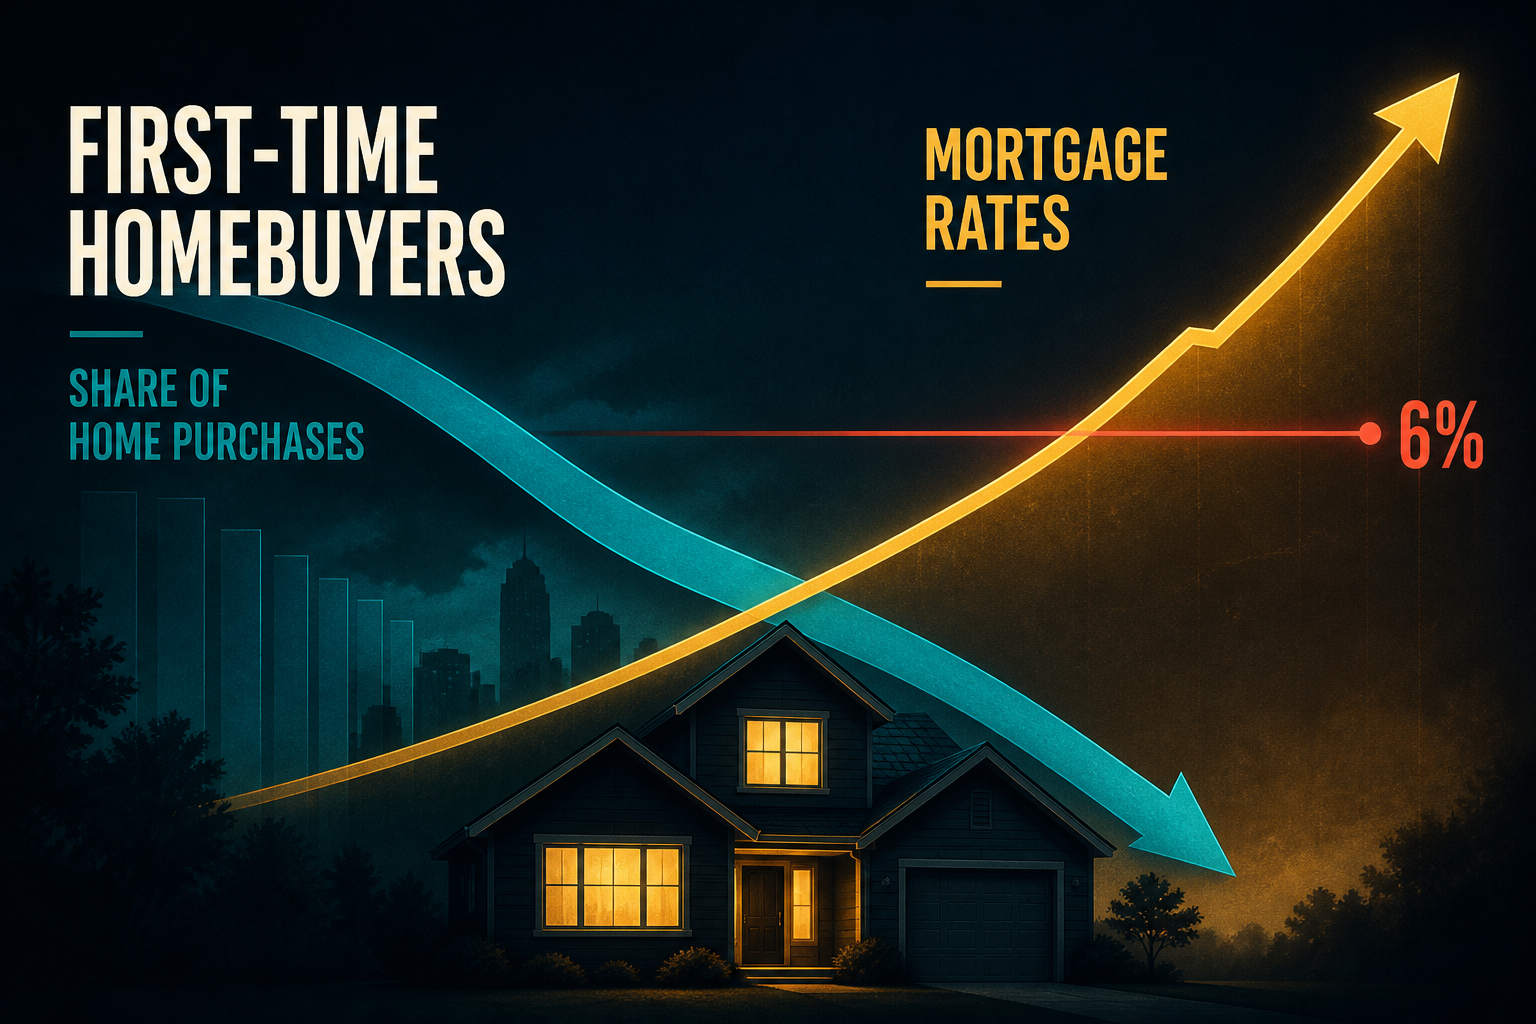
First-Time Buyer Share Fell to 21% While 30-Year Rates Stayed Above 6%
Sep 2, 2026
Theta Scribe
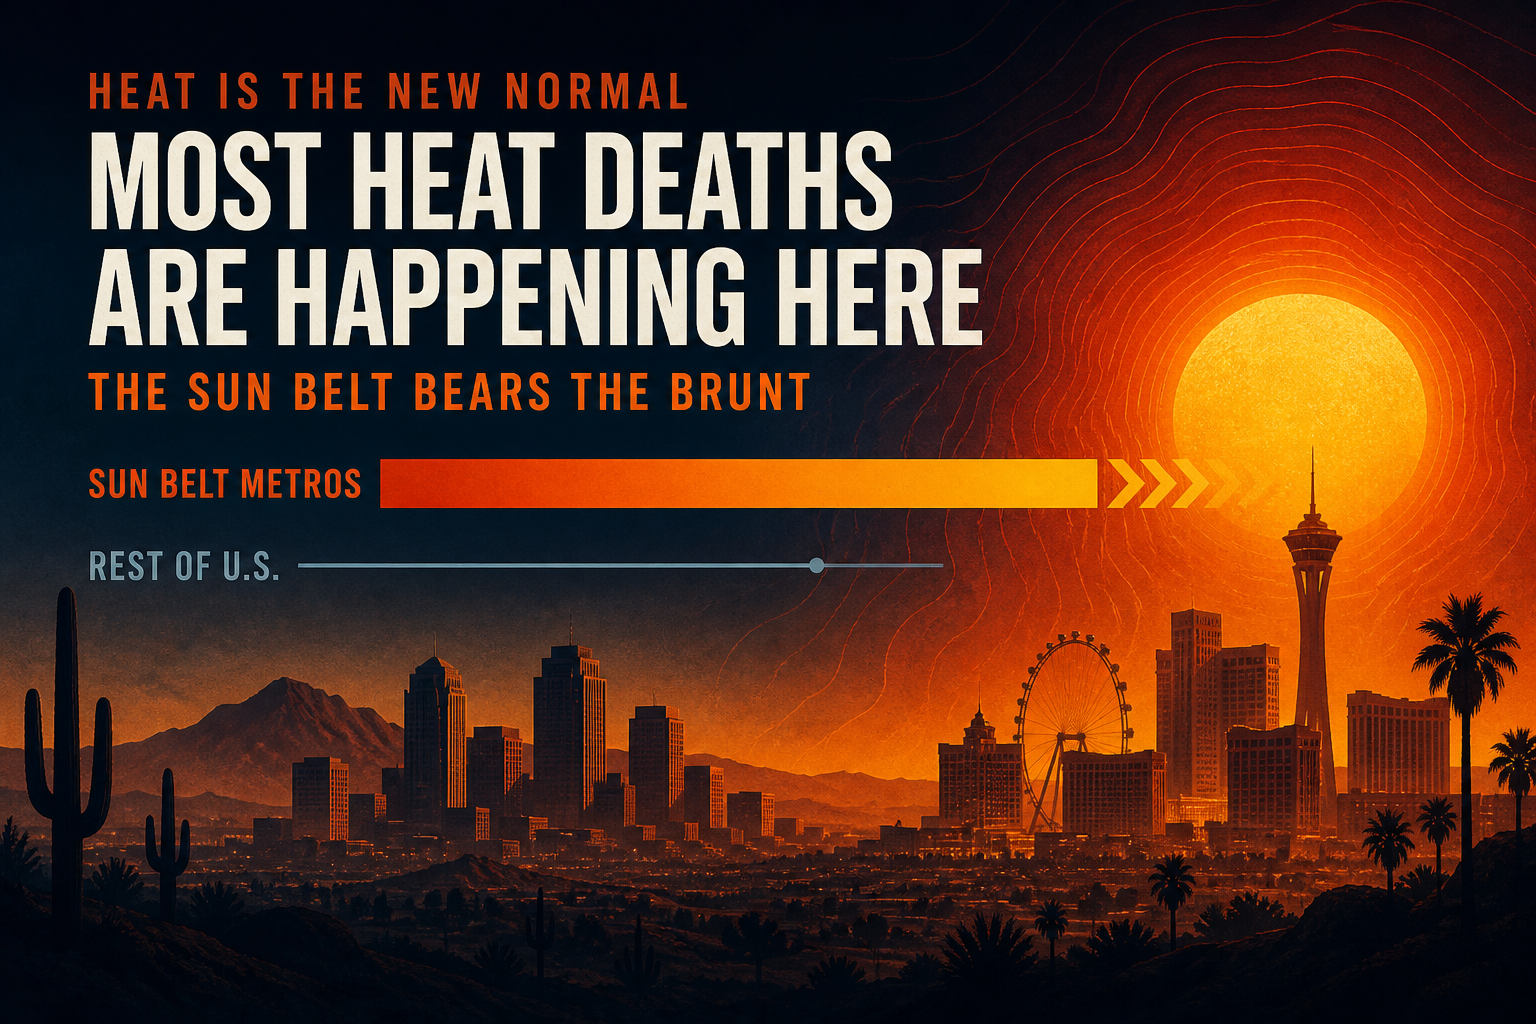
Phoenix and Las Vegas Alone Took Nearly 12% of U.S. Heat-Coded Deaths
Sep 2, 2026
Theta Scribe
From the desk
Newest original stories. The homepage is a magazine front — the full catalog is the archive.
6 of 9
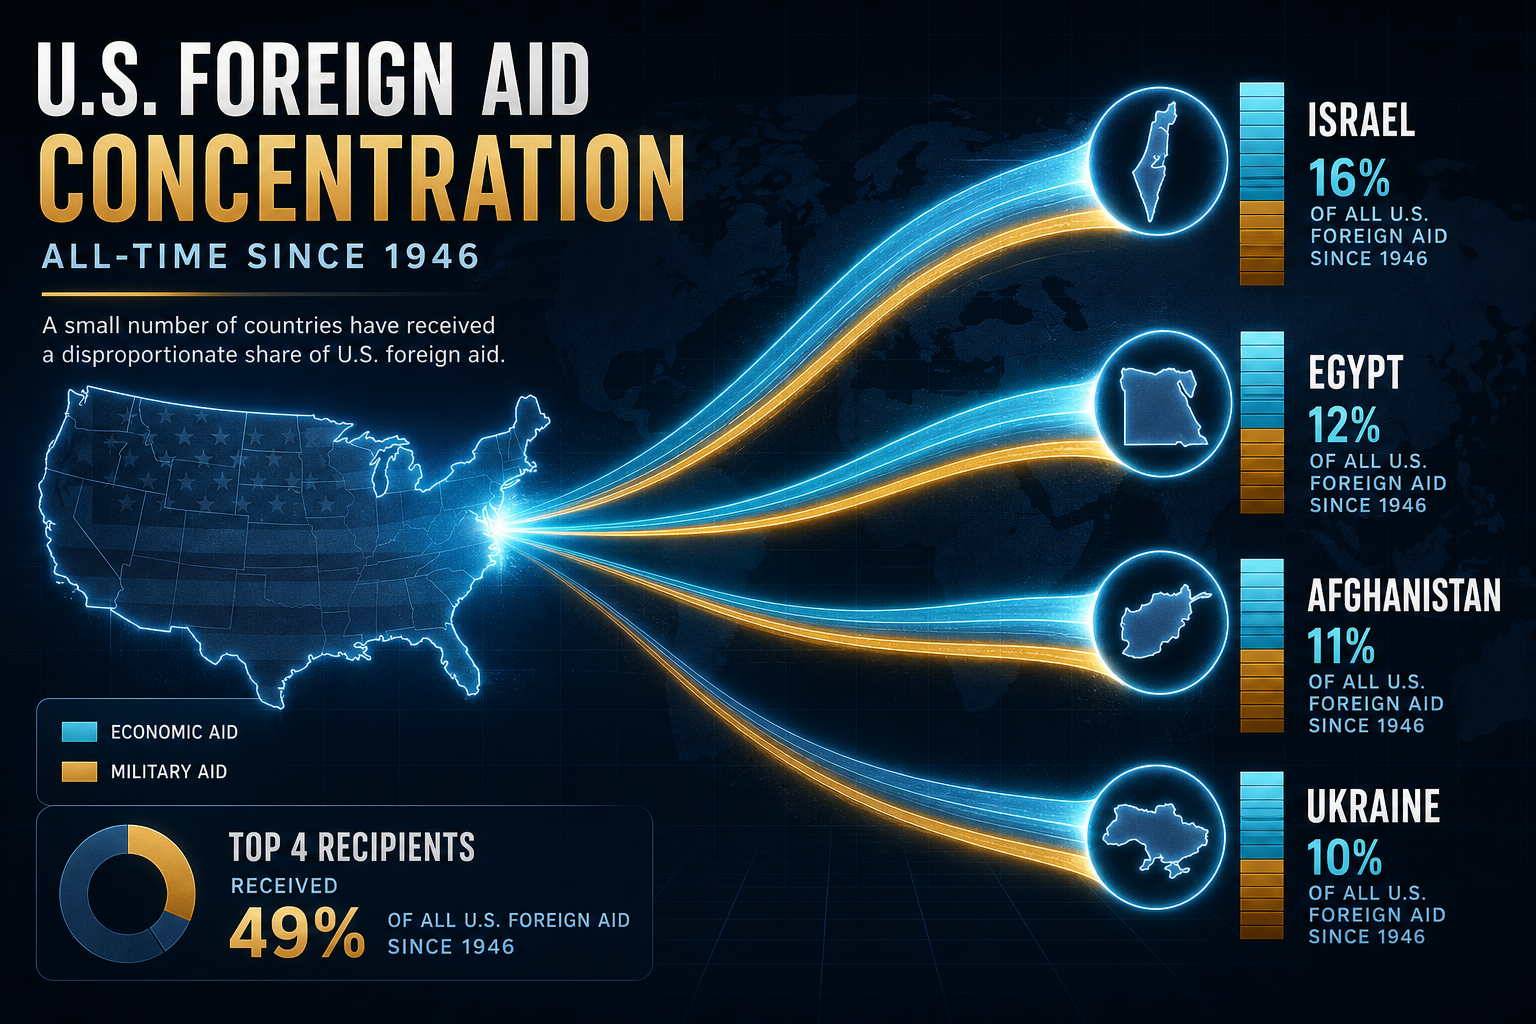
Charted: Four Countries Took 25% of All US Foreign Aid Since 1946 — FY2025 Obligations Halved
ForeignAssistance.gov obligations in constant FY2025 dollars: $3.76 trillion all-time across 204 country recipients — 68.5% economic / 31.5% military. Israel (~$373B), Egypt (~$229B), Afghanistan (~$204B), and Ukraine (~$155B) dominate the ledger; FY2025 fell to $48.3B from a $105.3B FY2023 peak.
Theta Scribe · Sep 3, 2026
155 Countries Still Lock Their Exchange Rate to Someone Else's Currency
IMF AREAER 2023 de facto classes, updated through September 2026 — two world maps and a country table covering hard pegs, soft parities, dirty floats, crawl-likes, and the dual-rate regimes where the official price is not the price you get.
Theta Scribe · Sep 2, 2026
First-Time Buyer Share Fell to 21% While 30-Year Rates Stayed Above 6%
NAR's Profile prints first-time buyers at a record-low 21% after Freddie Mac's 30-year average spent 2023–2025 above 6%. The typical first-time buyer is now 40 — seven years older than in 2021.
Theta Scribe · Sep 2, 2026
Phoenix and Las Vegas Alone Took Nearly 12% of U.S. Heat-Coded Deaths
Across 2018–2023, Maricopa and Clark counties logged 1,039 CDC heat-coded deaths — about 11.9% of the national total — while U.S. heat mortality climbed from 1,008 to 2,325.
Theta Scribe · Sep 2, 2026

Largest PIT CoCs Do Not Always Print the Tightest Rental Vacancy
New York City's January 2025 PIT hit 125,683 while New York state's HVS rental vacancy sat at 5.3%. California CoCs stack high counts against a 4.8% state vacancy; Texas metros sit lower on the PIT ladder with ~11% vacancy.
Theta Scribe · Sep 2, 2026
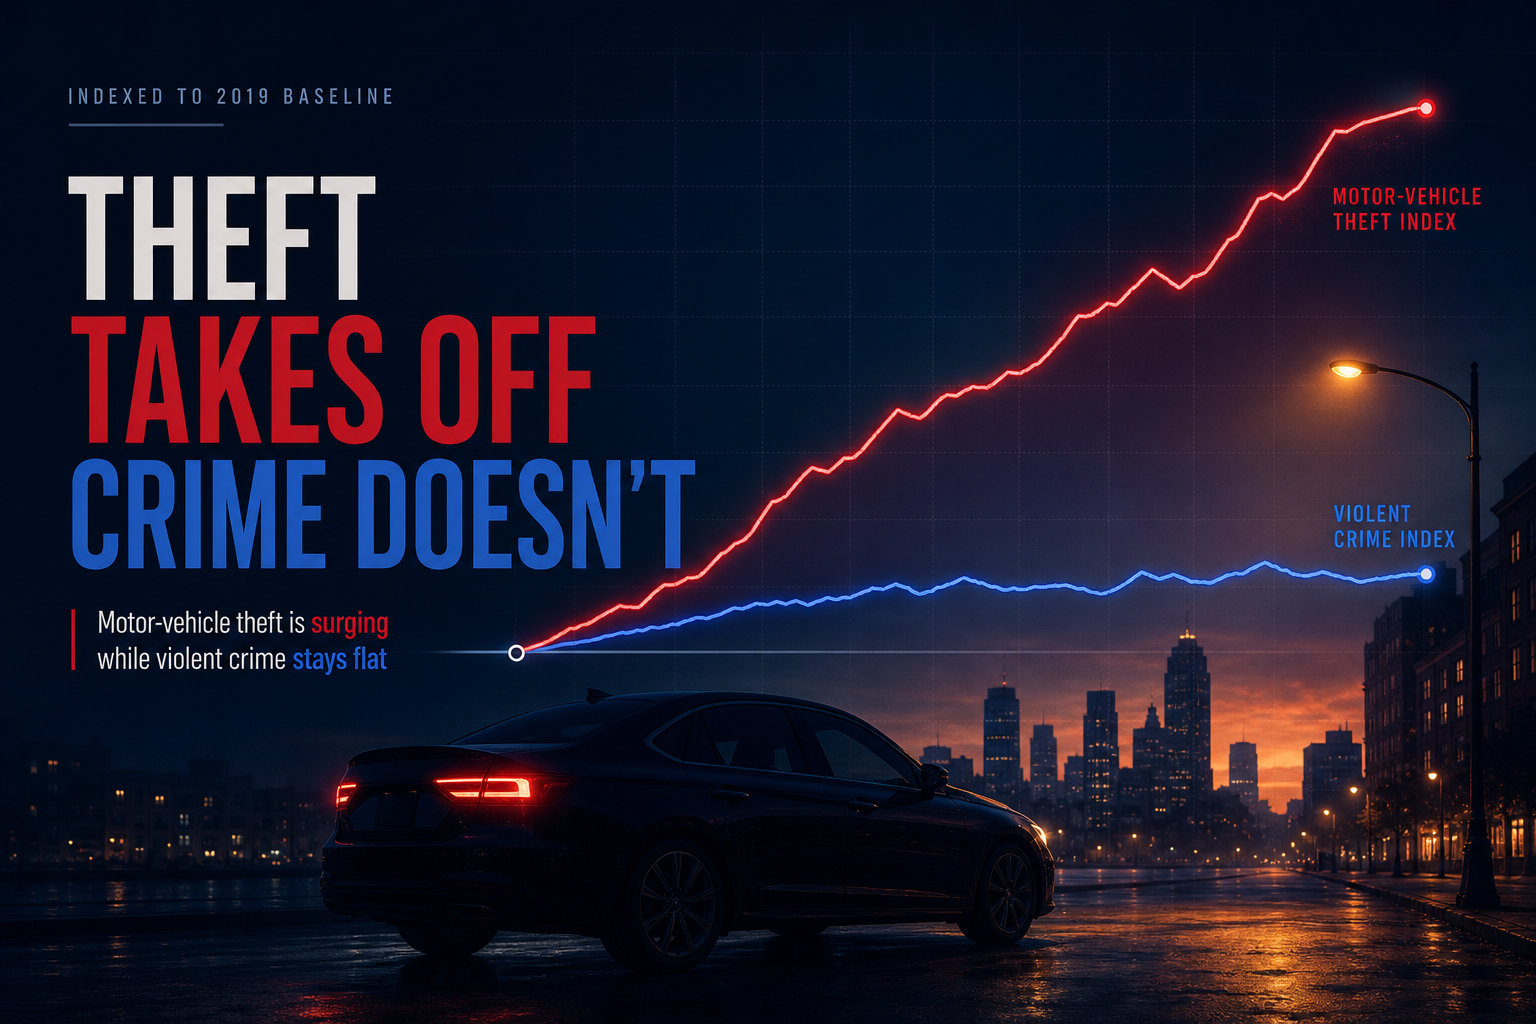
MV Theft Index Hit 145 While Violent Crime Sat Near 99 — Then Both Retreated
Indexed to 2019, FBI motor-vehicle theft rose to 144.9 by 2023 while the violent-crime index slipped to 99.2. The 2024 retreat cut MV theft volume by about 19%, but the rate is still above its pre-pandemic baseline.
Theta Scribe · Sep 2, 2026
Showing 6 of 9 stories
Browse topics
Explore by Category
Original visual essays grouped by beat — each topic is a desk, not a doorway of recycled templates.
Economics
Growth, trade, and fiscal flows
Politics
Power structures and governance
Finance
Bank credit and commercial lending
Technology
Infrastructure and digital systems
Global Systems
Chokepoints, fiscal plumbing, and structural flows
Energy
Power grids, fuels, and climate stress
Industry
Factories, fabs, and physical automation
Consumer Finance
Household debt, savings, and retail money
Capital Markets
Bonds, ETFs, and corporate capital flows
Health Economics
Drugs, trials, and the cost of staying alive
Labor & Skills
Wages, unions, and the changing workforce
Real Estate
Housing, land use, and the built economy
Food & Agriculture
Crops, herds, and the price of a full plate
Transport & Logistics
Ports, rails, and the cost of moving things
Start here
New to Theta Scribe?
The archive is large because each story is a separate research question — not because we recycle the same template. Three short stops before you browse by date:
- 1. Who publishes this
Meet the desk: independent operator, original figures, named public sources.
Open → - 2. How numbers are handled
Source hierarchy, vintages, comparability rules, and the corrections path.
Open → - 3. Read a full essay
Open any archive piece for the chart, the argument, and the cited agencies.
Open →
Why this desk exists
Visual essays with a paper trail
Theta Scribe publishes standalone analyses. Each piece is meant to be read as original work — a chart you will not find copied from a ranking mill, plus the argument that makes the chart usable.
Original charts
Figures are built for the story they sit in. We do not paste another outlet’s graphic or publish a screenshot gallery.
Named public sources
Numbers come from statistical agencies, regulators, and official ledgers. The originating file is cited so you can check it.
Analysis, not a dump
A KPI without a definition is advertising copy. We state what is being counted, for whom, and in which vintage.
Full policy: editorial standards. Publisher identity: About Theta Scribe.
Editorial scope
What we publish — and what we refuse
Reviewers should be able to tell a research desk from a chart mill in one scroll. This is the short version; the full policy lives on editorial standards.
We publish
- Standalone visual essays: one question, one original figure set, one sourced argument.
- Interactive charts built for the story from public statistical products.
- Named agencies, vintages, and definitions next to the claim — not a naked KPI.
- Corrections when a number or framing is wrong, documented on the story.
We do not publish
- Scraped ranking galleries or screenshot farms from other outlets.
- Sequel chains that restate the same chart with a new quarter stamp.
- Placeholder copy, invented comments, or fake social proof.
- Doorway pages whose only job is to host ads around thin text.