
Research desk
Politics
48 original visual essays in this beat — each with its own figure and sourced argument, not a sequel of the last chart.
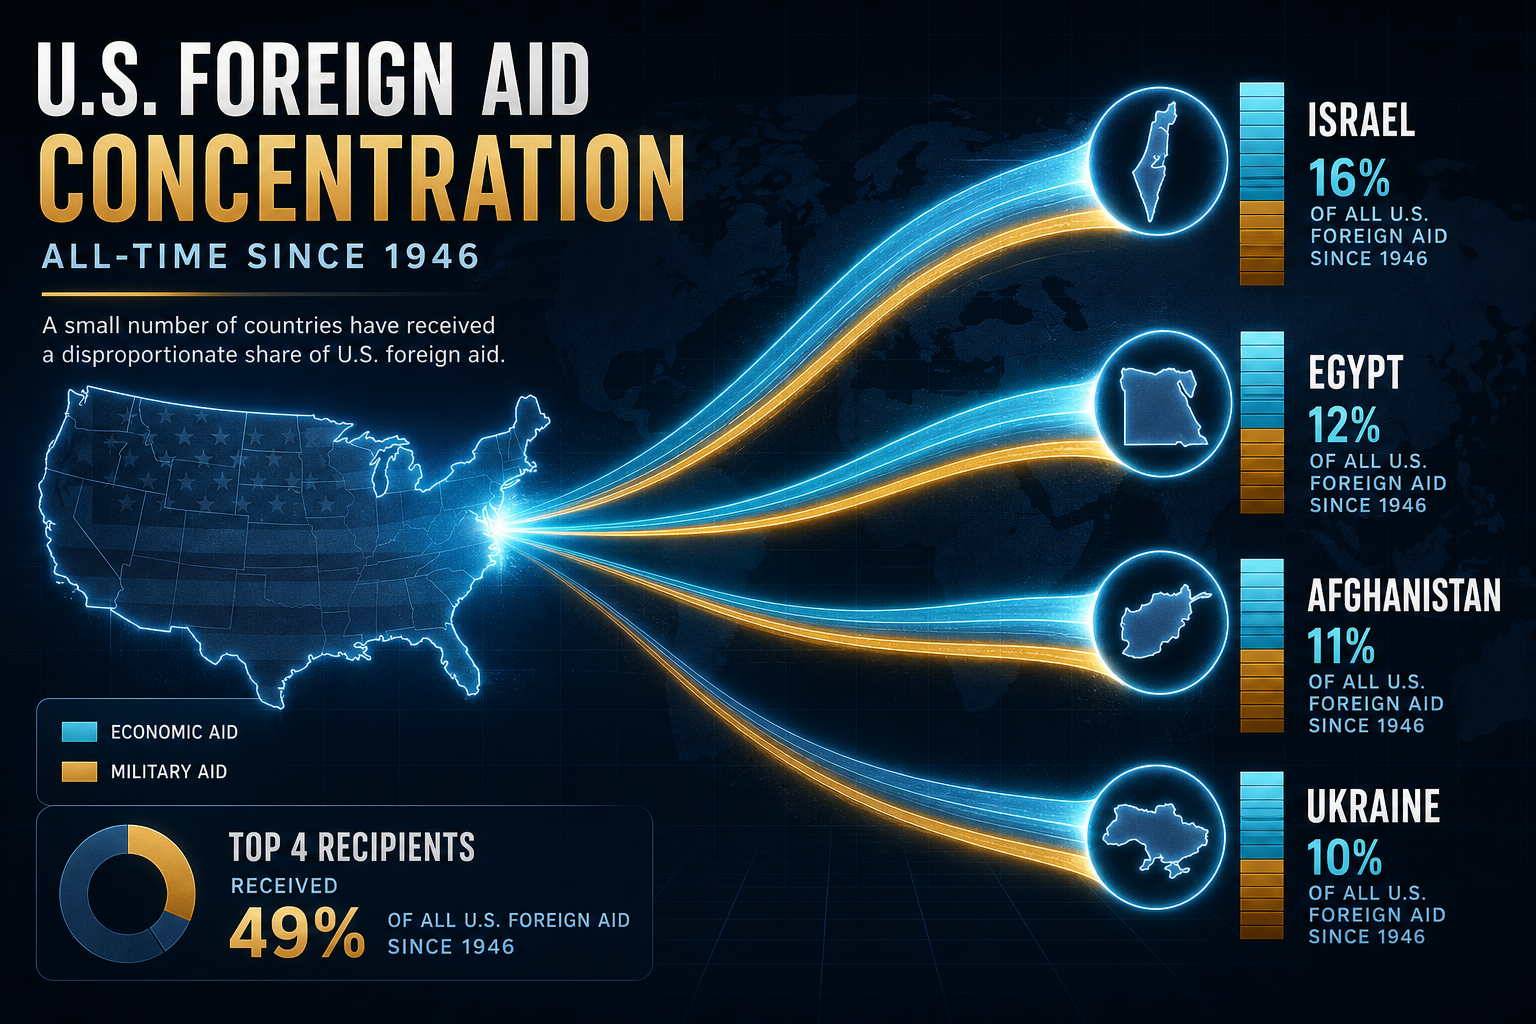
Charted: Four Countries Took 25% of All US Foreign Aid Since 1946 — FY2025 Obligations Halved
ForeignAssistance.gov obligations in constant FY2025 dollars: $3.76 trillion all-time across 204 country recipients — 68.5% economic / 31.5% military. Israel (~$373B), Egypt (~$229B), Afghanistan (~$204B), and Ukraine (~$155B) dominate the ledger; FY2025 fell to $48.3B from a $105.3B FY2023 peak.
Theta Scribe · Sep 3, 2026

Largest PIT CoCs Do Not Always Print the Tightest Rental Vacancy
New York City's January 2025 PIT hit 125,683 while New York state's HVS rental vacancy sat at 5.3%. California CoCs stack high counts against a 4.8% state vacancy; Texas metros sit lower on the PIT ladder with ~11% vacancy.
Theta Scribe · Sep 2, 2026

MV Theft Index Hit 145 While Violent Crime Sat Near 99 — Then Both Retreated
Indexed to 2019, FBI motor-vehicle theft rose to 144.9 by 2023 while the violent-crime index slipped to 99.2. The 2024 retreat cut MV theft volume by about 19%, but the rate is still above its pre-pandemic baseline.
Theta Scribe · Sep 2, 2026
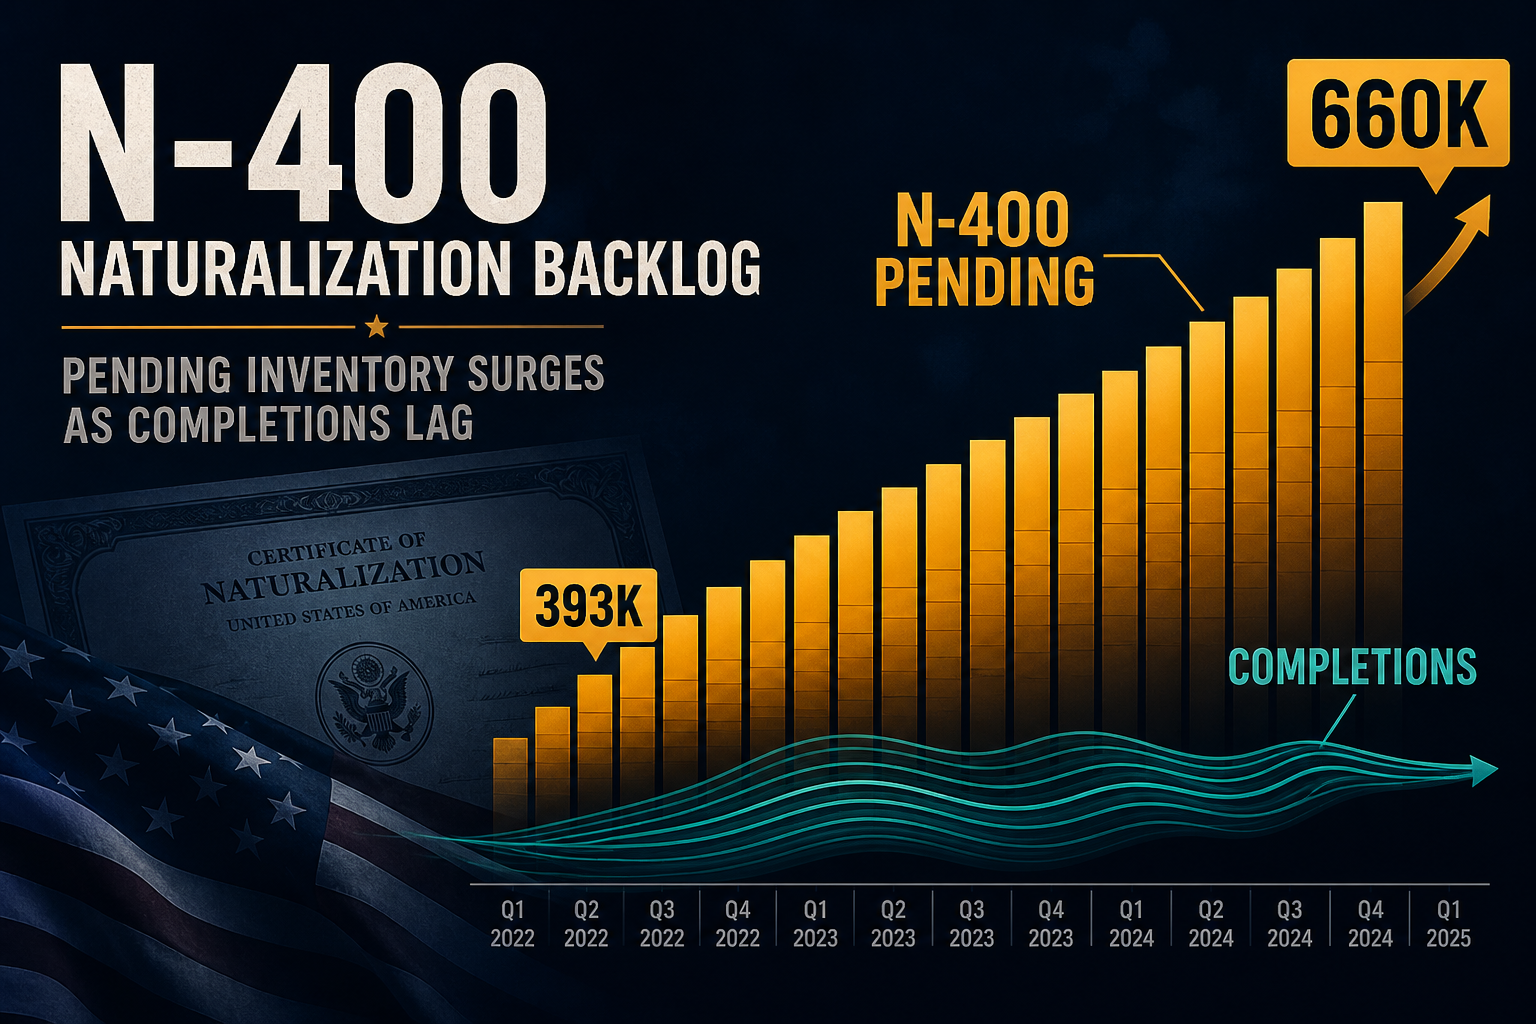
N-400 Backlog: Pending Naturalization Forms Hit 660k as Quarterly Completions Lag Receipts
USCIS civilian N-400 pending inventory climbed from 393,563 in FY2024 Q1 to 648,583 by FY2026 Q2 — a 65% rise — while quarterly completions in that window repeatedly fell short of receipts and median processing time stretched from 4.7 to 7.4 months.
Theta Scribe · Aug 31, 2026
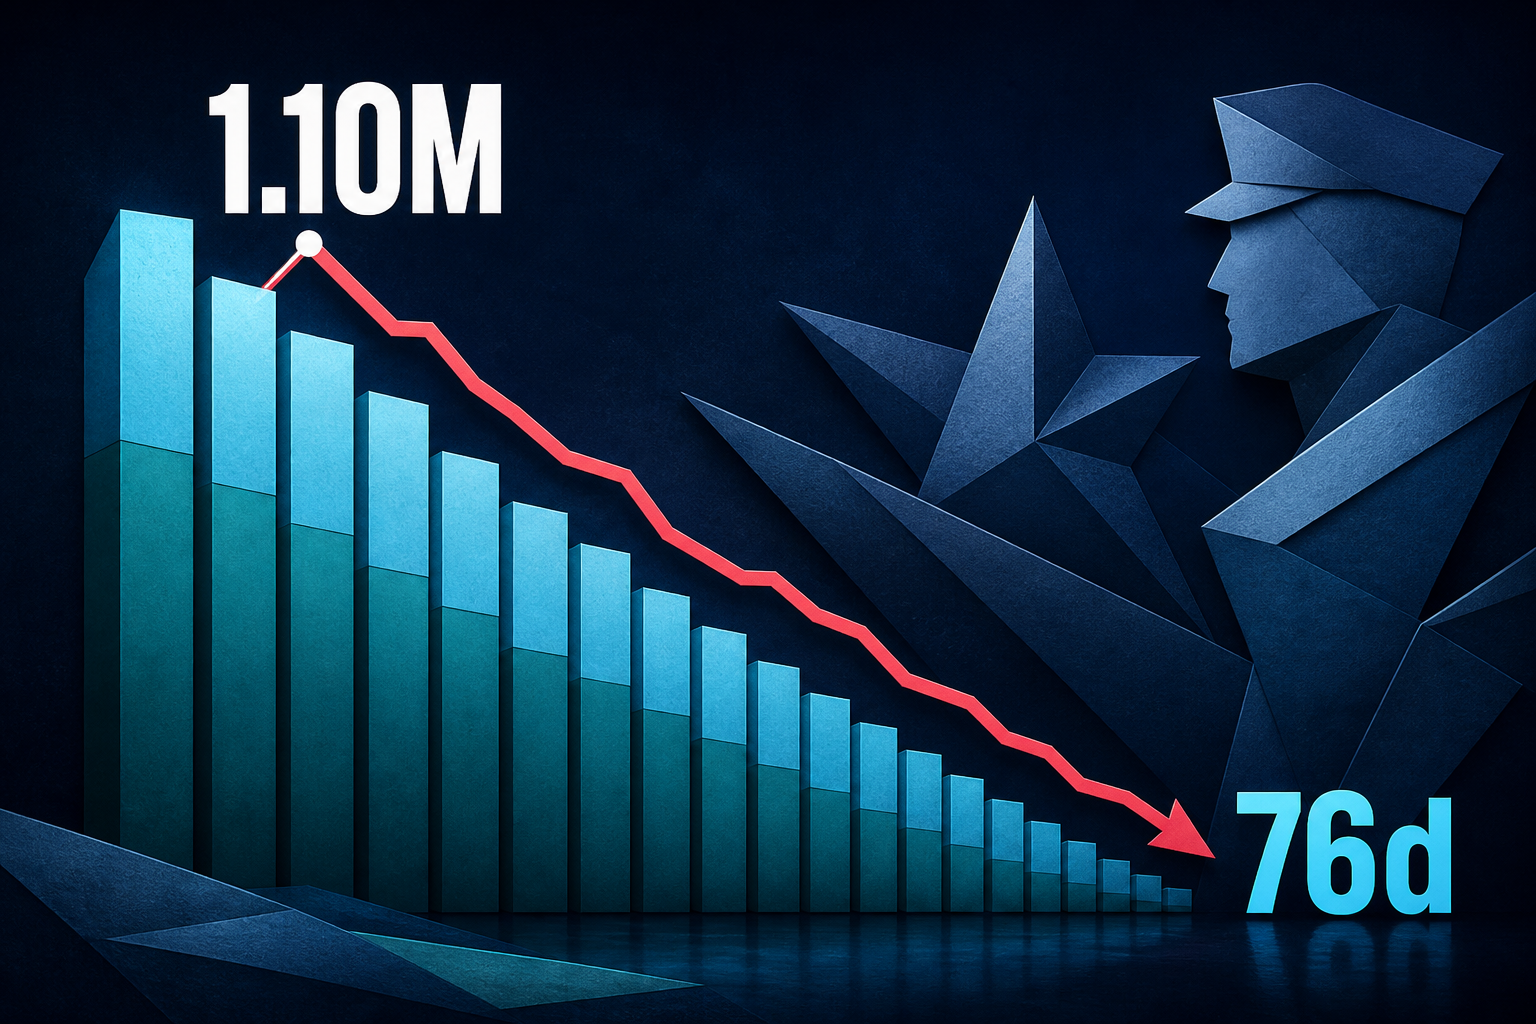
VA Rating Claims: Pending Inventory Fell 42% From Peak as Average Days to Complete Dropped Below 80
VBA Monday Morning Workload Reports show rating-bundle pending claims peaking near 1.10 million in October 2023, a backlog crest of about 418,000 in January 2024, and an August 2026 read of roughly 633,000 pending with average days to complete (FYTD) near 76 — well below the PACT Act surge.
Theta Scribe · Aug 30, 2026

85% Sheltered: How the Latest HUD PIT Increase Split Between Shelter and the Street
Of the 118,376 people added to the January 2024 Point-in-Time count, 100,762 were sheltered and 17,614 were unsheltered — about 85% of the jump was emergency shelter, transitional housing, or safe havens.
Theta Scribe · Aug 30, 2026
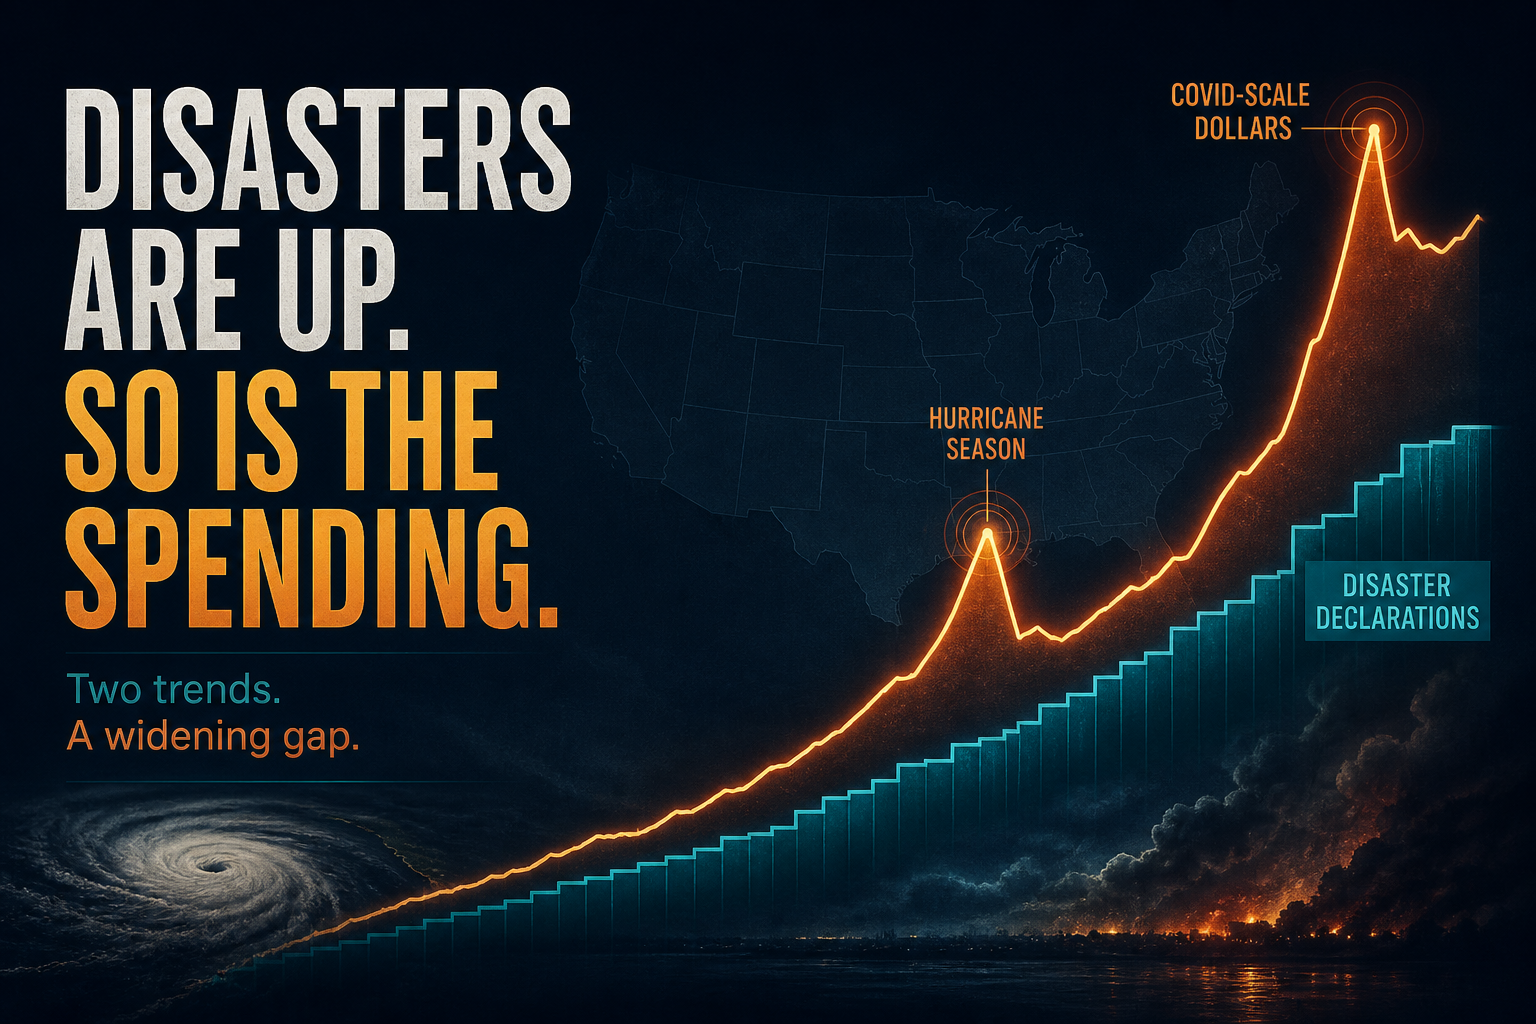
88 Declarations, Not 88 Equal Bills: FEMA Major Disasters vs Public Assistance Dollars
Unique FEMA major disaster declarations roughly doubled from FY2015 to a FY2024 peak of 88 — but federal Public Assistance dollars did not climb with them. Two declaration years (FY2017 hurricanes at $66B and FY2020 COVID PA at $105B) dominate the decade’s obligations.
Theta Scribe · Aug 30, 2026

3.7% of Peak: CBP Southwest Land-Border Encounters Versus 2022–2023 Highs
U.S. Border Patrol southwest land-border encounters in July 2026 were 9,295 — about 3.7% of the December 2023 peak of 249,740. The interactive below maps monthly totals against those prior highs by calendar month and fiscal year.
Theta Scribe · Aug 30, 2026
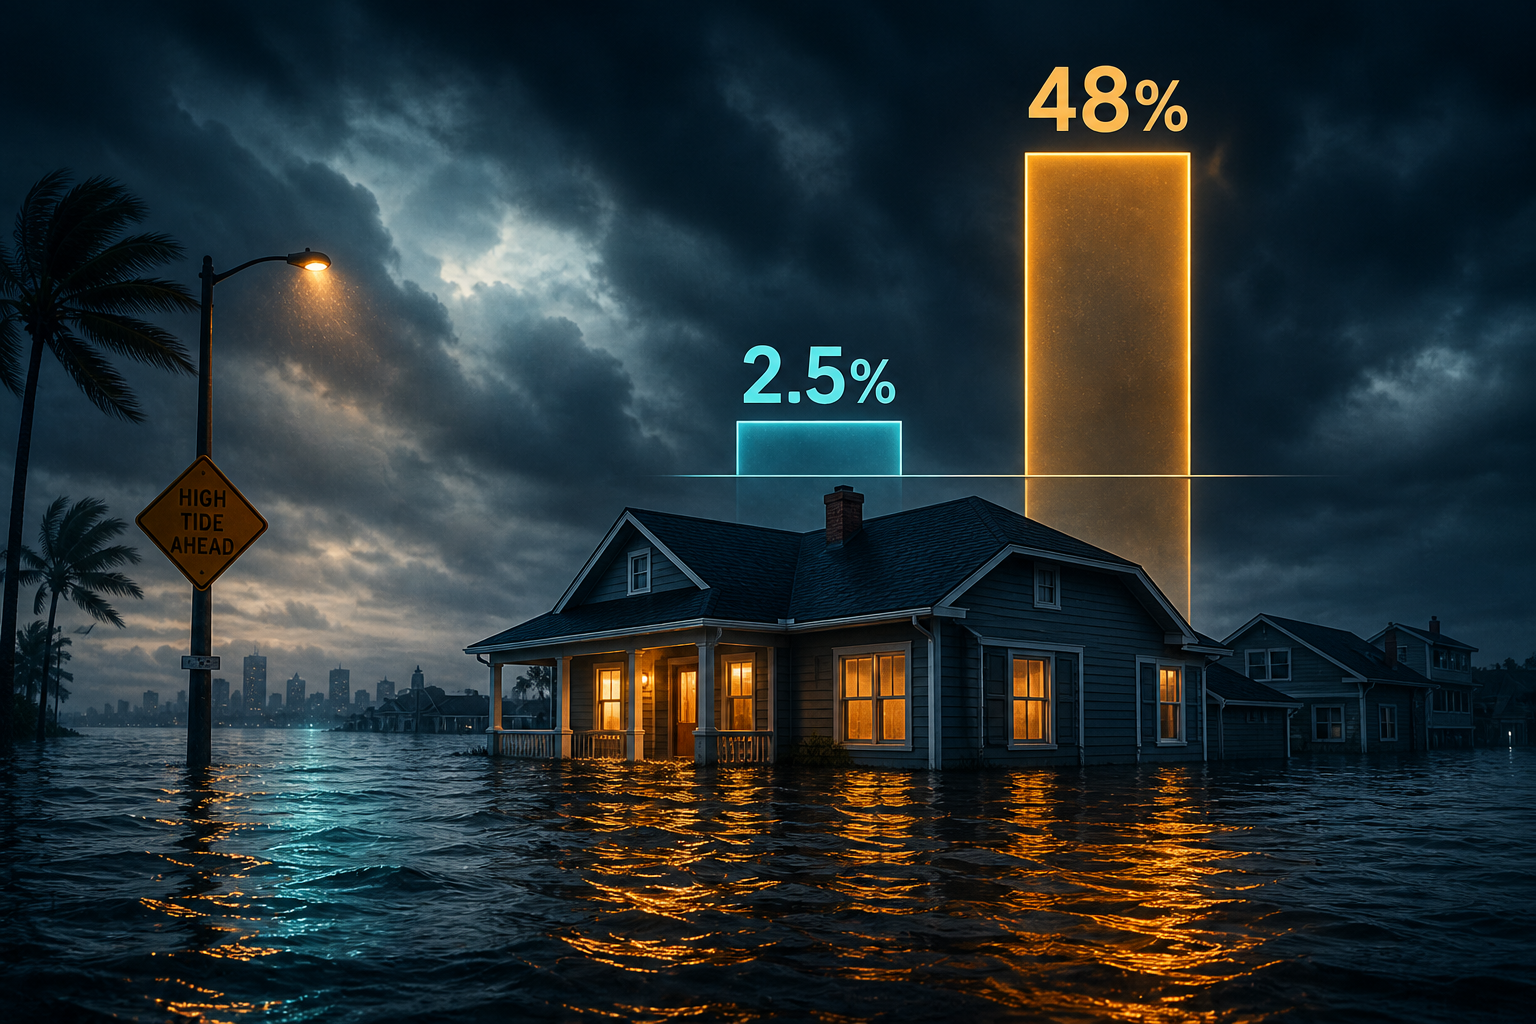
2.5% of NFIP Policies, 48% of Claim Dollars: The Repetitive-Loss Imbalance
Unmitigated repetitive-loss properties are about 2.5% of NFIP policies in force, yet properties with two or more losses have absorbed 48% of cumulative claim dollars. GAO and FEMA put the fiscal skew in plain numbers.
Theta Scribe · Aug 26, 2026
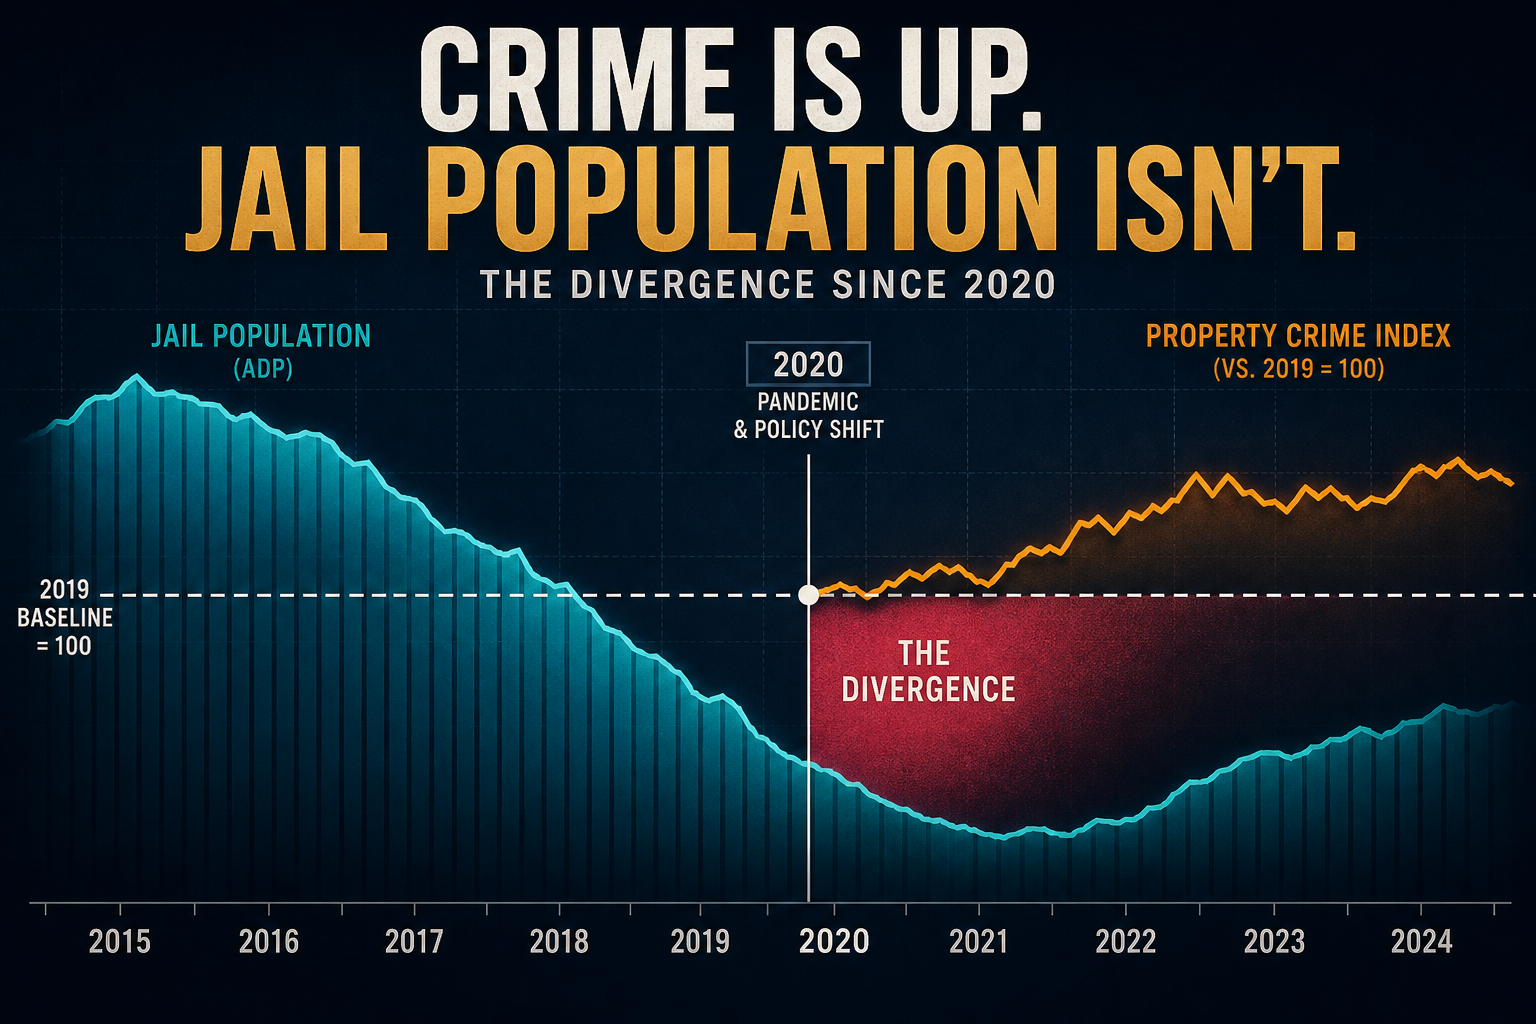
Jail ADP Still ~10% Below 2019 While Property Crime Recovers Closer to Baseline
BJS average daily jail population hit 664,800 in 2023—about 10.4% under the 2019 mark—after a 2021 trough. National property-crime rates (SRS then NIBRS Estimation) sit nearer their pre-pandemic level. The dual index shows jail stock did not refill in lockstep with property reports.
Theta Scribe · Aug 26, 2026
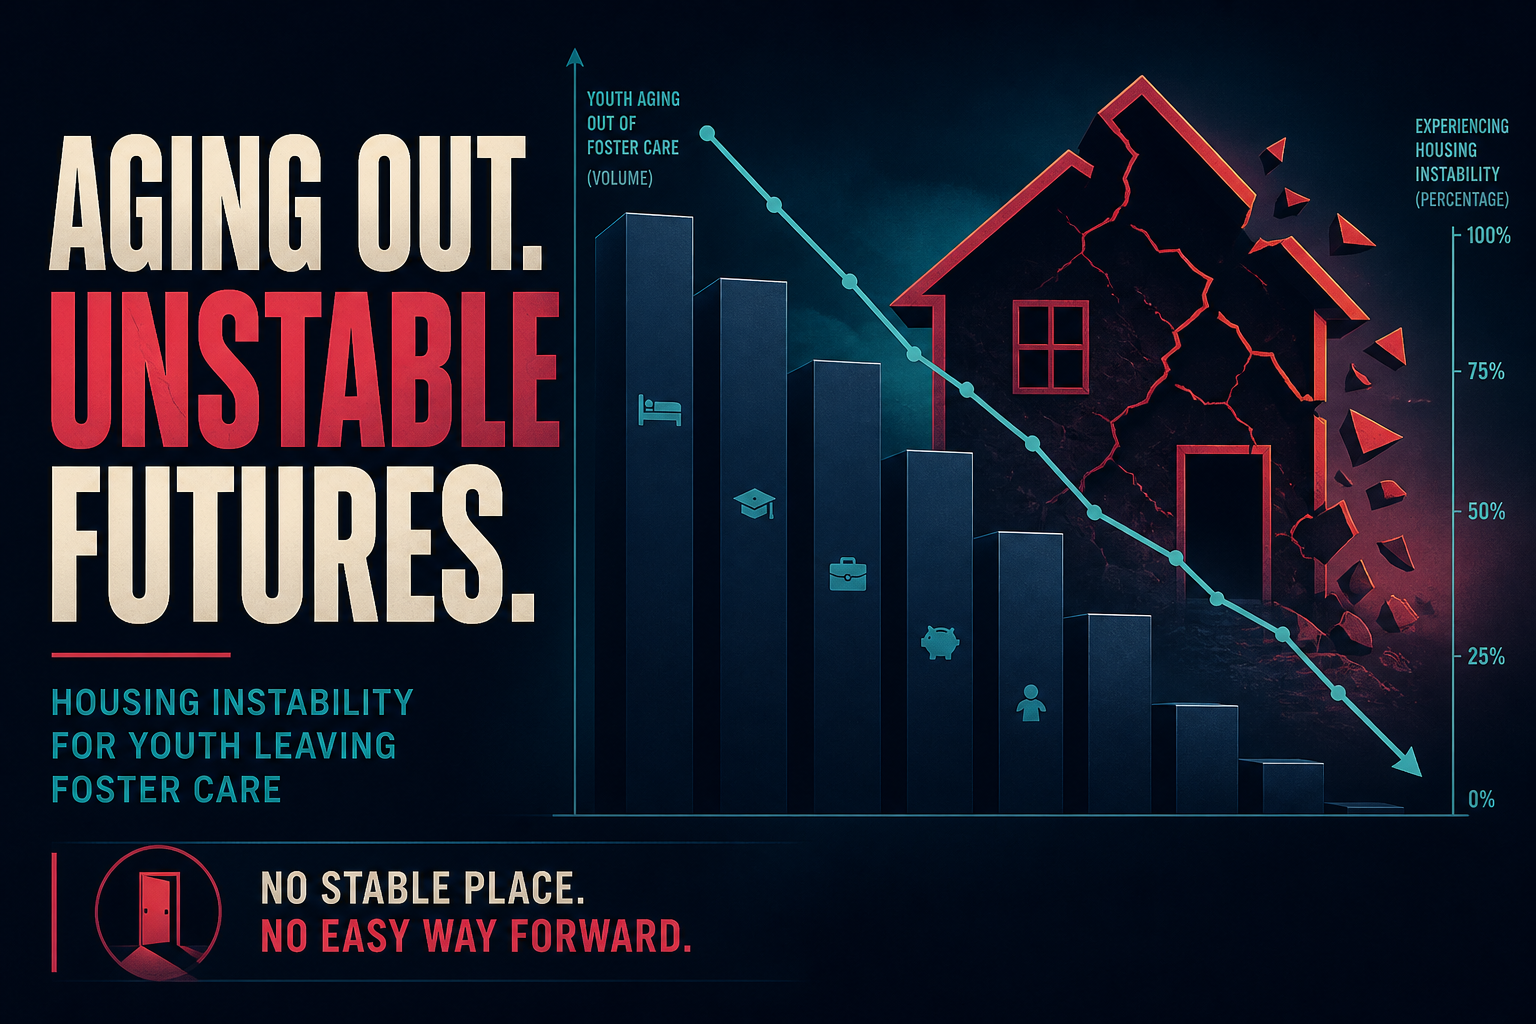
15,379 Youth Aged Out in FY2024 — NYTD Still Shows a Housing Gap at 21
AFCARS emancipation exits fell about 25% from FY2019 to FY2024, yet still make up roughly 9% of discharges. NYTD Cohort 3: 26% of 21-year-olds reported homelessness in the prior two years; 55% were employed.
Theta Scribe · Aug 26, 2026
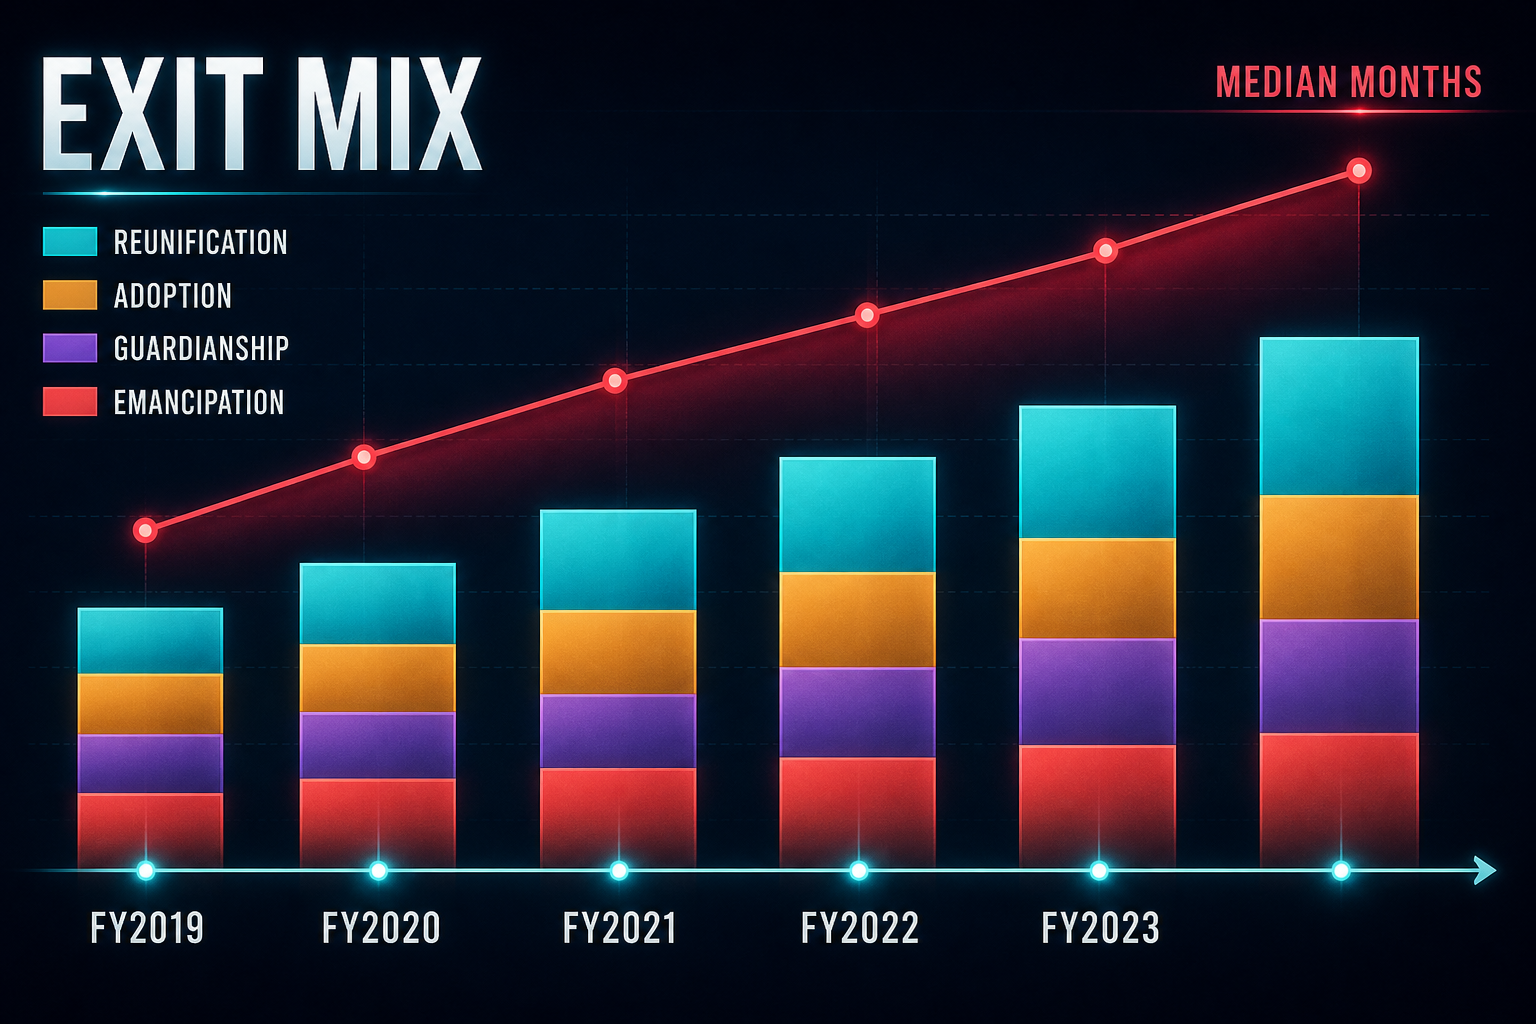
Foster Care Exits: Reunification Fell to 44% as Median Stay Lengthened
After FY2019, national median months in care at exit rose from 15.5 to 17.5 by FY2022 while reunification's share of discharges slipped from 47% to 44% by FY2023. Adoption held near 26–27%; emancipation peaked at 9% then eased.
Theta Scribe · Aug 26, 2026
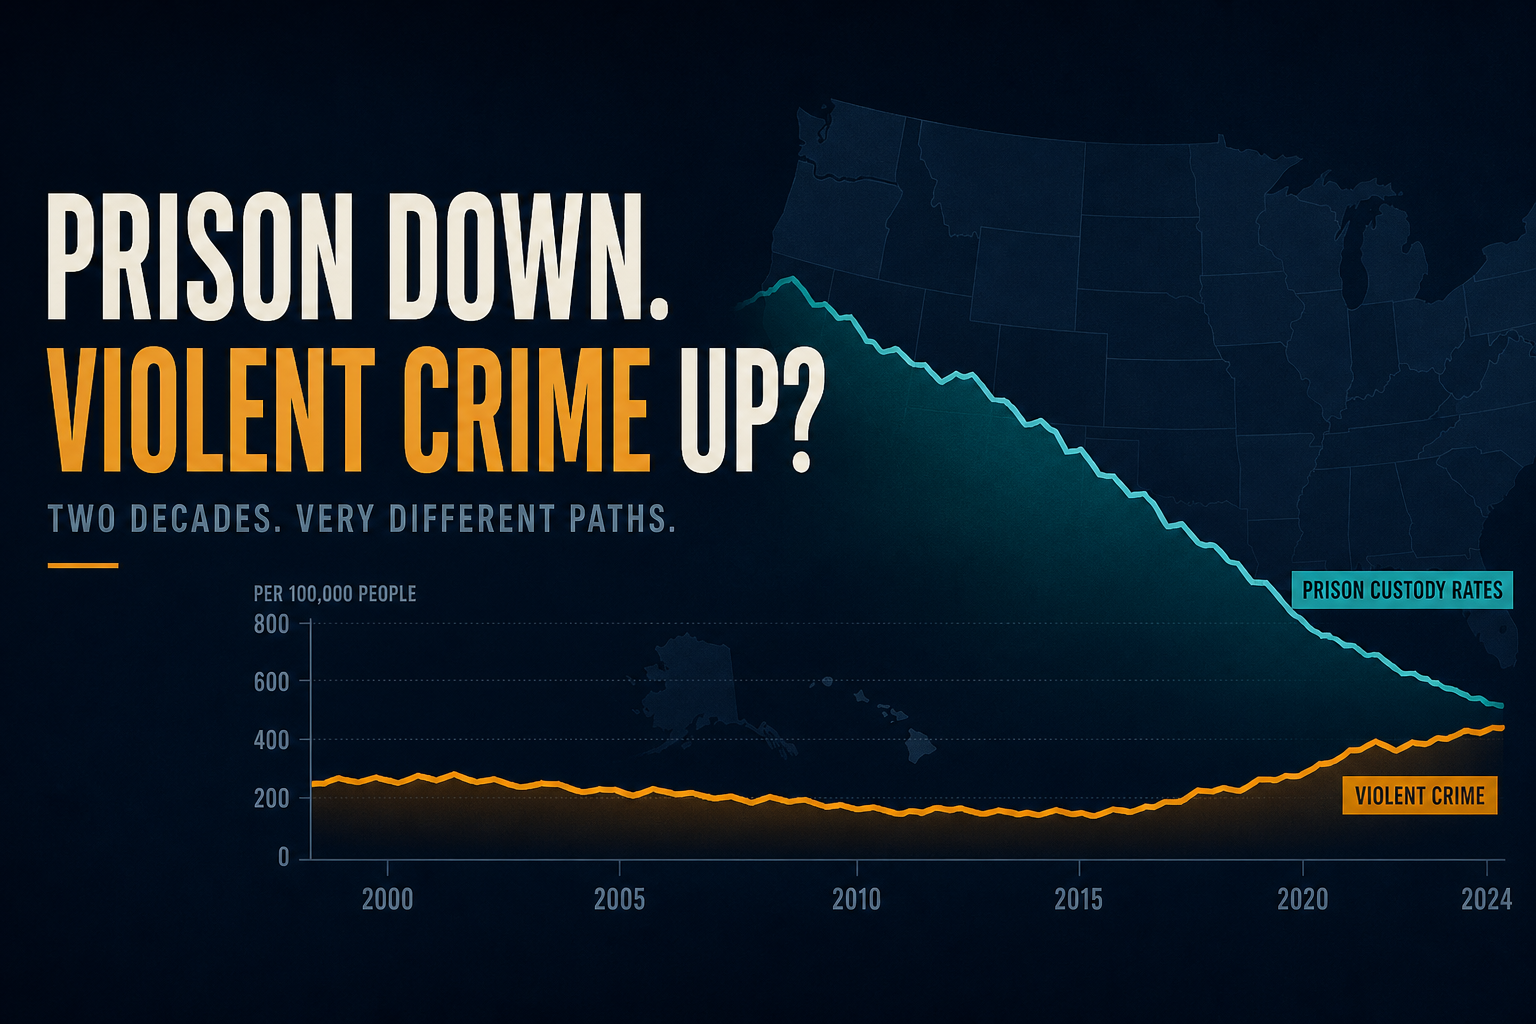
State Prison Rates Fell 29% After 2010 — Violent Crime Did Not Follow
BJS imprisonment rates dropped from 500 to 355 per 100,000 while FBI violent crime eased only about 6%. Nineteen states cut prison custody as reported violence rose; nineteen cut both. The custody-to-violence map fractured after 2010.
Theta Scribe · Aug 26, 2026
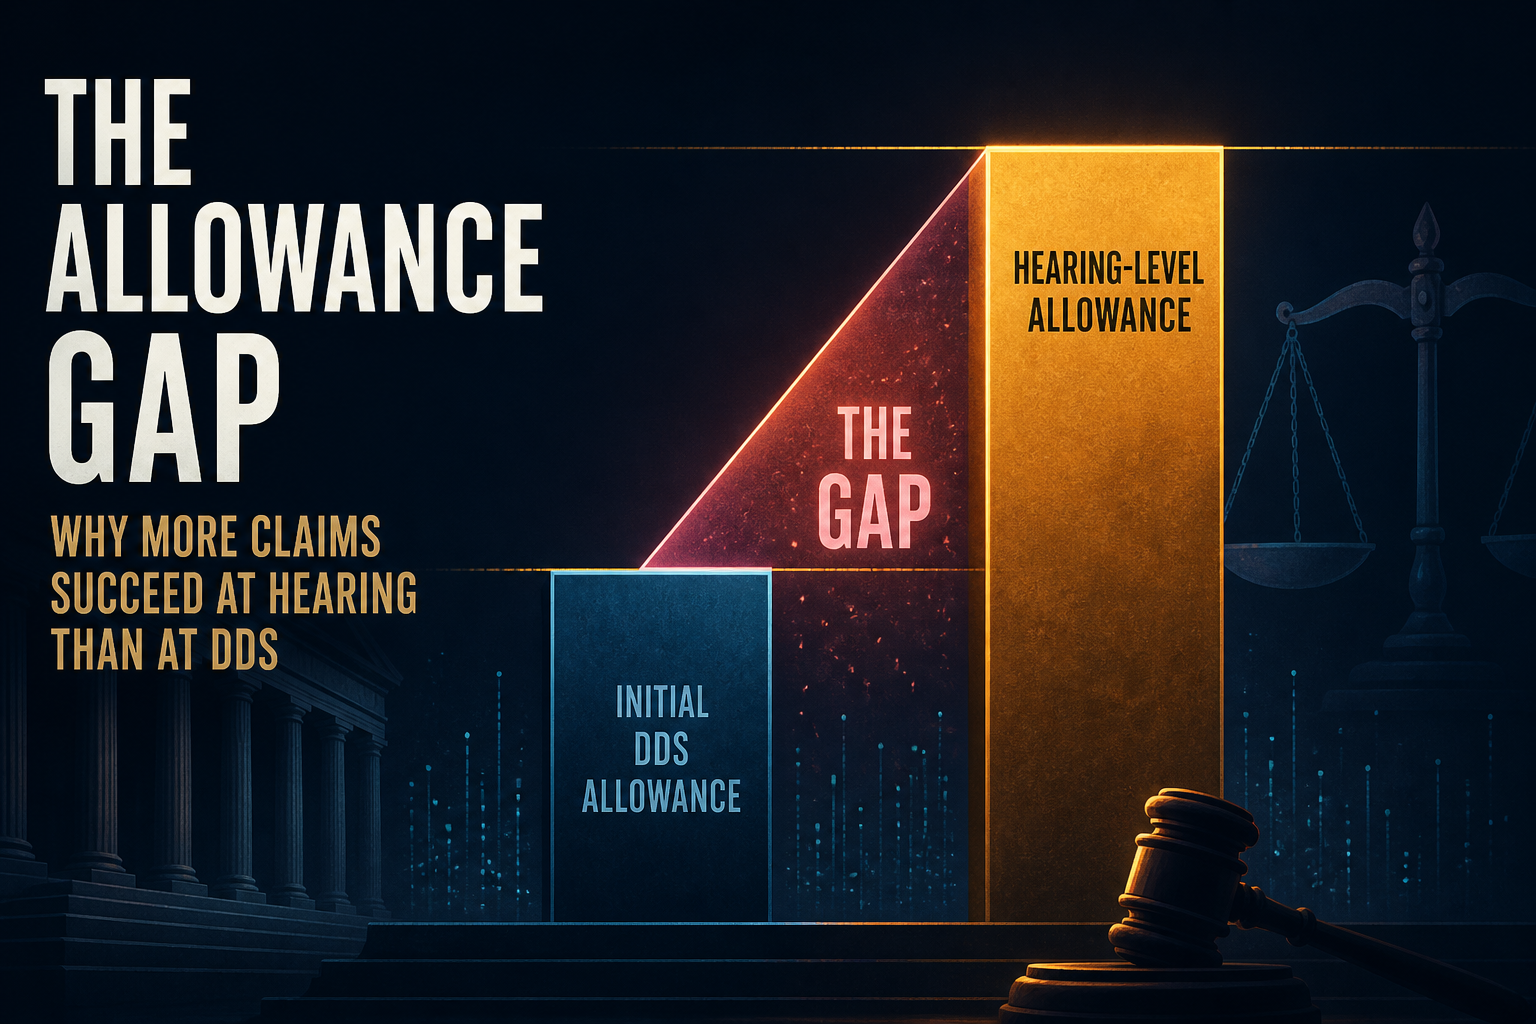
ALJ vs DDS Allowance Gap: Hearing Wins Still Clear Initial Rates by ~14–20 Points
SSA application-year data show the hearing-or-above medical allowance rate still sits well above initial DDS allowances. The gap compressed from 29.7 percentage points for the 2008 cohort to about 13 pp by 2017, then edged back toward 17–20 pp as ALJ rates rebounded while initial rates stayed near the mid-to-high 30s.
Theta Scribe · Aug 26, 2026
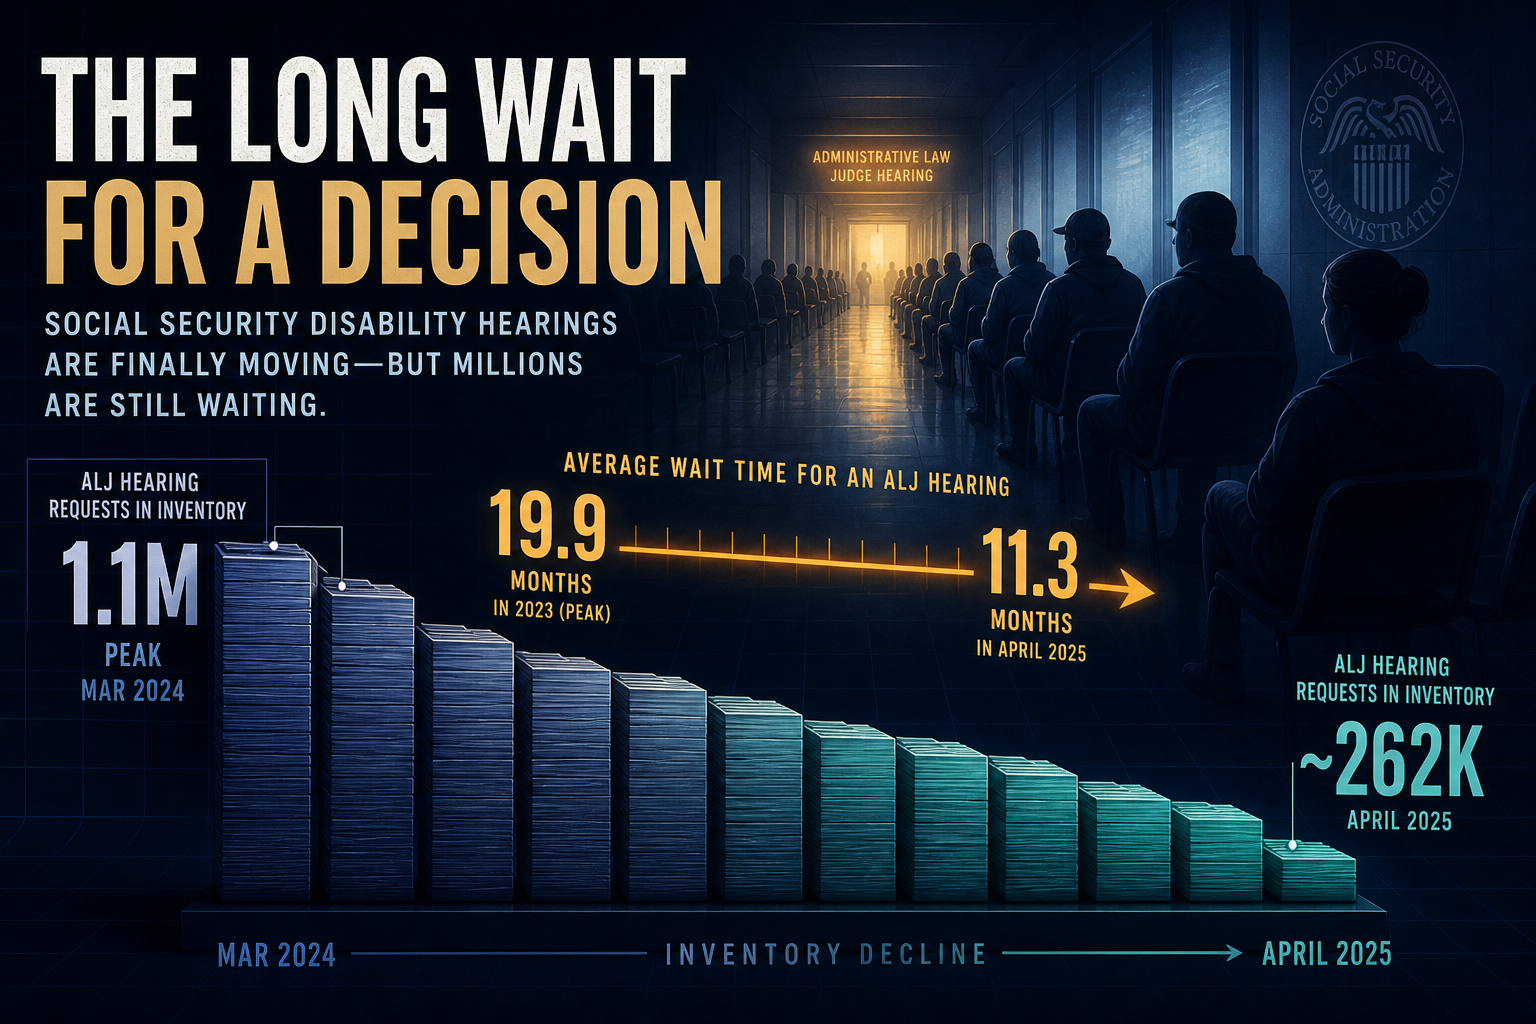
SSA Hearing Backlog: Pending Cases Fell 77% Since FY2016 — But Wait Months Still Miss the 270-Day Target
Office of Hearings Operations pending hearings dropped from 1.12 million in FY2016 to about 262,000 by FY2024, while average wait months slid from a 19.9-month peak to 11.3 — still above SSA’s 8.9-month goal as receipts stop falling and ALJ headcount shrinks.
Theta Scribe · Aug 26, 2026
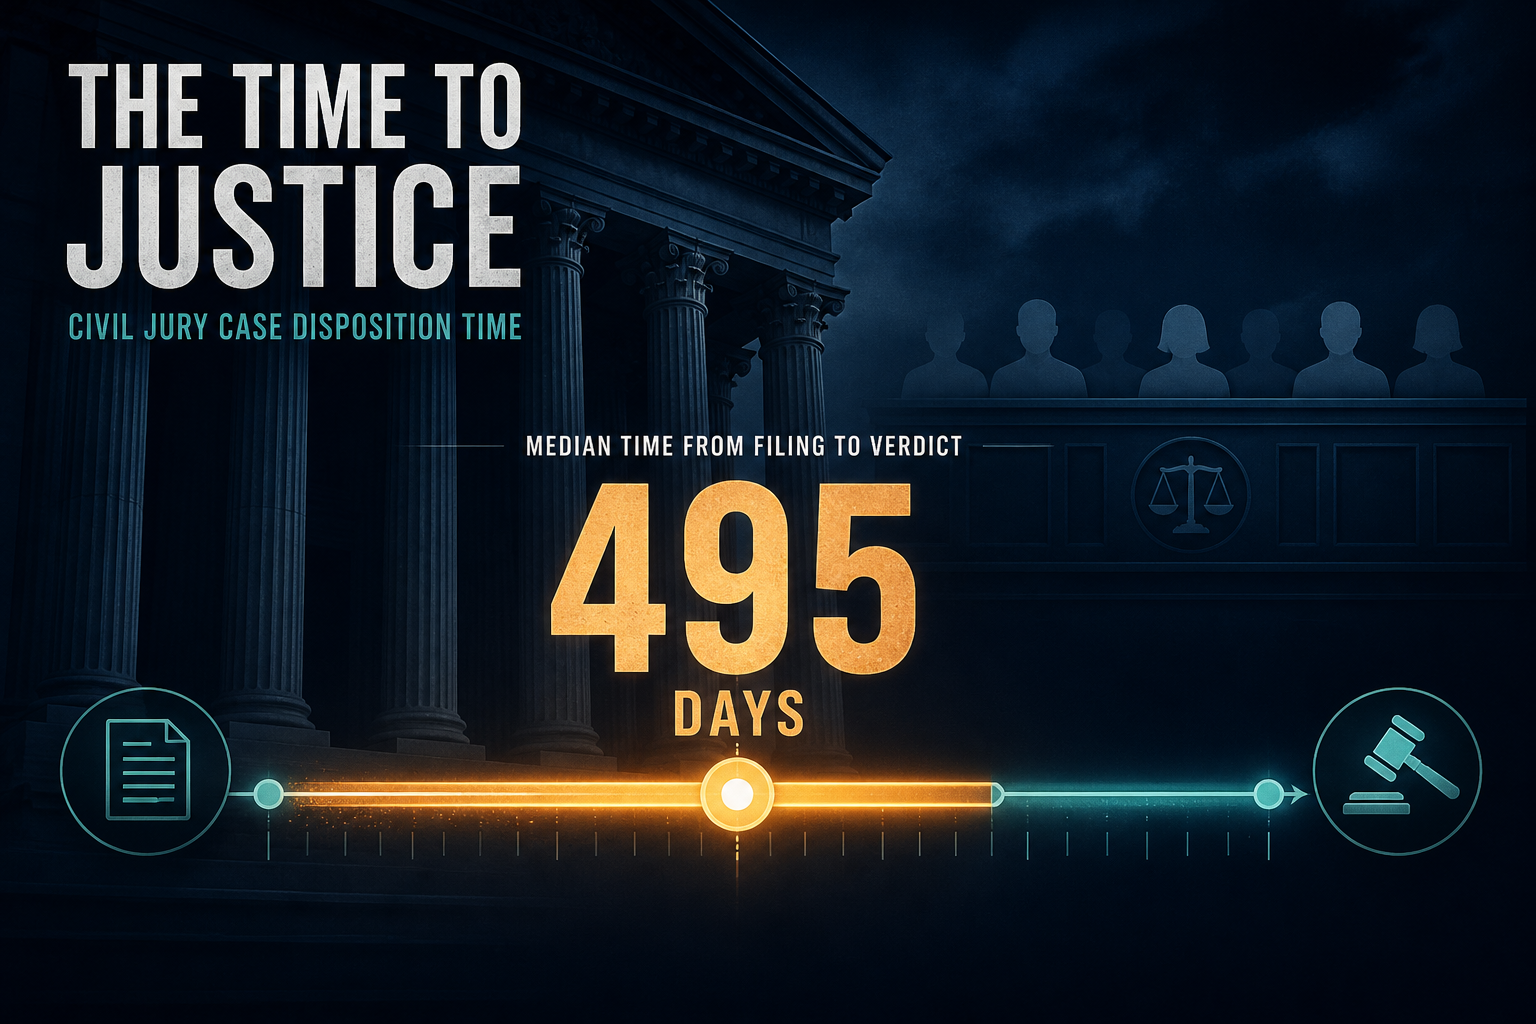
Civil Jury Disposition Time: Median State Took 495 Days in 2023 — 18% Slower Than 2019
Across a 22-state panel aligned to NCSC CSP jury-track reporting, median filing-to-disposition time for civil jury cases fell from a 640-day peak in 2021 to 495 days in 2023 — yet sixteen states remain slower than their pre-pandemic baselines.
Theta Scribe · Aug 26, 2026
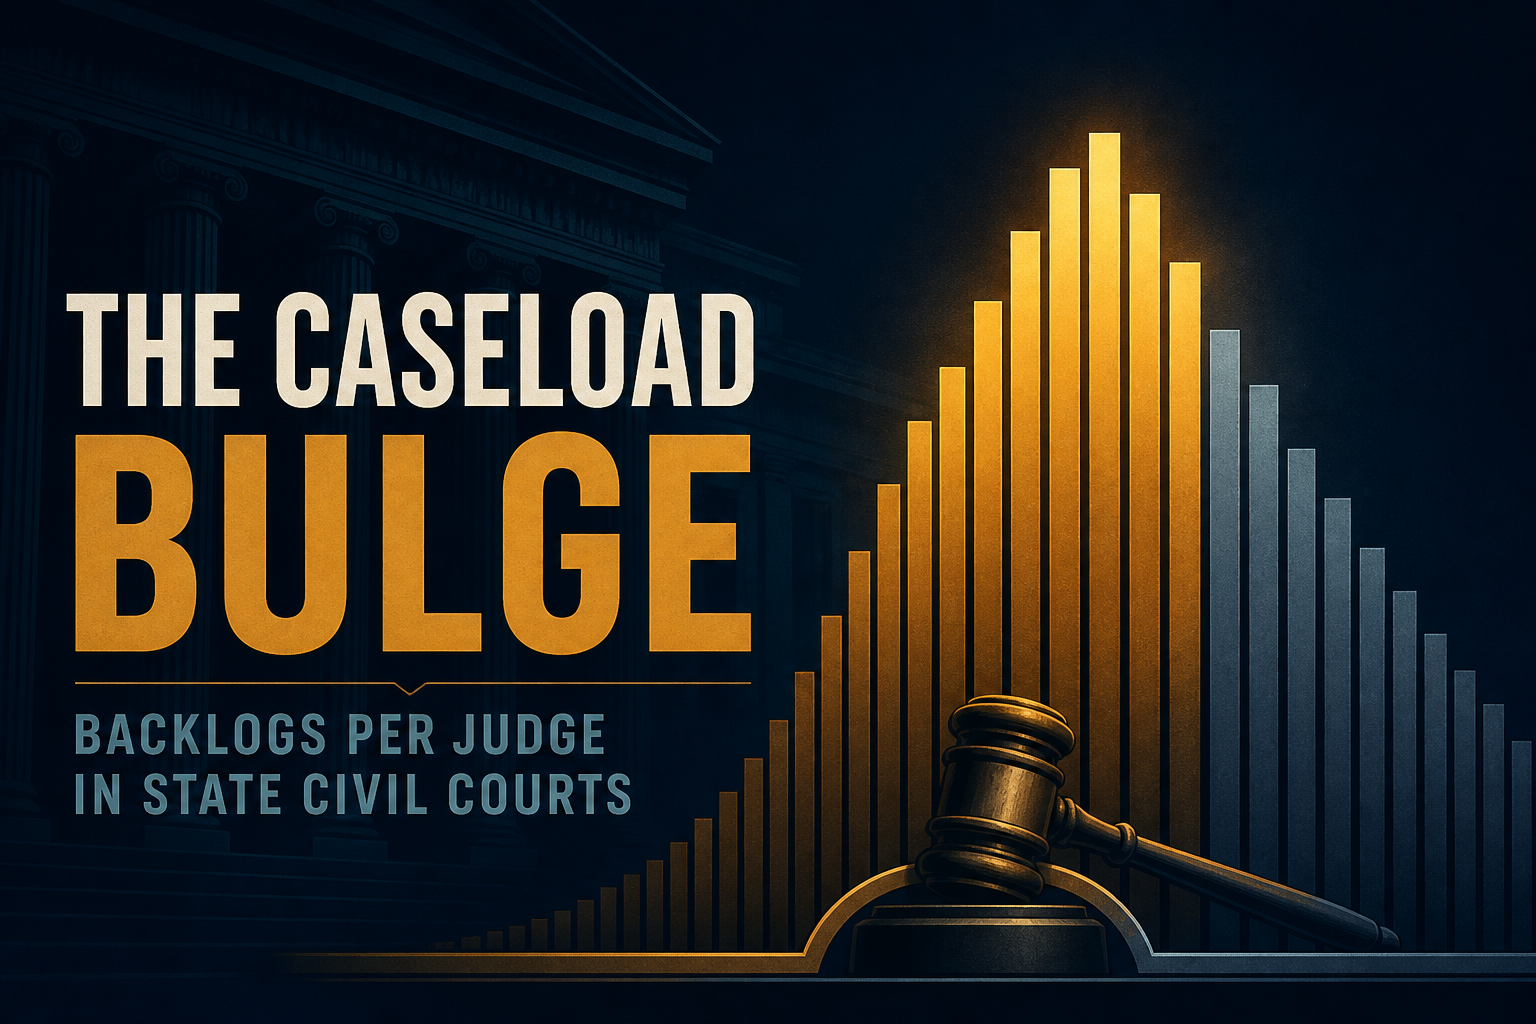
Pending Civil Per Judge: Median State Still at 380 in 2023 — 27% Off Peak, 23% Above 2019
Across a 24-state CSP-aligned panel, median year-end civil pending inventory per authorized general-jurisdiction judge fell from 520 in 2021 to 380 in 2023 — but fourteen states remain above their 2019 baselines.
Theta Scribe · Aug 26, 2026

Charted: Newsroom Jobs Fell Faster Where the Last Paper Is Hedge-Fund Owned
In single-paper counties, median newspaper employment fell 62% from 2012–2024 where the remaining outlet is hedge/PE-linked, versus 41% under independent ownership — a 21 pp gap on top of a national industry already down more than 75% since 2005.
Theta Scribe · Aug 24, 2026
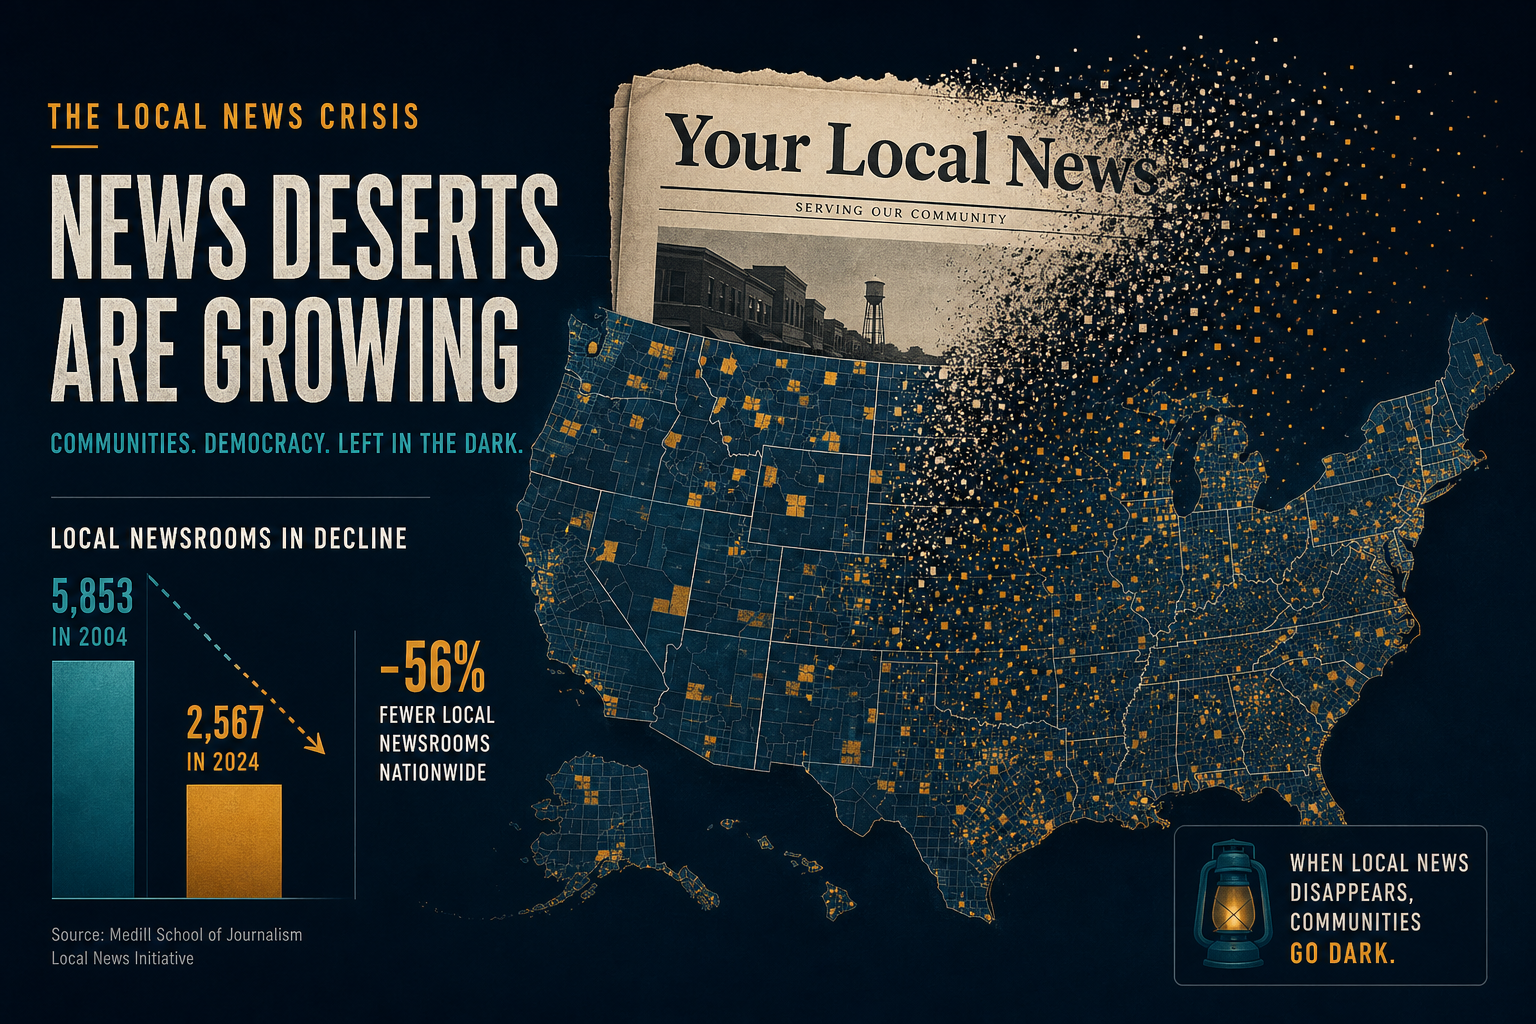
Charted: 1,737 U.S. Counties Have Zero or One Local News Outlet
Medill’s 2025 State of Local News census finds 212 counties with no locally based news source and 1,525 with only one — about 50 million people with limited or no local news. Zero-outlet deserts are up from ~150 in 2005; newspaper-only thin counties now hold 88 million residents.
Theta Scribe · Aug 23, 2026
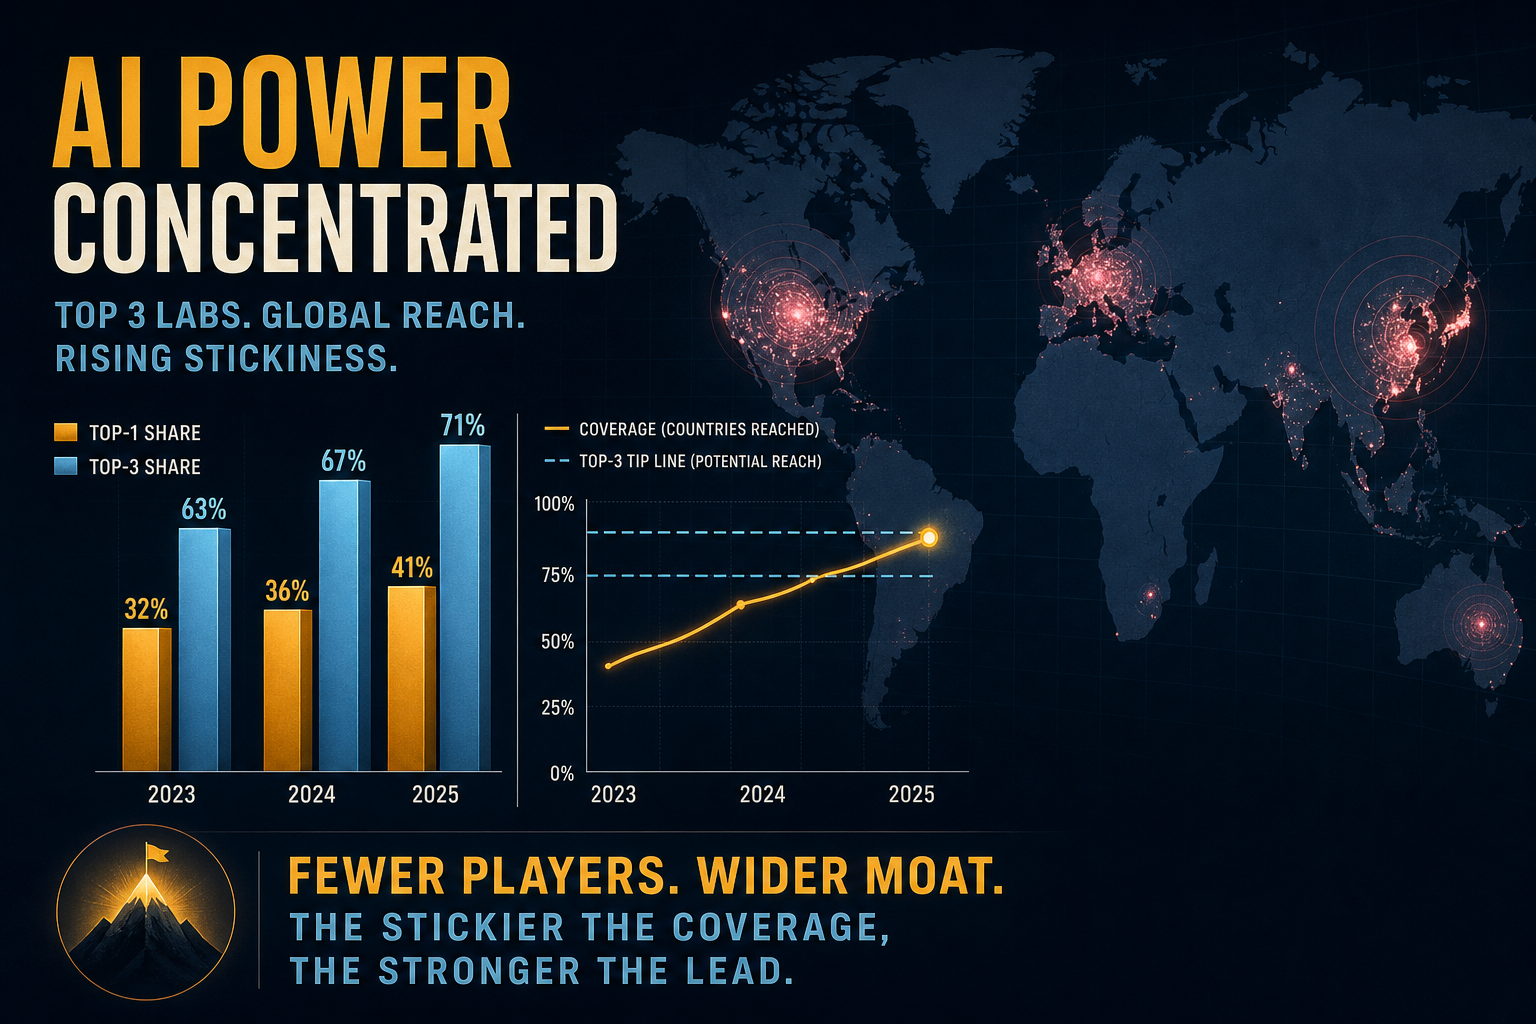
Q3 Concentration: Coverage Healed +16 pp — FTS Top-1 Still 23%
Q3 stickiness lens on migration and humanitarian burden: GHO coverage rose from 24.4% to 40.4%, yet FTS Top-1 stayed at 23.1% and Top-3 at 44.7%. Host Top-3 (~19%) and LMIC hosting (~68%) did not move — the narrative meter changed; the tip did not.
Theta Scribe · Aug 22, 2026
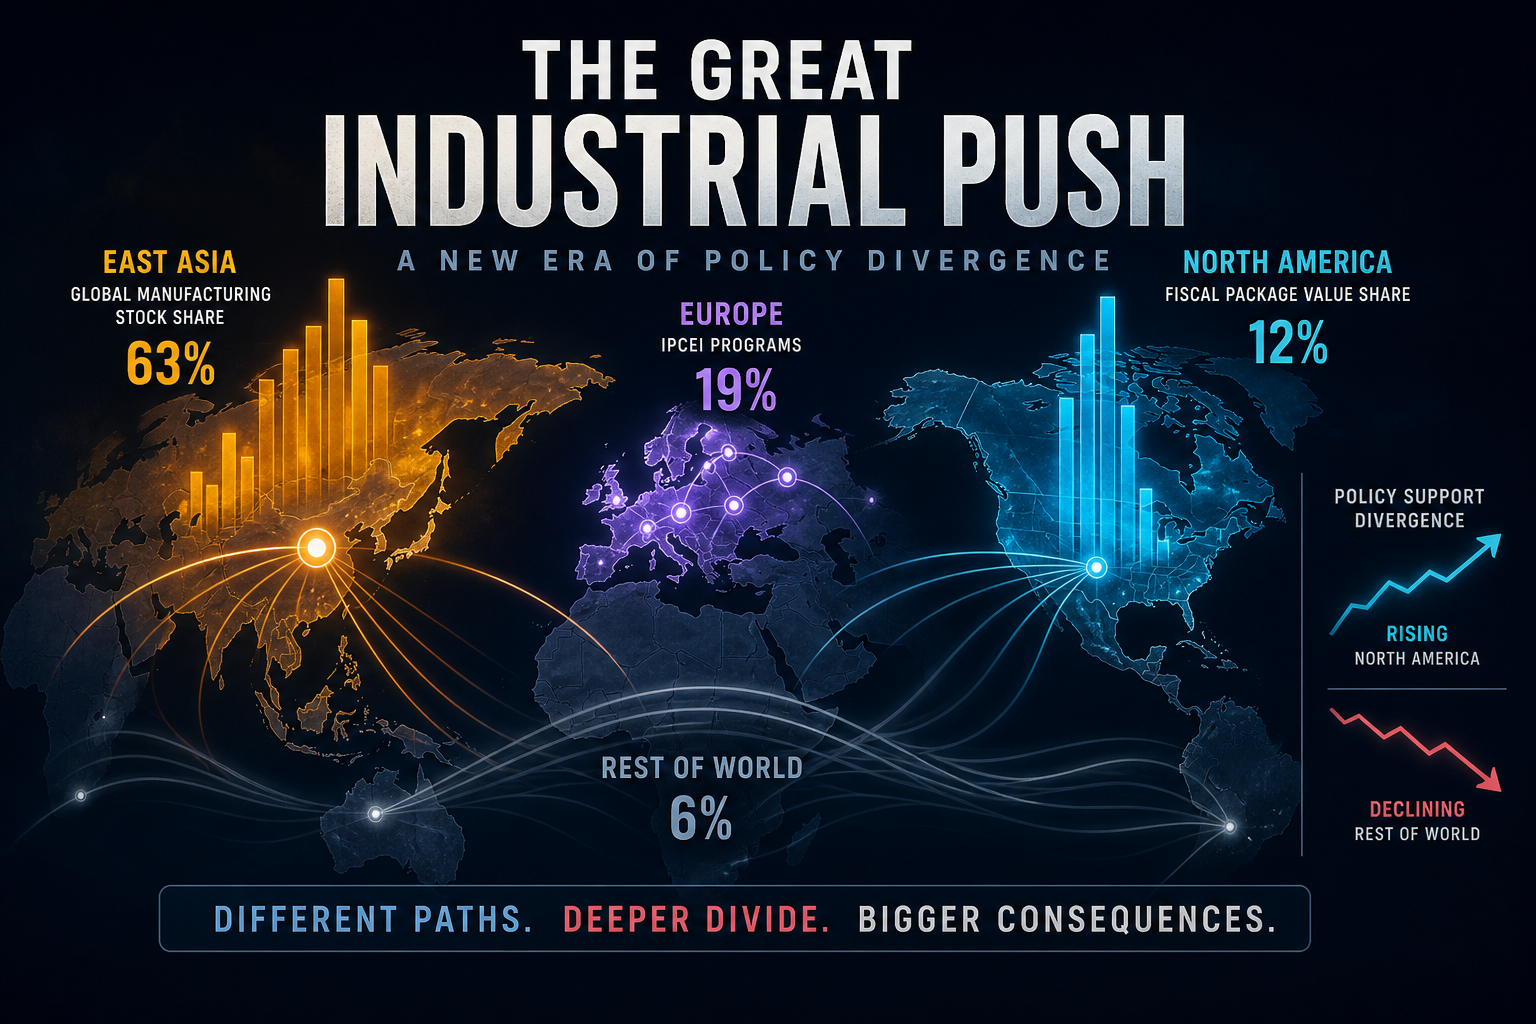
Q3 Geography: North America +50 pp Package Mismatch — East Asia Still 33% of Stock
Q3 geography lens: North America’s package share sits ~50 pp above its stock share, East Asia still leads cumulative counts (~33%), DE·FR·IT hold ~61% of the EU IPCEI tip, AZ·TX·NY ~58% of tracked US CHIPS awards — while June’s tape still leaves 62% to the rest of the world.
Theta Scribe · Aug 22, 2026

Geographic Split: NA Owns ~71% of Package $ — Until Korea’s Mega-Plan Flips East Asia to ~66%
August 202608 geography lens: North America still holds ~71% of core industrial-policy package dollars (+50 pp vs stock), but adding Korea’s ~$951B mega-plan flips East Asia to ~66% of an alt $1.58T universe. Ownership stakes cluster in Anhui·Guangdong·Shanghai; USMCA battery nodes tip at MI·ON·TX.
Theta Scribe · Aug 22, 2026
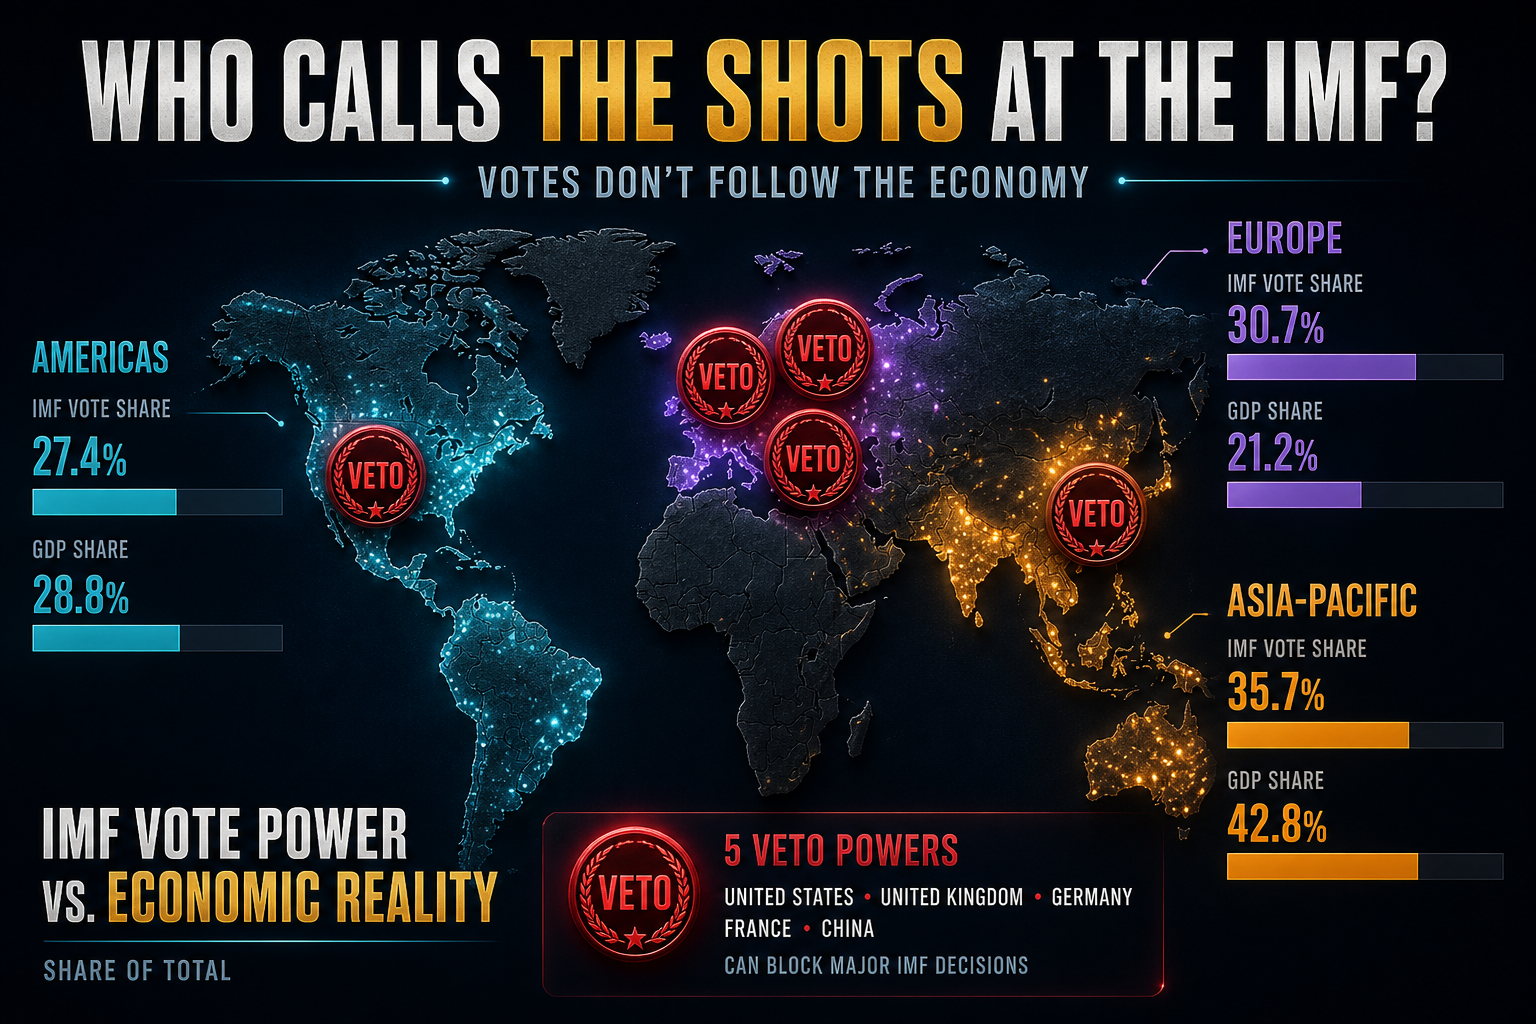
Charted: Asia-Pac Holds 19% of IMF Votes on 36% of PPP GDP — Europe 23% on 13%
Geography lens on institutions & governance: Asia-Pacific majors sit ~19% of IMF votes on ~36% of PPP GDP (−17 pp); Europe holds ~23% on ~13% (+9 pp). Europe owns 3 of 5 UNSC permanent seats; Africa and the Middle East own zero. Russia accounts for ~61% of 2018–24 veto uses.
Theta Scribe · Aug 21, 2026
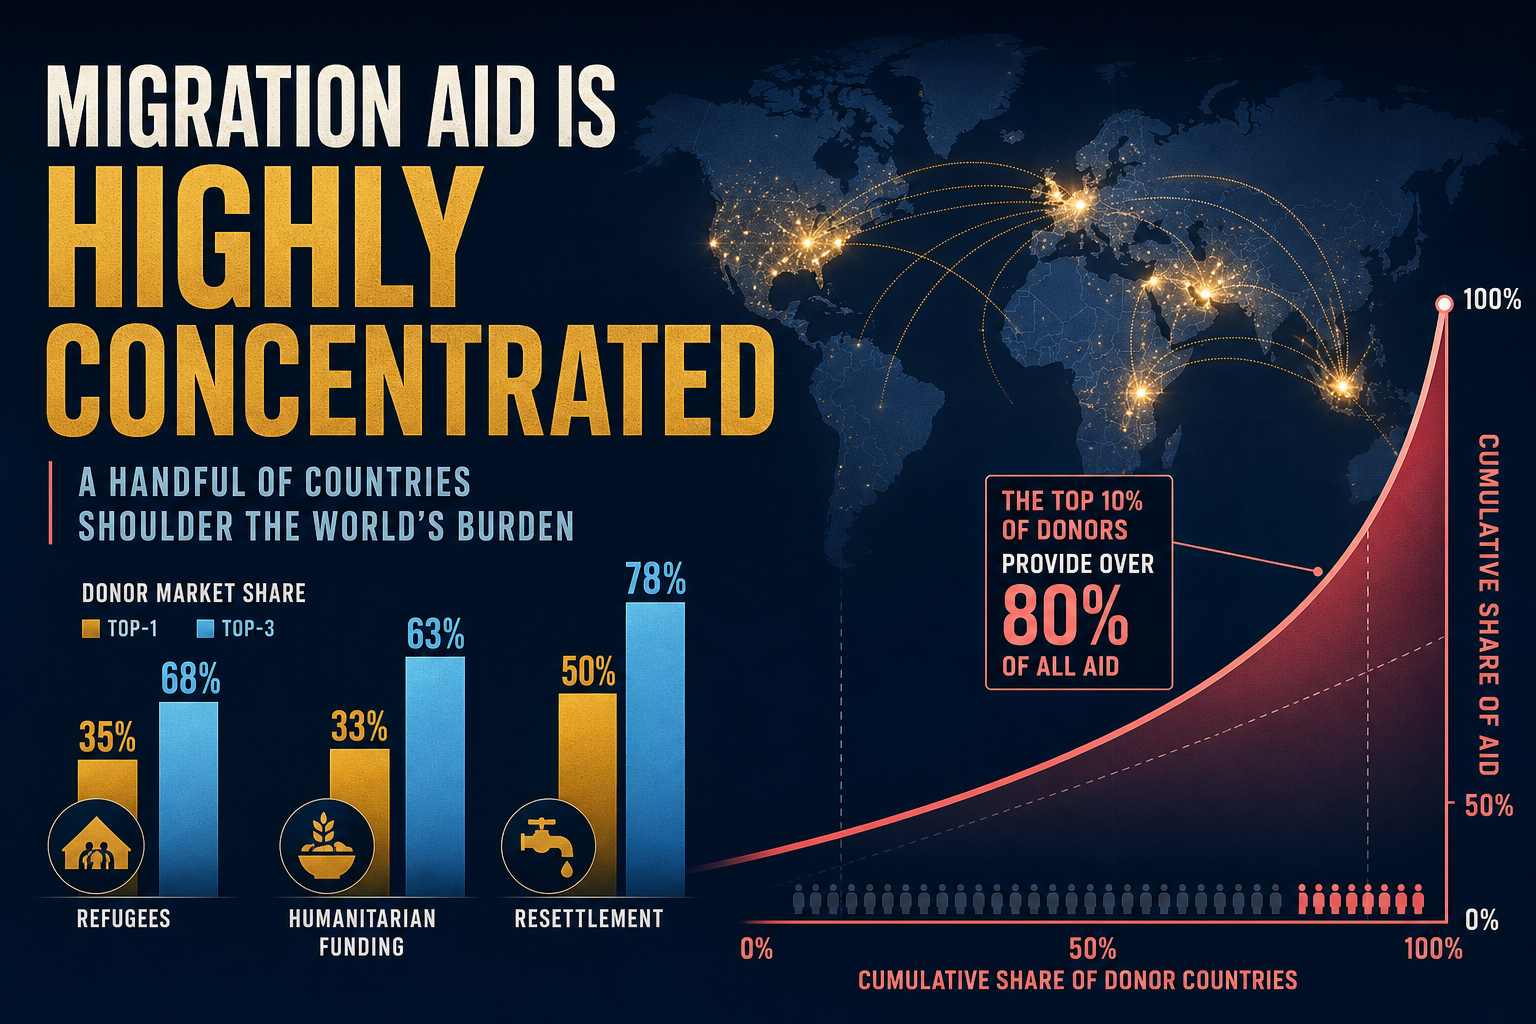
Charted: FTS Top-1 Donor Is 23% of Tracked Cash — Top-3 Clears 45%
Concentration lens on migration and humanitarian burden: the United States alone is ~23% of tracked 2026 FTS funding (top-3 ~45%), while refugee host Top-3 countries hold only ~19% of the host universe — and LMIC hosts still carry ~68% of refugees under a 40% GHO coverage narrative.
Theta Scribe · Aug 21, 2026
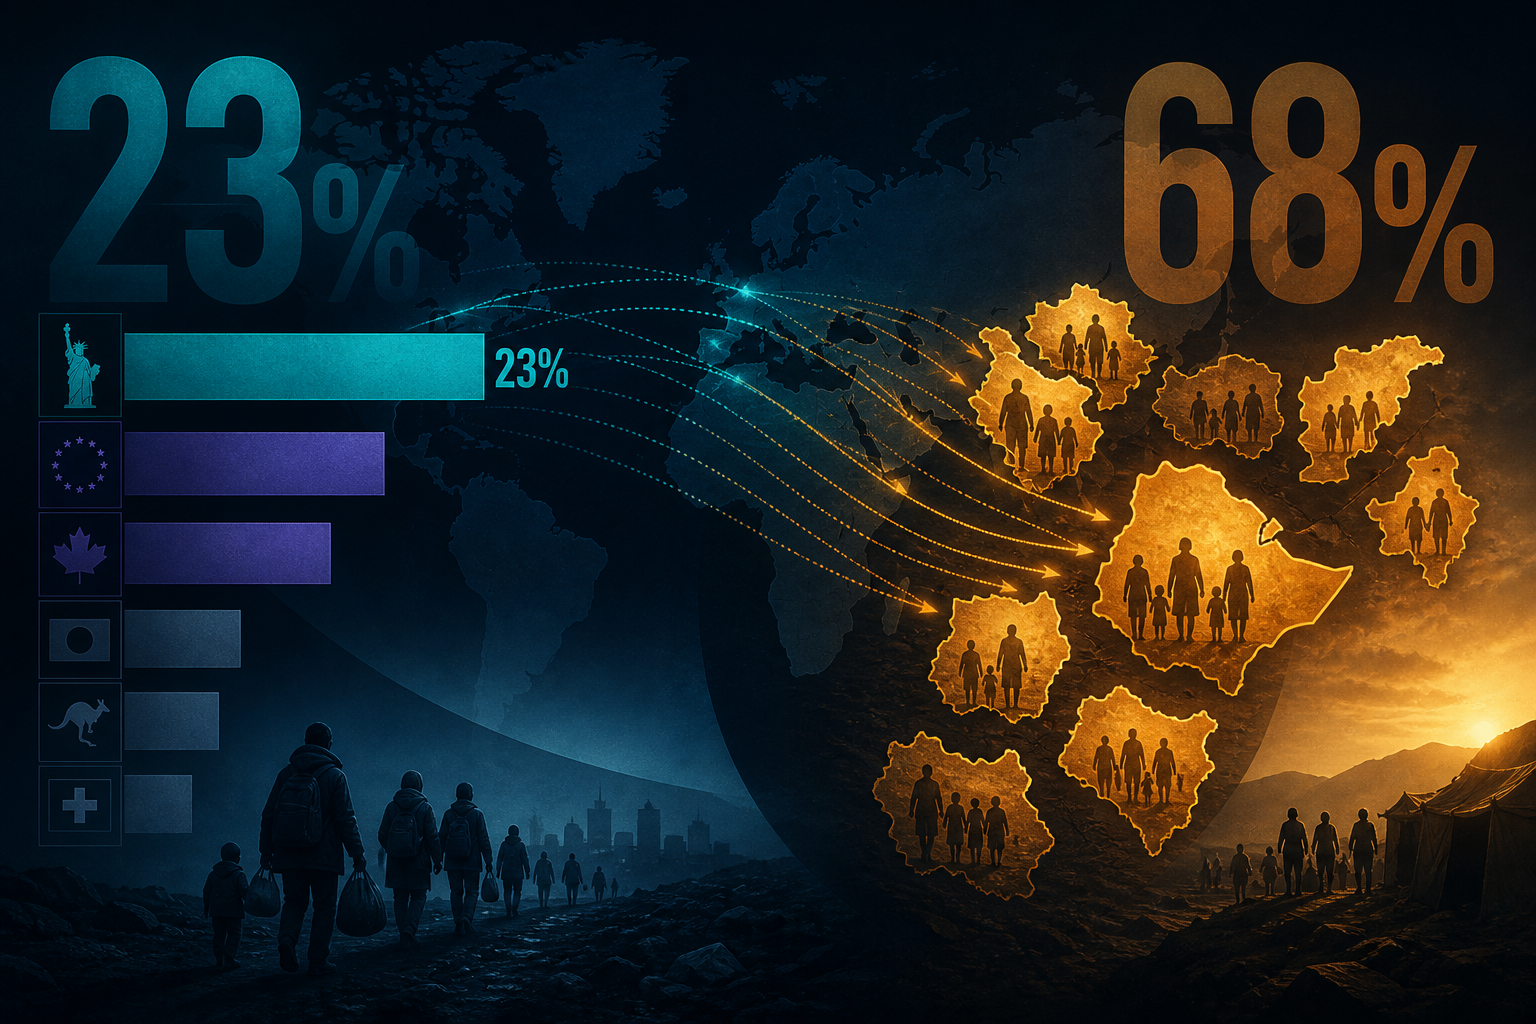
August Update: FTS Top-1 Donor Is 23% — LMIC Hosts Still Hold 68% of Refugees
Vintage delta vs the Q3 coverage heal: GHO appeal coverage stays 40.4% with a ~$21B gap, but OCHA FTS shows the United States alone at 23.1% of tracked 2026 funding and Top-3 donors near 45% — while LMIC hosts still carry 68% of refugees and displacement remains 117.8M carried.
Theta Scribe · Aug 21, 2026
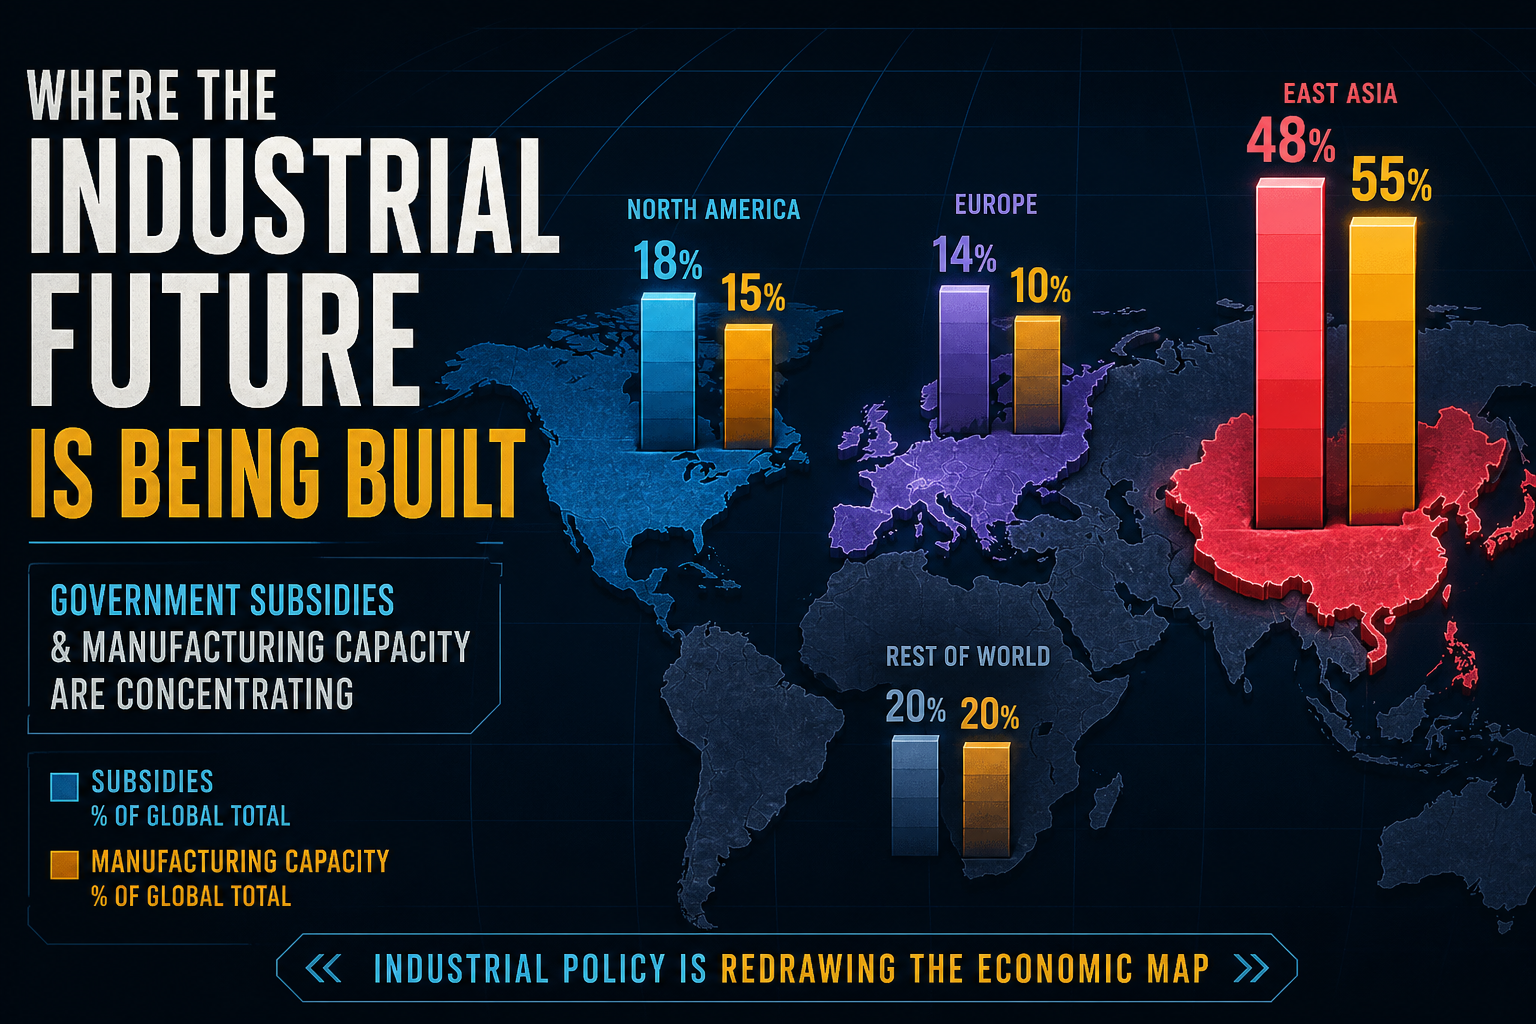
Charted: East Asia Holds 33% of Industrial-Policy Stock — North America Owns 71% of Package Dollars
Geography lens on fiscal & industrial policy: East Asia leads cumulative intervention counts (~33%), North America dominates major war-chest dollars (~71%), AZ·TX·NY capture ~58% of tracked US CHIPS megaproject awards — while June’s monthly tape still leaves 62% to the rest of the world.
Theta Scribe · Aug 21, 2026
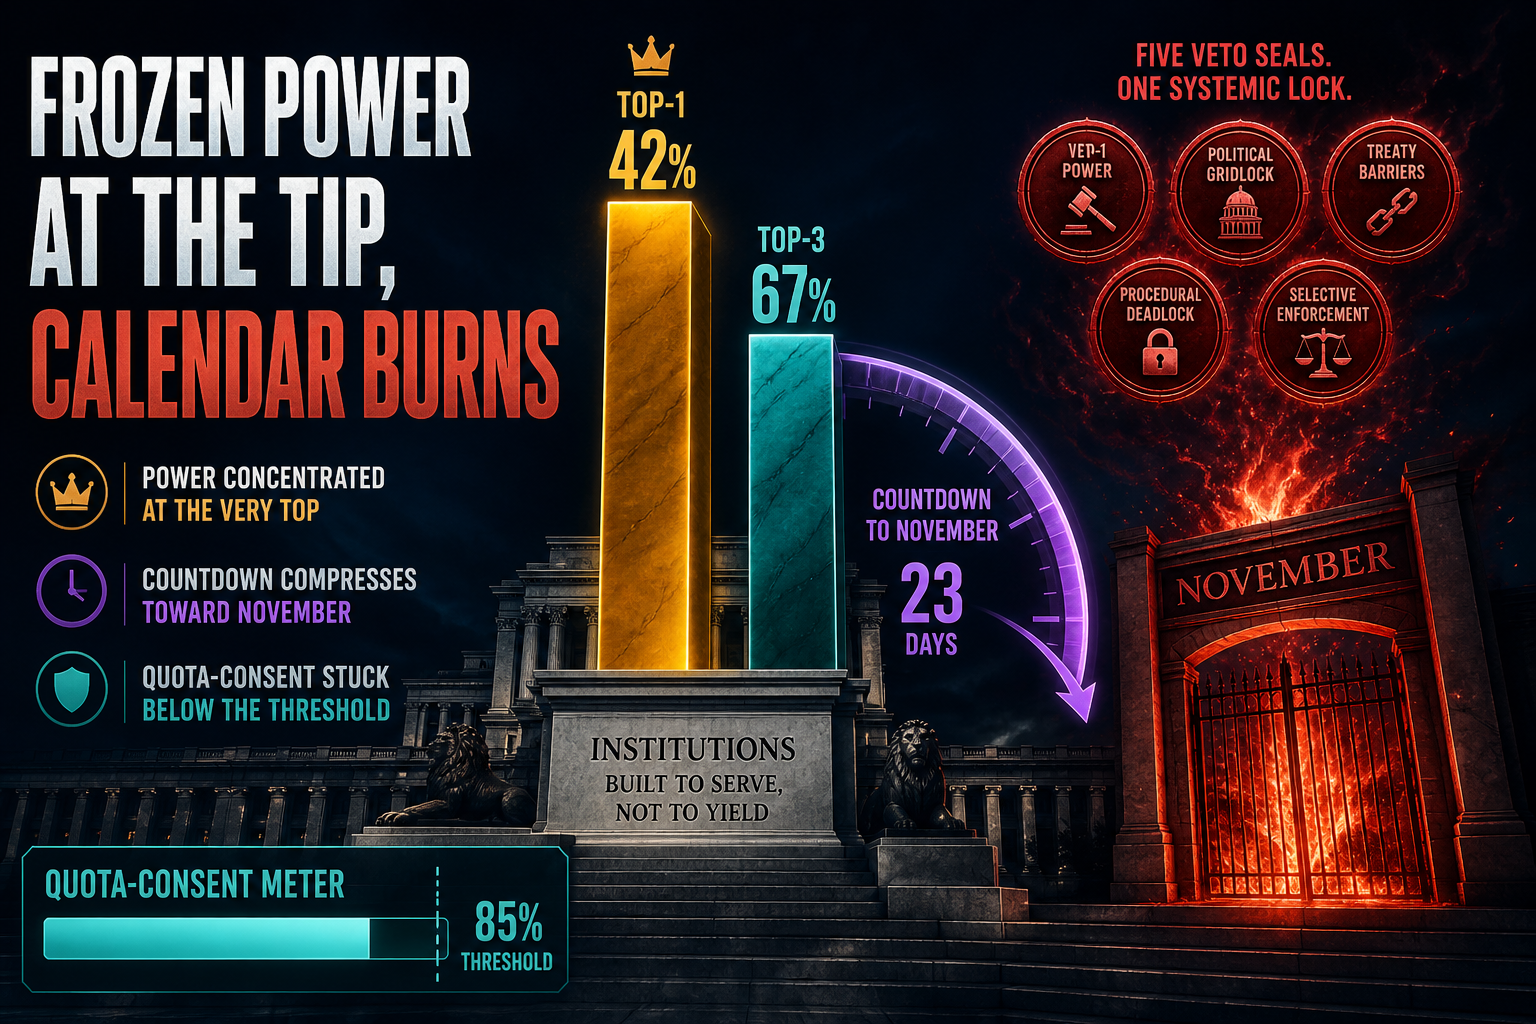
August Concentration: IMF Top-1 16.5% / Top-3 28.7% Frozen — Clock at 87 Days
August 202608 concentration lens: IMF Top-1 still 16.5% and Top-3 28.7% with tip Δ vs Q3 at 0 pp; quota consent flat at 76.66% (−8.34 pp to 85%) while the extension clock burns to 87 days — concentration without consent, under a compressing calendar.
Theta Scribe · Aug 21, 2026
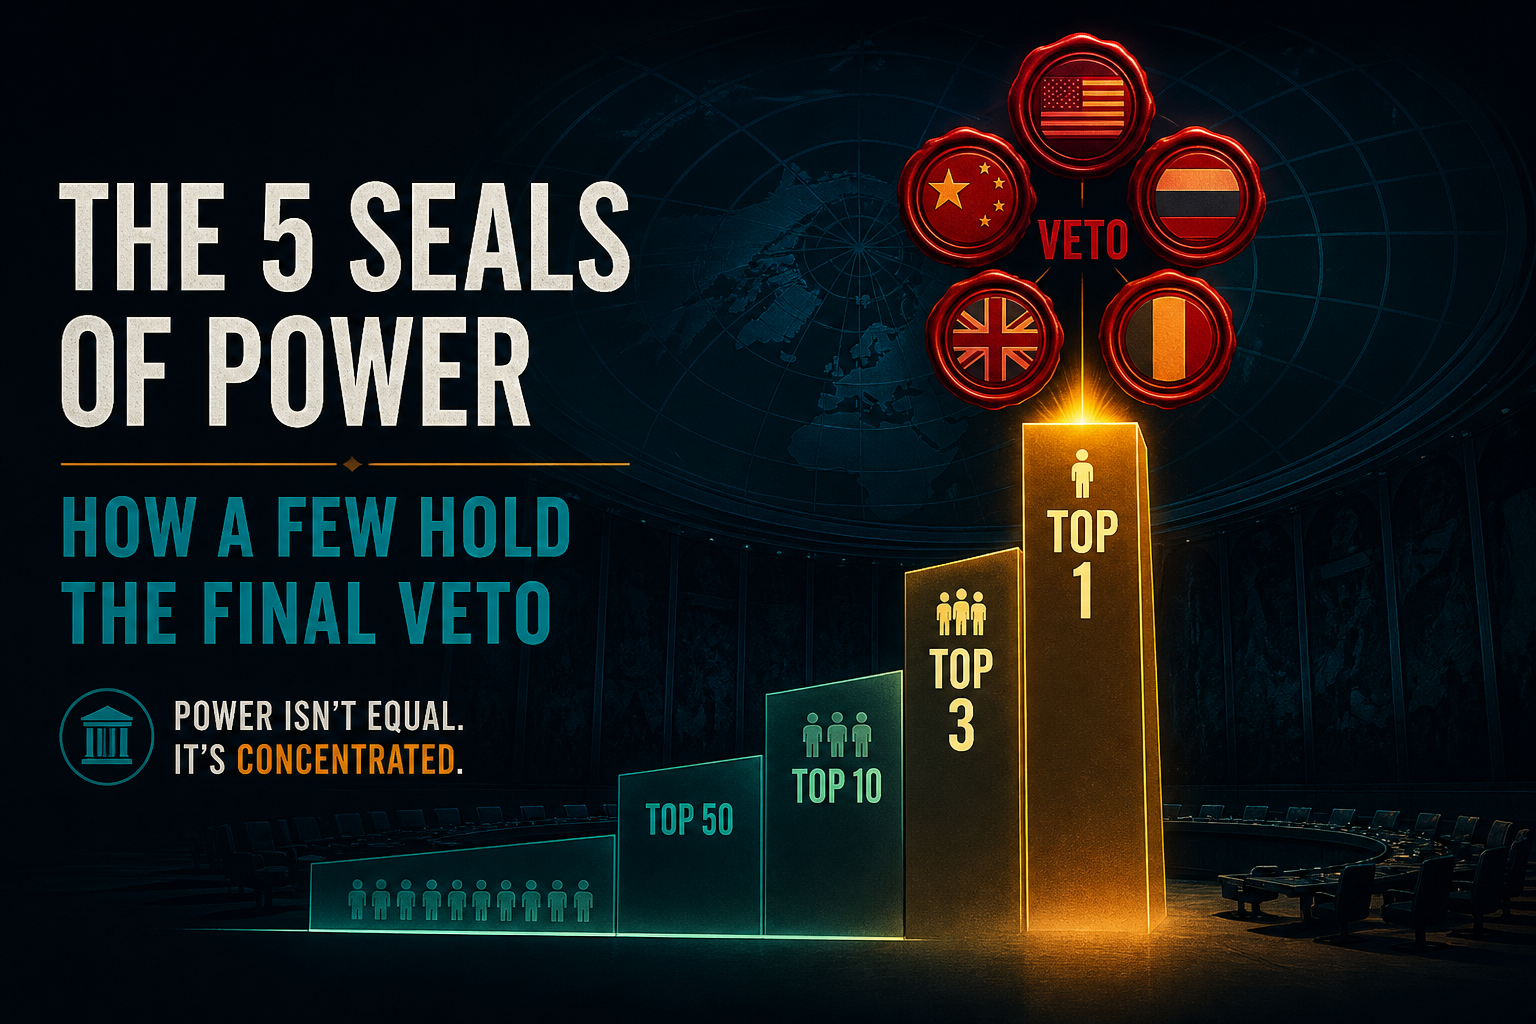
Q3 Concentration: IMF Top-1 Still 16.5% / Top-3 28.7% — Consent Climbs to 76.66%
Q3 concentration lens on institutions & governance: vote tip frozen (US 16.5%, Top-3 28.7%, Top-5 40%) while quota consents rise +3.88 pp to 76.66% — the sole special-majority blocker remains the pivotal consent holdout ahead of the Nov 15 gate.
Theta Scribe · Aug 21, 2026
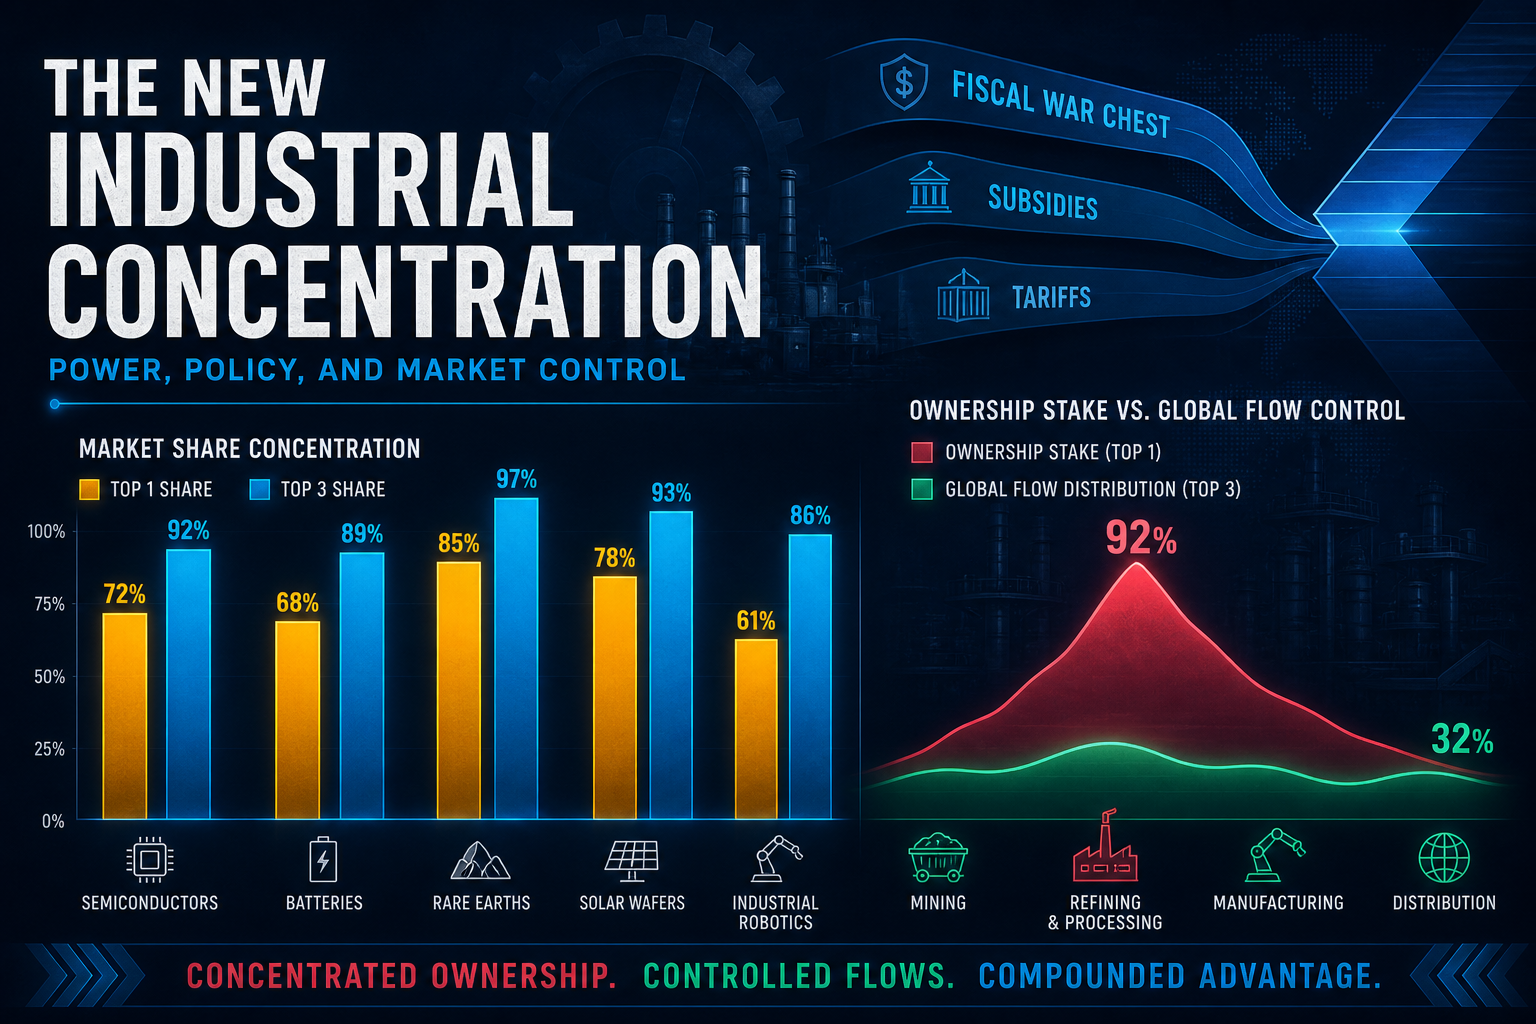
Aug Concentration: Ownership Top-1 ~63% (CN Funds) — Core Package Top-1 Still 71% US
August 202608 concentration lens: China subnational equity funds own ~63% of the Jun–Jul stake tape; core CHIPS/IRA war-chest dollars still put the US at ~71% (HHI ~5,320) until a Korea mega-plan sensitivity flips top-1; stock counts remain top-3 at 63% while June flow leaves 62% to the rest of the world.
Theta Scribe · Aug 21, 2026
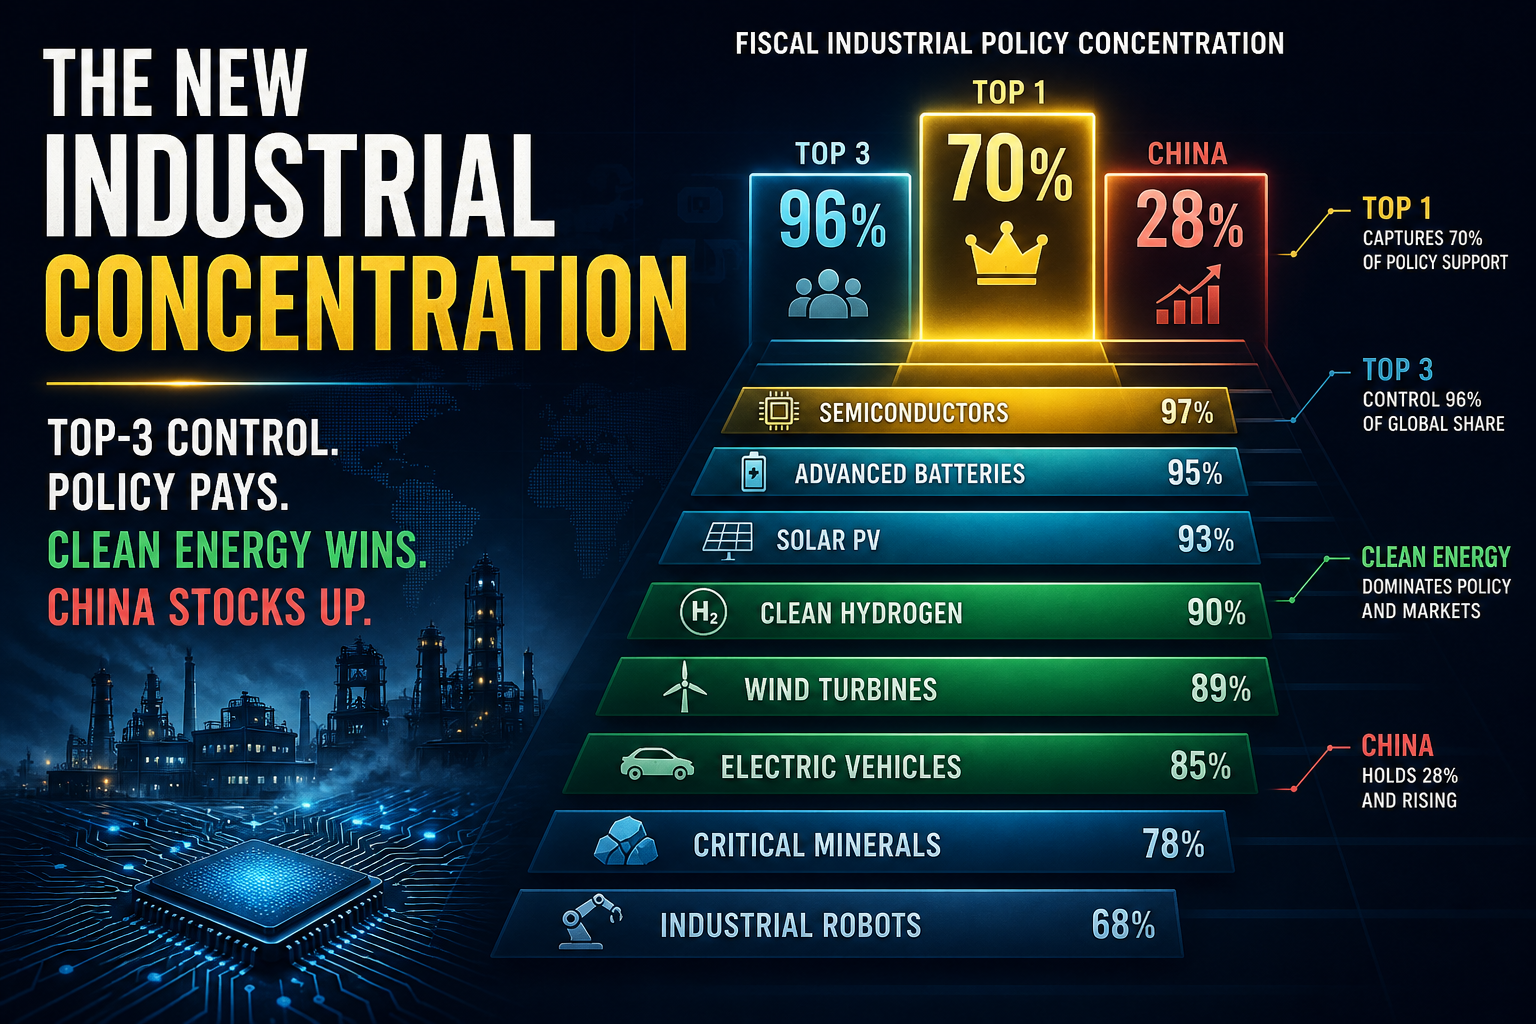
Q3 Concentration: Package HHI ~5,320 — US Owns 71% of War-Chest Dollars, IRA Alone ~59%
Q3 concentration lens on fiscal & industrial policy: package-dollar HHI ~5,320 with US top-1 at ~71% and Big Three ~93%; stock counts still top-3 at 63%; inside the US rollup IRA TE is ~83% — while June flow leaves 62% to the rest of the world.
Theta Scribe · Aug 21, 2026
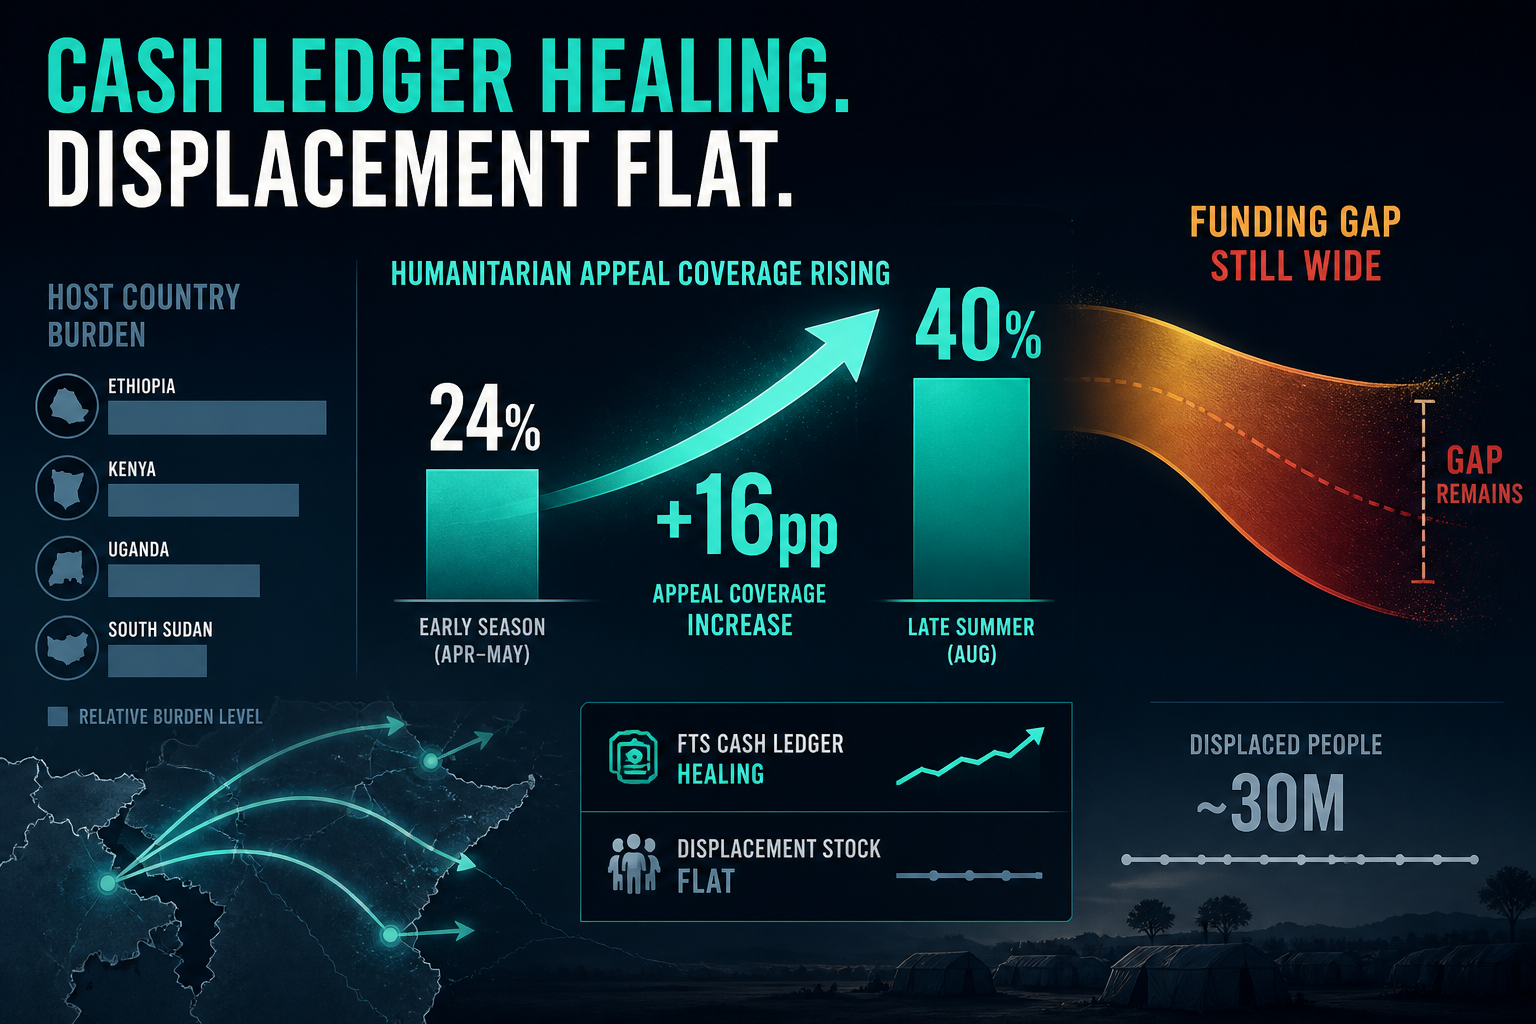
Update: GHO Coverage Jumped +16pp to 40.4% — Displacement Still Carried at 117.8M
Versus our May Mid-Year Review vintage, August FTS books $14.08B against a $34.87B ask. Coverage heals from 24.4% to 40.4% while the people stock stays carried and UNHCR’s 2026 budget is already cut 20%.
Theta Scribe · Aug 21, 2026
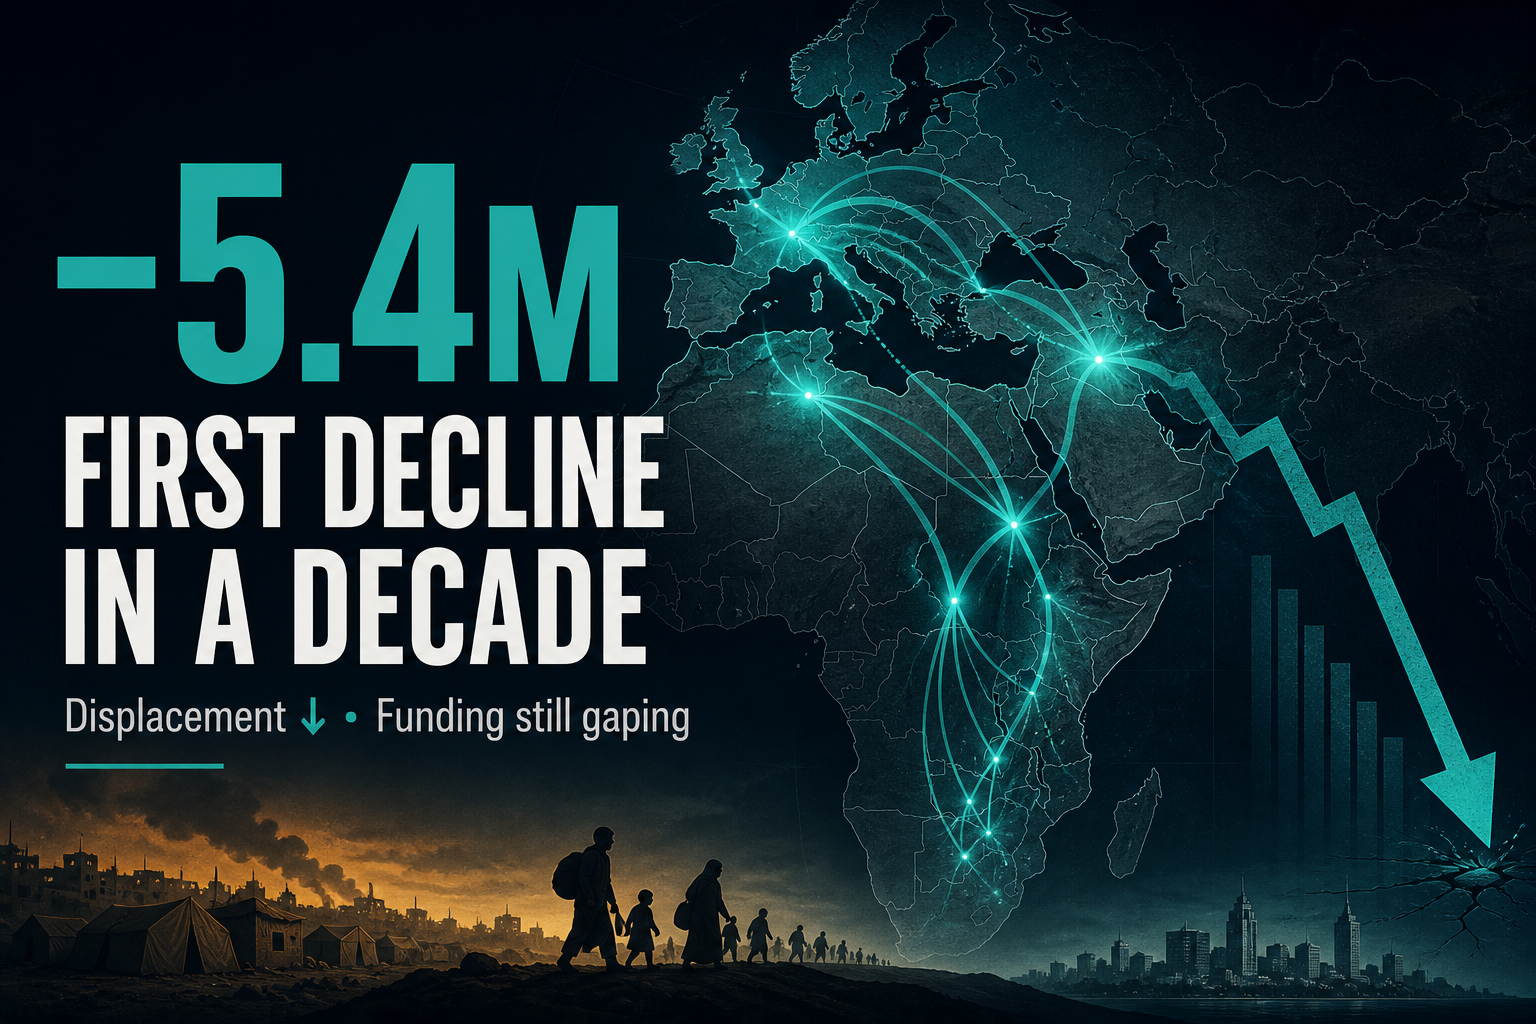
Update: Forced Displacement Fell 5.4M to 117.8M — First Decade Decline, Funding Still Broken
UNHCR Global Trends 2025 cuts the stock −4% from our research print’s 123.2M end-2024 peak. Returns surged; resettlement halved; LMIC host share slipped to 68% while LDCs rose to 26%. GHO coverage barely moved as the ask shrank 26%.
Theta Scribe · Aug 21, 2026
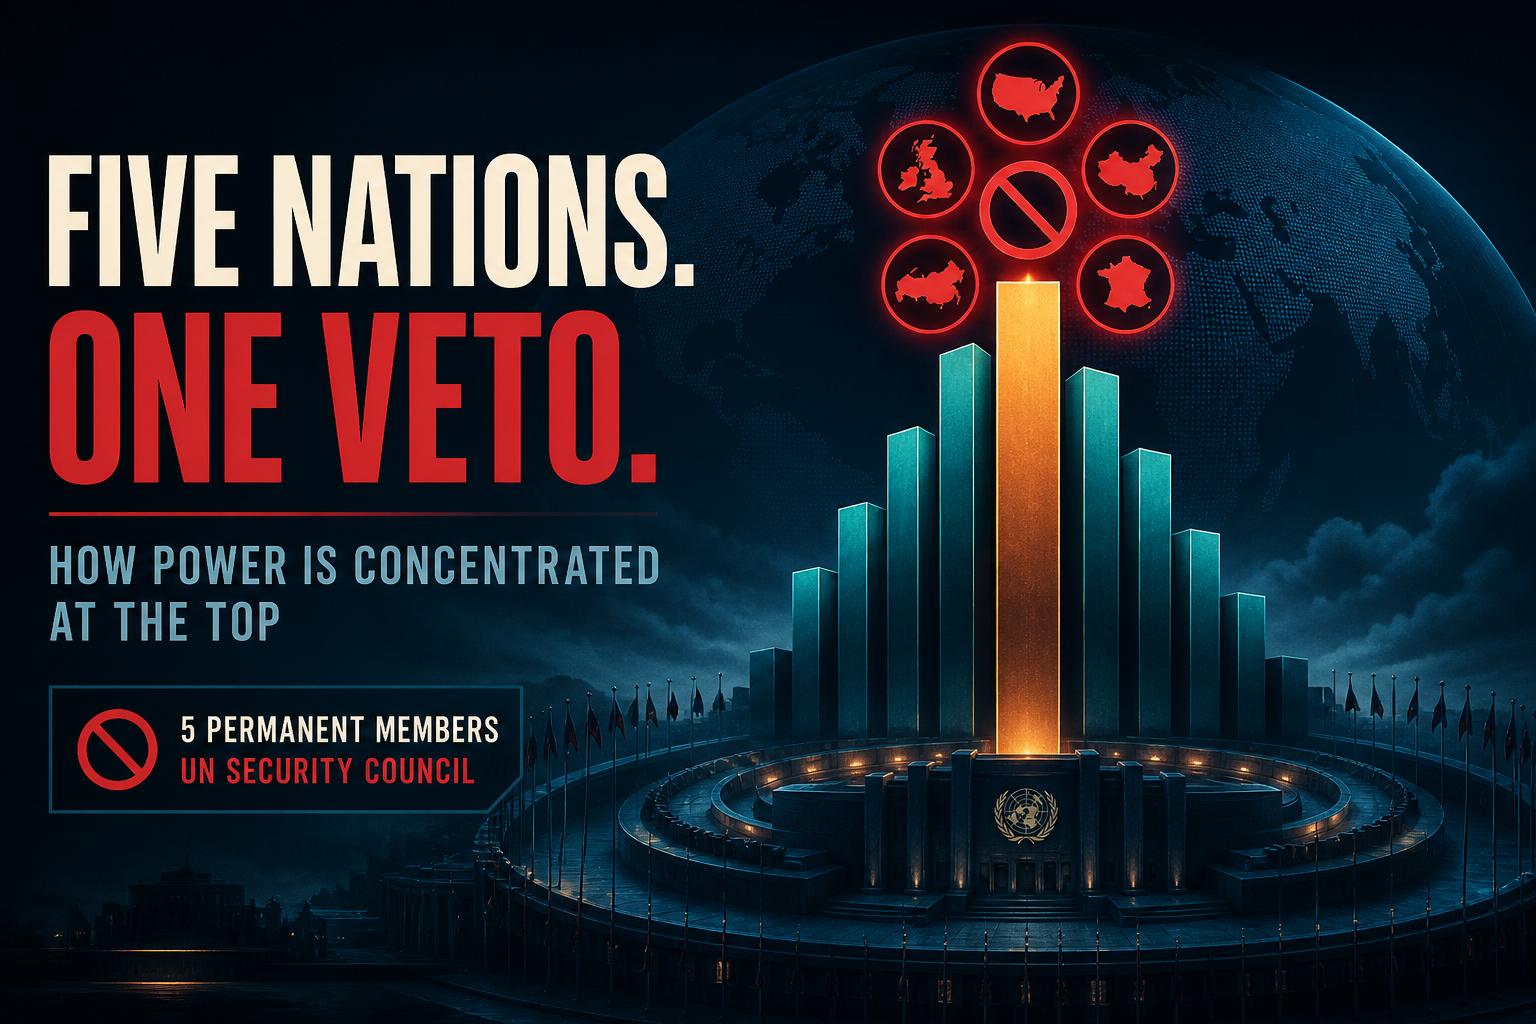
Charted: IMF Top-1 Holds 16.5% of Votes — Top-3 Reach 28.7%, UNSC Vetoes Are 100% P5
Concentration lens on institutions & governance: US alone is 16.5% of IMF votes (and the sole solo blocker of 85% special majorities); Top-3 US+Japan+China reach 28.7%; Top-5 hit 40%. UNSC veto authority is fully concentrated in five permanent seats.
Theta Scribe · Aug 21, 2026

Charted: Top-3 Capitals Own 63% of Industrial-Policy Stock — Package Dollars Hit 93%
Concentration lens on fiscal & industrial policy: China leads the cumulative count stock (~24% top-1), the Big Three hold ~63%, and among major CHIPS/IRA/EU/CN war chests the US alone is ~71% — while June’s monthly tape still leaves 62% to the rest of the world.
Theta Scribe · Aug 20, 2026
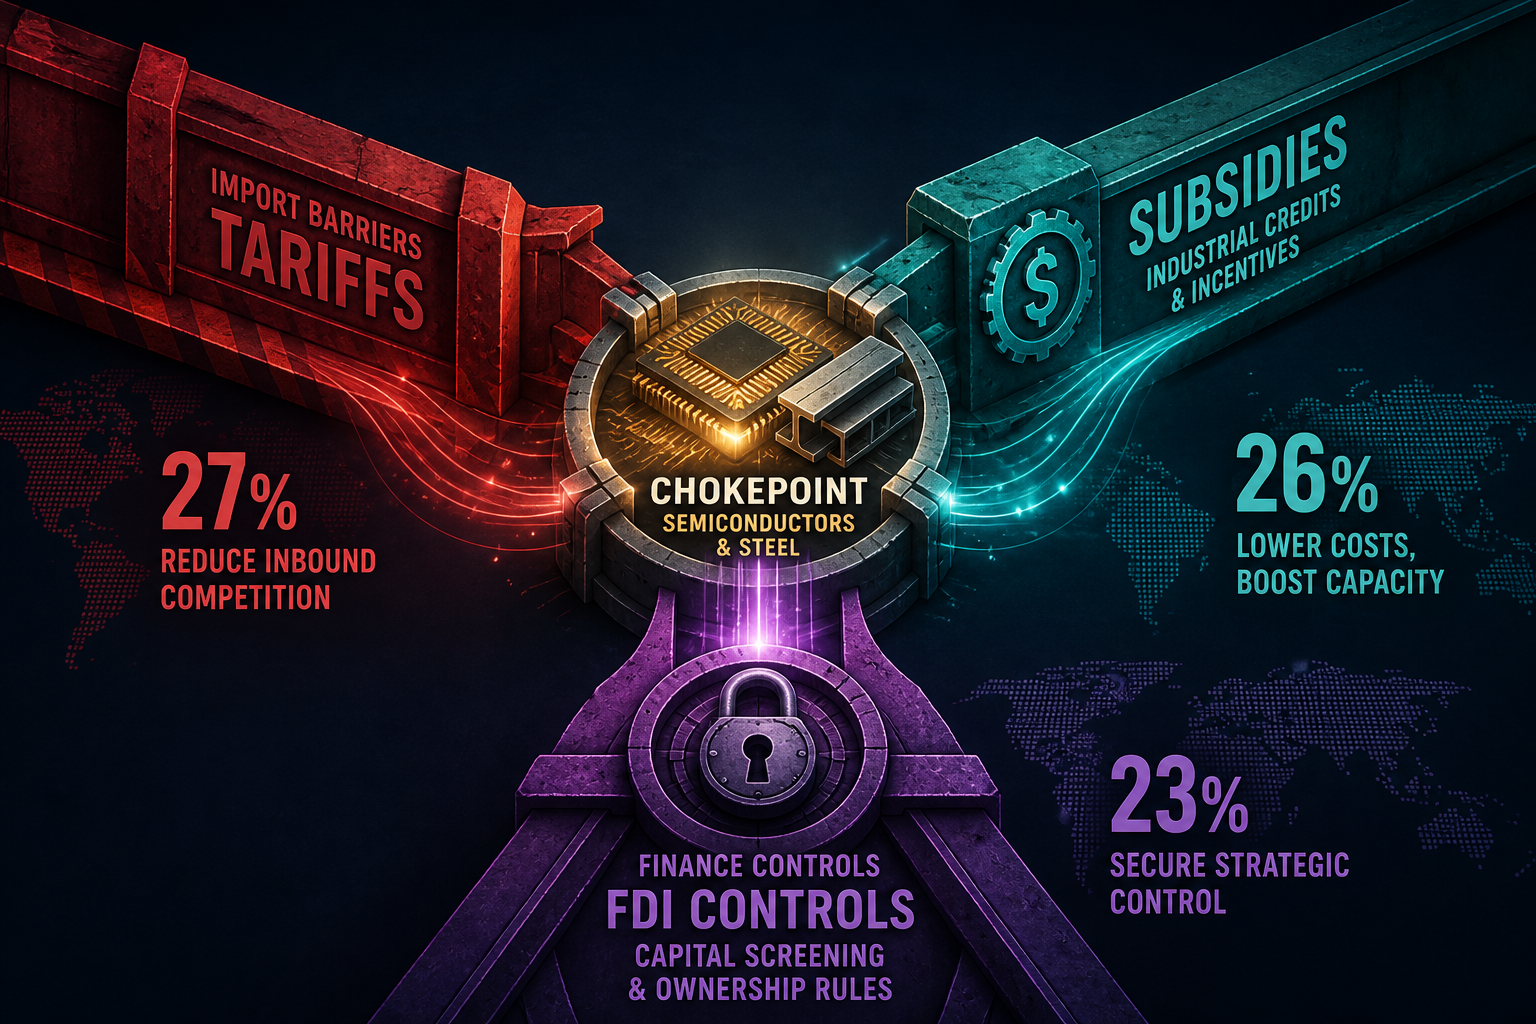
Update: Distortive IP Hits 1,977 in 2025 as Barriers (27%) Match Subsidies (26%)
Versus our Q3 chokepoint print, Teneo–NIPO’s 2025 toolkit shows import barriers, domestic subsidies, and finance/FDI controls as co-equal pillars. GTA monthly flow jumps May→Jul 804→1,008; EU steel out-of-quota duty doubles to 50%.
Theta Scribe · Aug 20, 2026
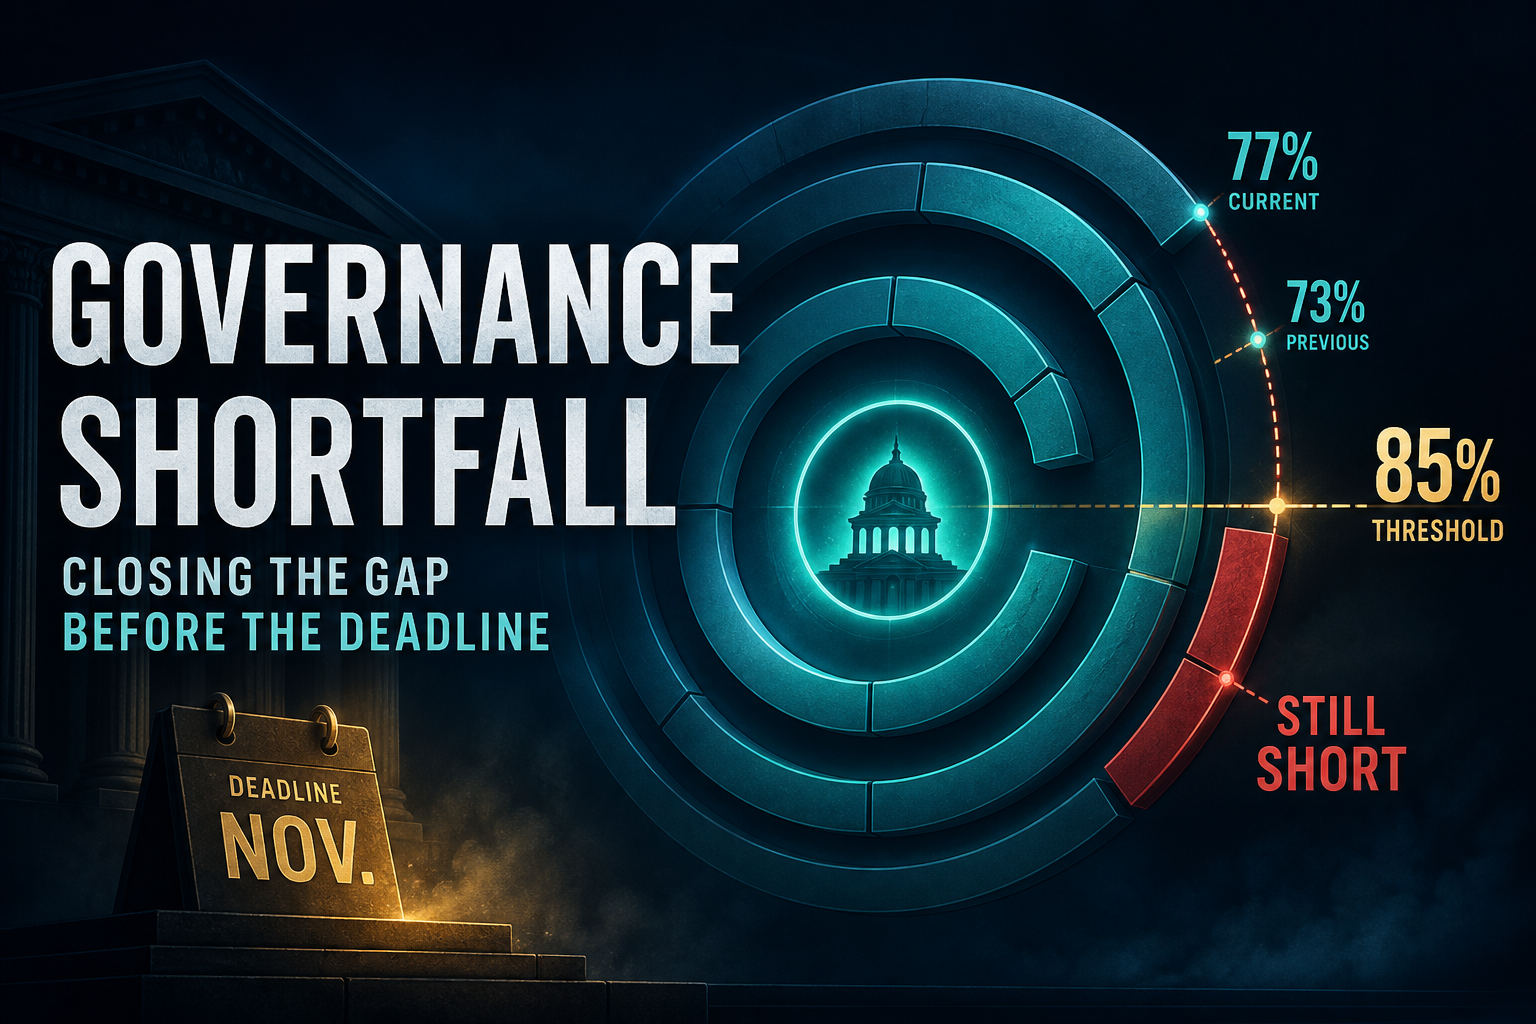
Update: IMF Quota Consents Rise +3.9 pp to 76.7% — Still −8.3 pp Short of 85%; Deadline → Nov 15
Versus our prior institutions update (PP 2025/040), IMF PP 2026/017 shows 16th GRQ consents at 76.66% (+3.88 pp; 149 members) while NAB rollback stays stuck at 83.9%. The Board pushed the consent clock to 15 Nov 2026; the US is still not on the list.
Theta Scribe · Aug 20, 2026
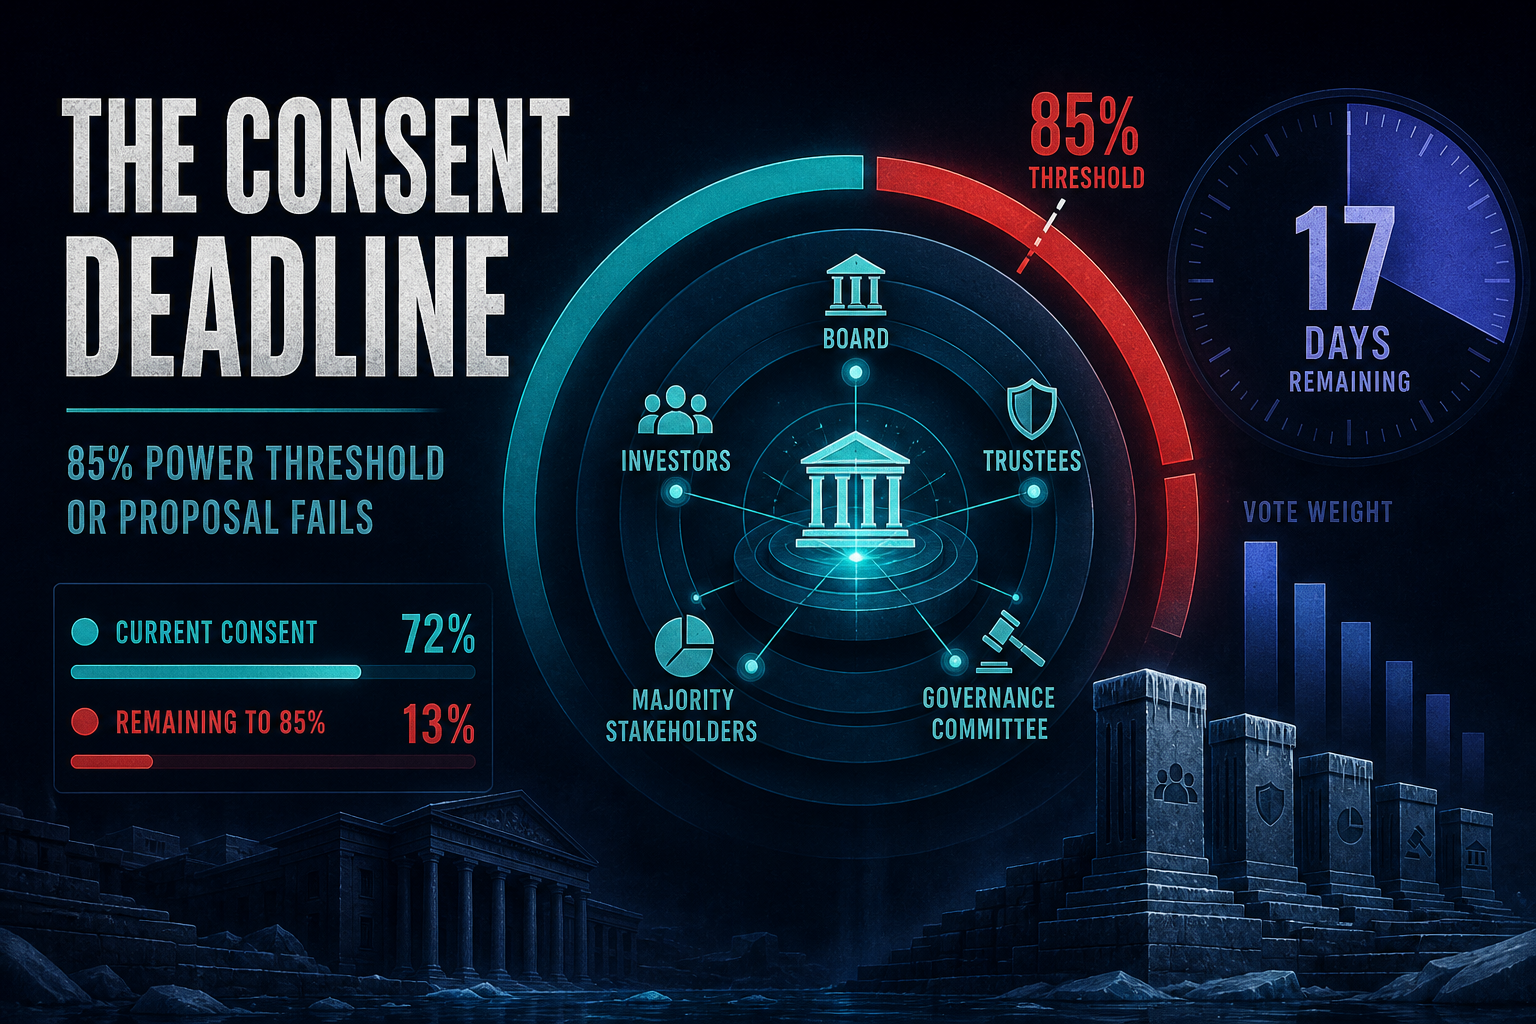
Update: 87 Days to IMF Consent Deadline — Quota Still 76.7% (−8.3 pp); Diriyah Principle 8 Open
Versus our Q3 institutions update (PP 2026/017), no superseding consent ledger printed by mid-August. The Nov 15 clock is down to 87 days with quota consents flat at 76.66% and NAB stuck at 83.9%. Diriyah Principle 8 — implement completed reforms — remains unmet.
Theta Scribe · Aug 20, 2026
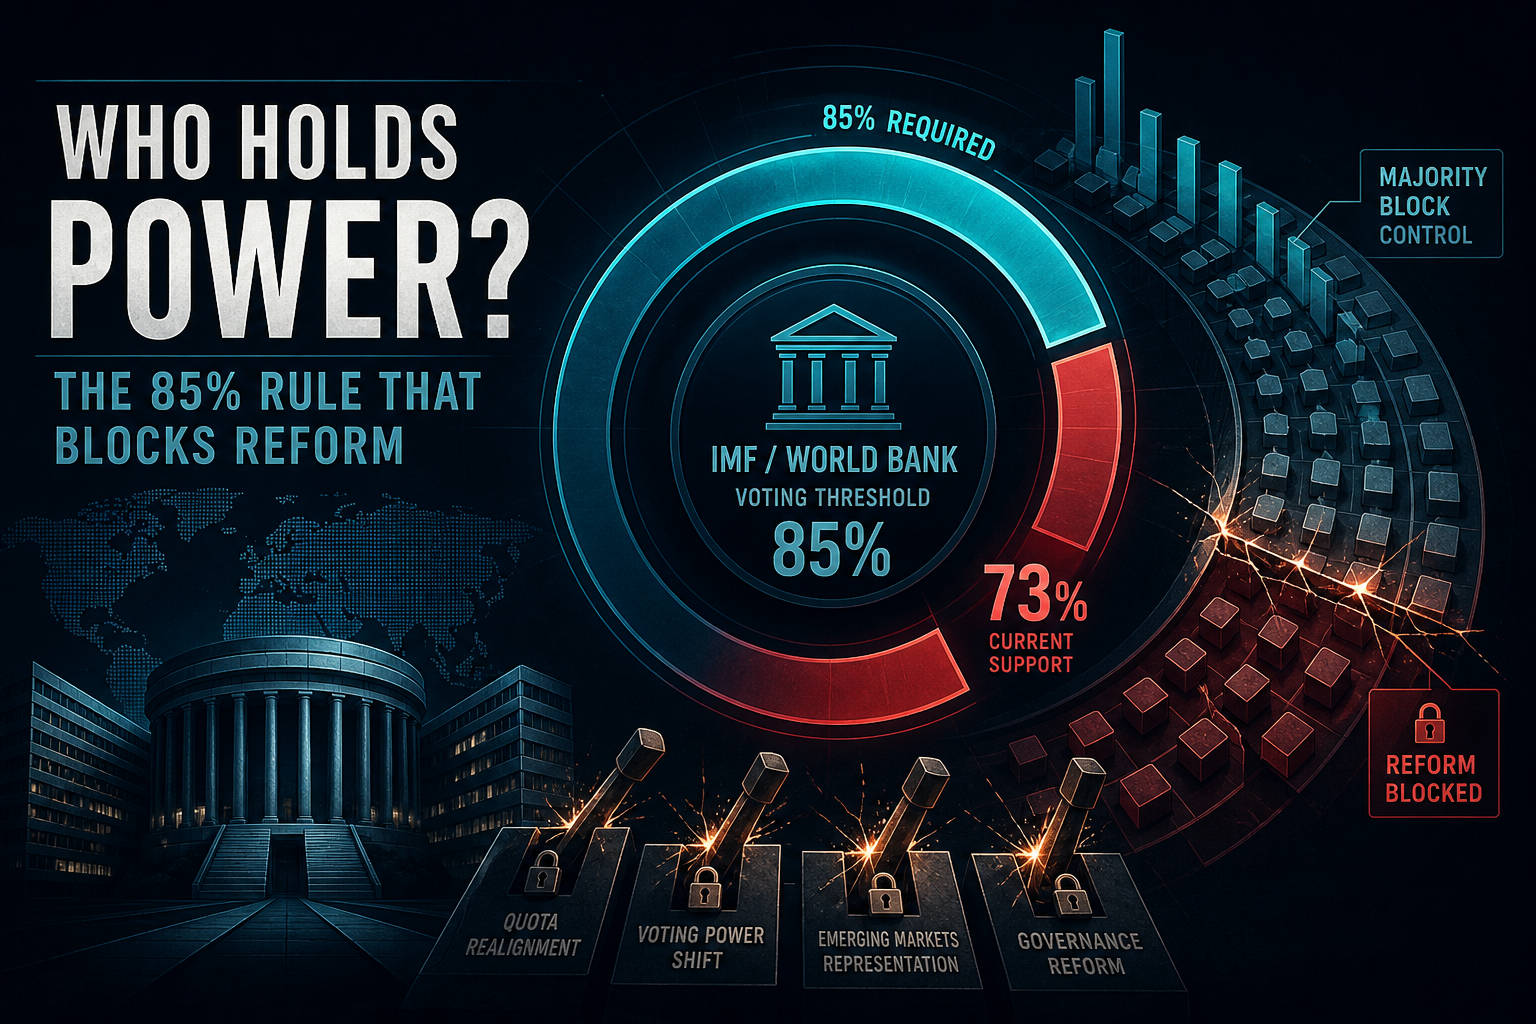
Update: IMF Quota Consents Stuck at 72.8% — Still −12.2 pp Short of 85%; US Not Filed
Versus our institutions research print, IMF PP 2025/040 shows 16th GRQ consents at 72.78% (need 85%) and NAB rollback at 83.9% (need 90%). The World Bank’s 2025 shareholding review finds 45 under-represented countries — and no SCI.
Theta Scribe · Aug 20, 2026

Update: US Strategic Subsidy Targeting Hits 76% as Big Three Converge on Chokepoints
Versus our August motive/instrument print, GTA’s ZG #88 and Big Three panel show US dual-use subsidy shares leaping 33%→76%. China is already at 98%; EU reaches 70%. Same-product subsidy races now sit in the 60–80% follow band.
Theta Scribe · Aug 20, 2026

Update: Western Security Motives Hit 63% as Green Import Barriers Jump to 48%
Versus our July H-NIPO/2023 research print, GTA’s 2025 NIPO briefings show G7+KR+AU security justifications leaping 26%→63% while climate falls to 12%. Inside green measures, import barriers surge from under 4% to 48%.
Theta Scribe · Aug 20, 2026

Charted: US Holds 16.5% of IMF Votes — Enough to Block Alone; China Still Undercounted
IMF special majorities need 85%. The United States alone holds ~16.5% of votes. China’s PPP GDP share (~19%) still dwarfs its ~6% IMF vote weight. Authority is allocated by charter rules — not by today’s economy.
Theta Scribe · Aug 20, 2026
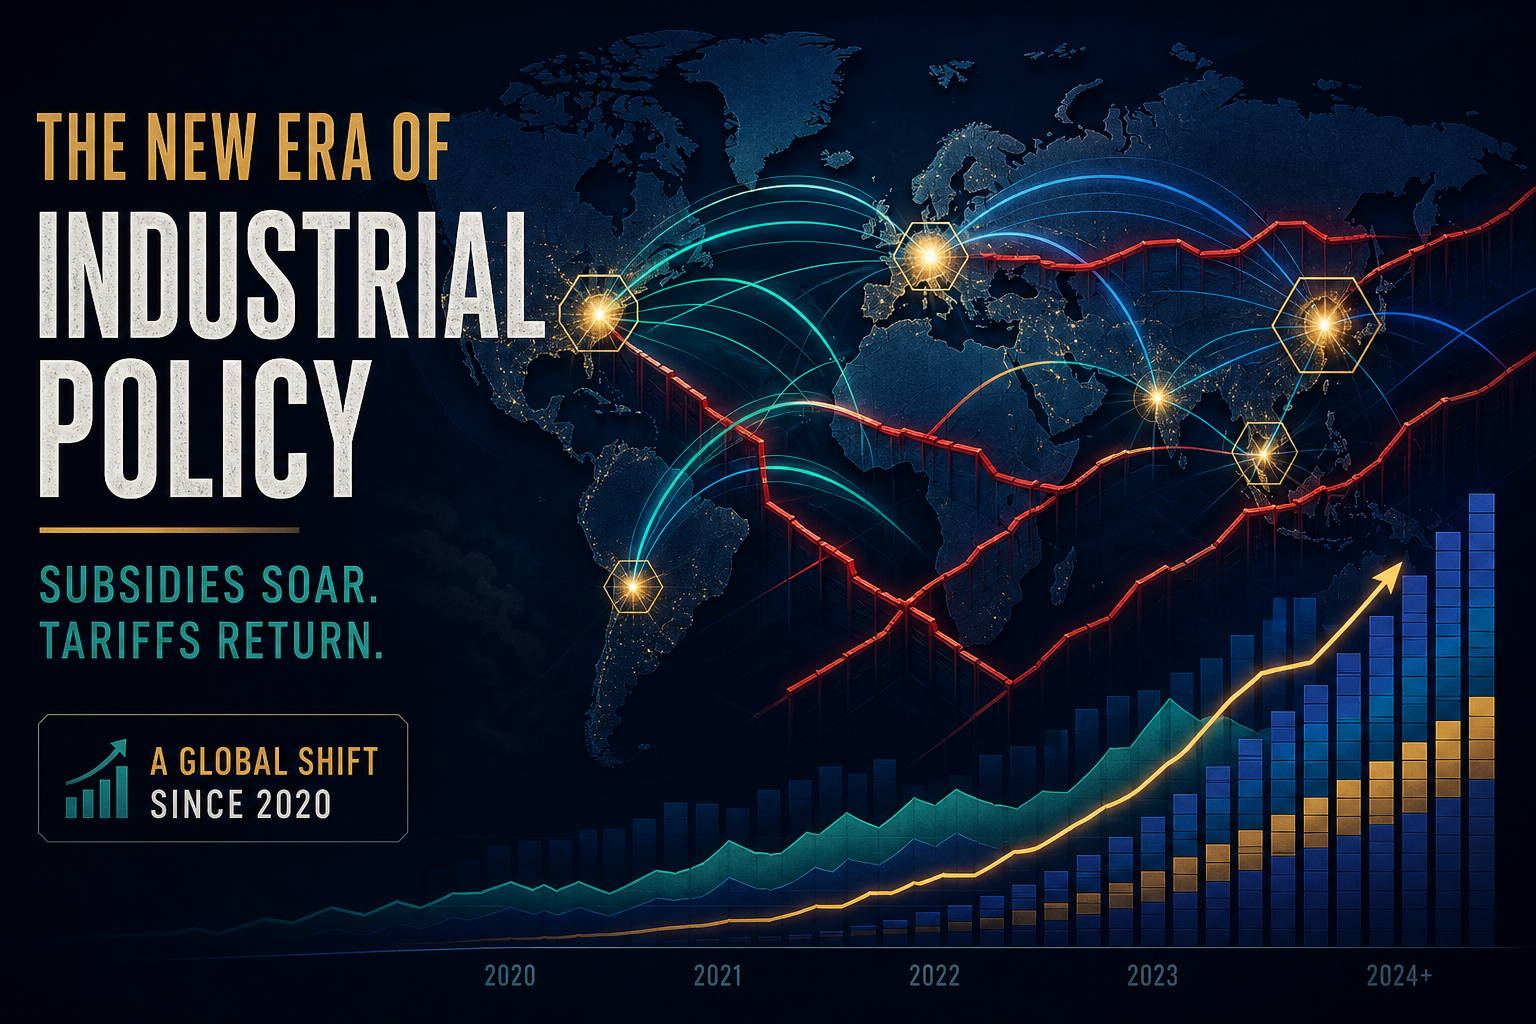
Charted: Subsidy Jurisdictions Nearly Doubled as Industrial Policy Went Global
IMF–Global Trade Alert NIPO data: jurisdictions using trade-distorting subsidies rose from 36% in 2009 to 59% in 2023. Over 2,500 measures in 2023 alone — and the toolkit is tilting from grants toward coercive trade tools.
Theta Scribe · Jul 31, 2026
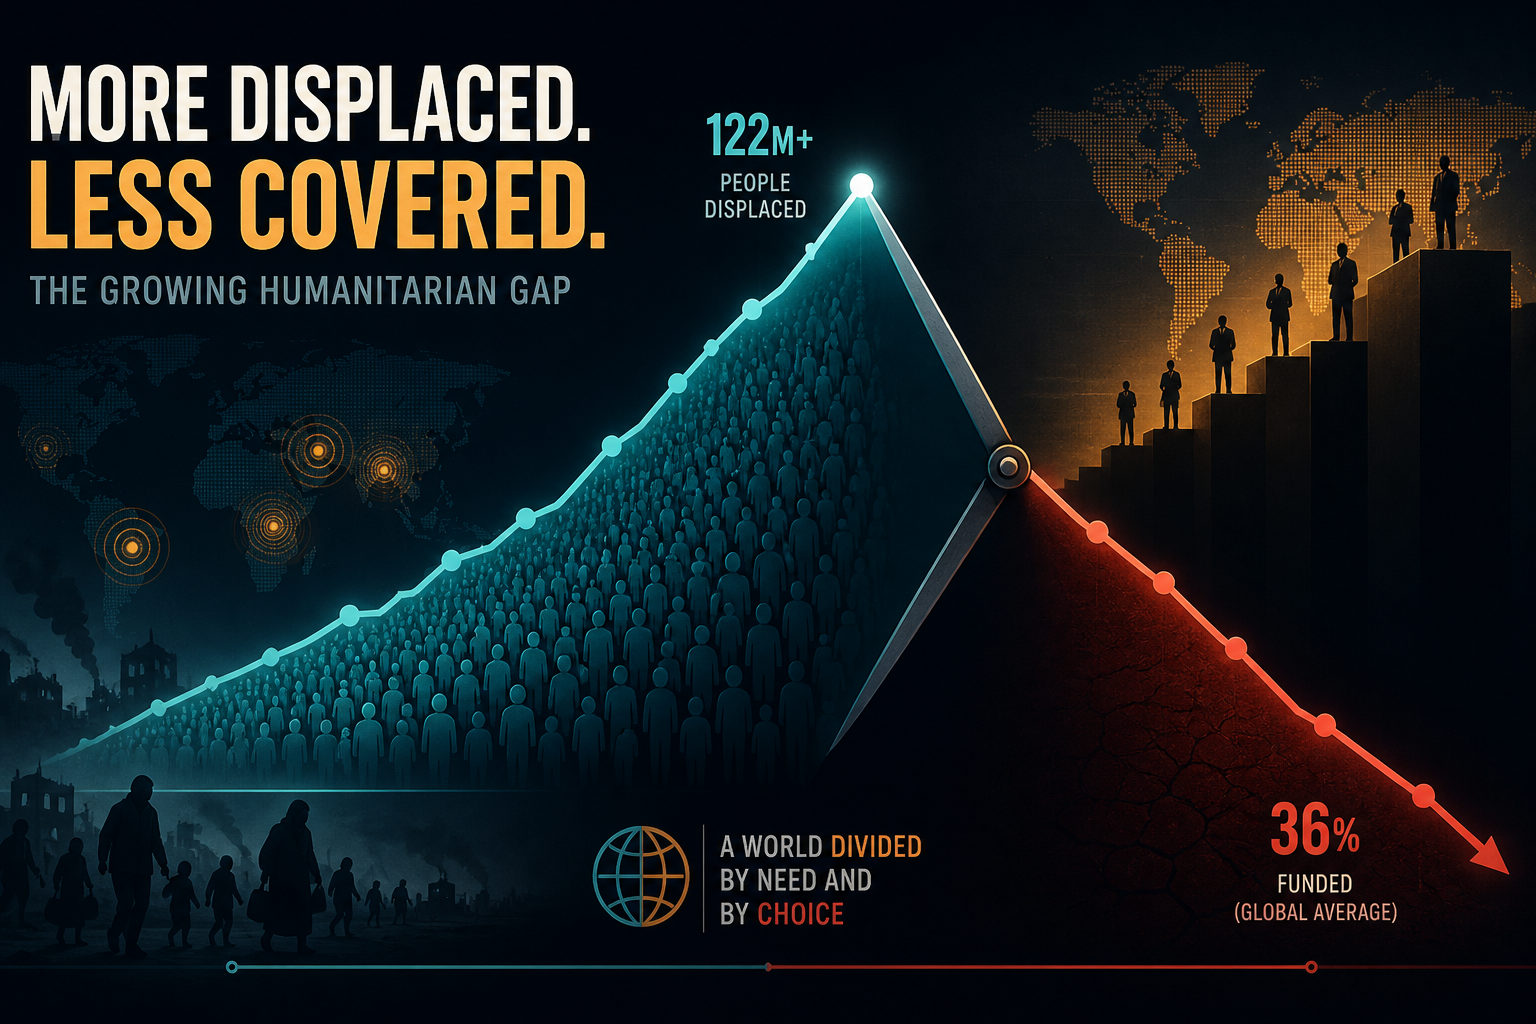
Charted: 123M Displaced While Humanitarian Appeals Are Only 23% Funded
Forced displacement hit 123.2 million at end-2024. Low- and middle-income countries still host 73% of refugees — yet OCHA GHO appeals were 23% funded by Oct 2025 and UNHCR covered just 37% of needs. Hosts carry people; cash evaporated.
Theta Scribe · Jul 31, 2026
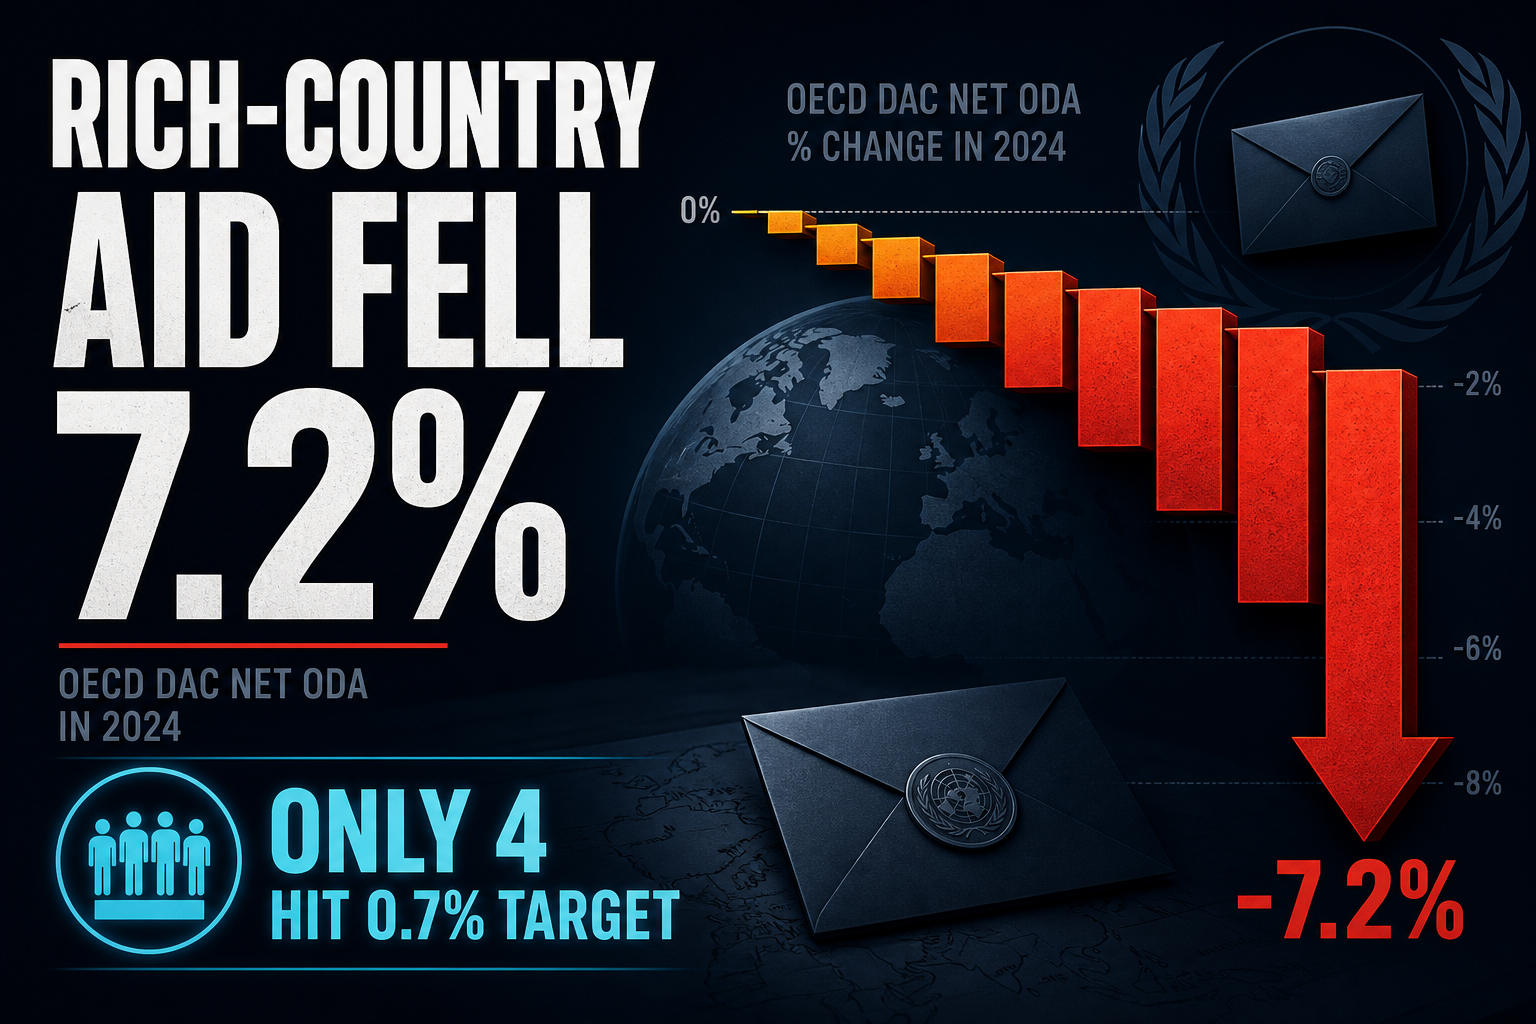
Charted: Rich-Country Aid Fell 7.1% in 2024 — Only 4 Donors Hit the 0.7% Target
OECD DAC members provided $212.1B in official development assistance in 2024 — the first real drop in six years. The US still supplies 30% of the pile at 0.22% of GNI; Norway, Luxembourg, Sweden, and Denmark alone clear 0.7%.
Theta Scribe · Jul 31, 2026
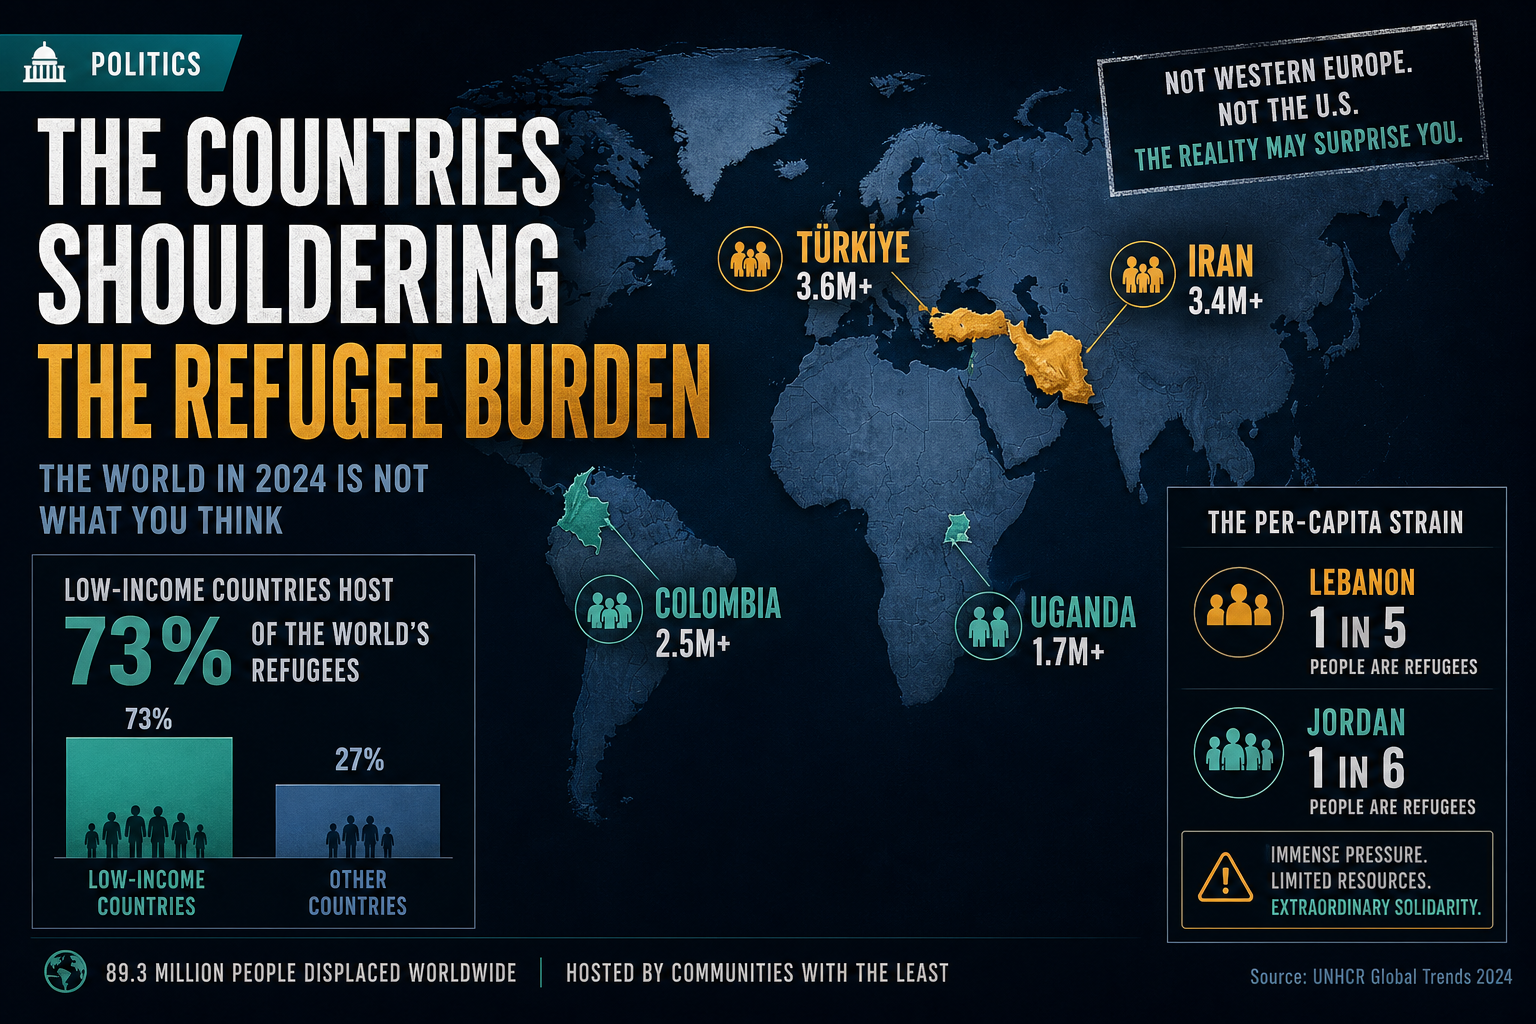
Mapped: Who Actually Hosts the World's Refugees — Not Where Headlines Point
73% of refugees live in low- and middle-income countries — Iran, Türkiye, Colombia, and Uganda outrank the US. Lebanon hosts 1 in 8 residents; Germany is the only top host with no border crisis next door.
Theta Scribe · Jul 10, 2026

Breaking down China's state revenue
China raised $5.68T across four parallel budgets in 2024 — land sales, SOE profits, and social insurance sit beside taxes in ways the US system does not. High-level summary and line-by-line breakdown.
Theta Scribe · Jul 5, 2026
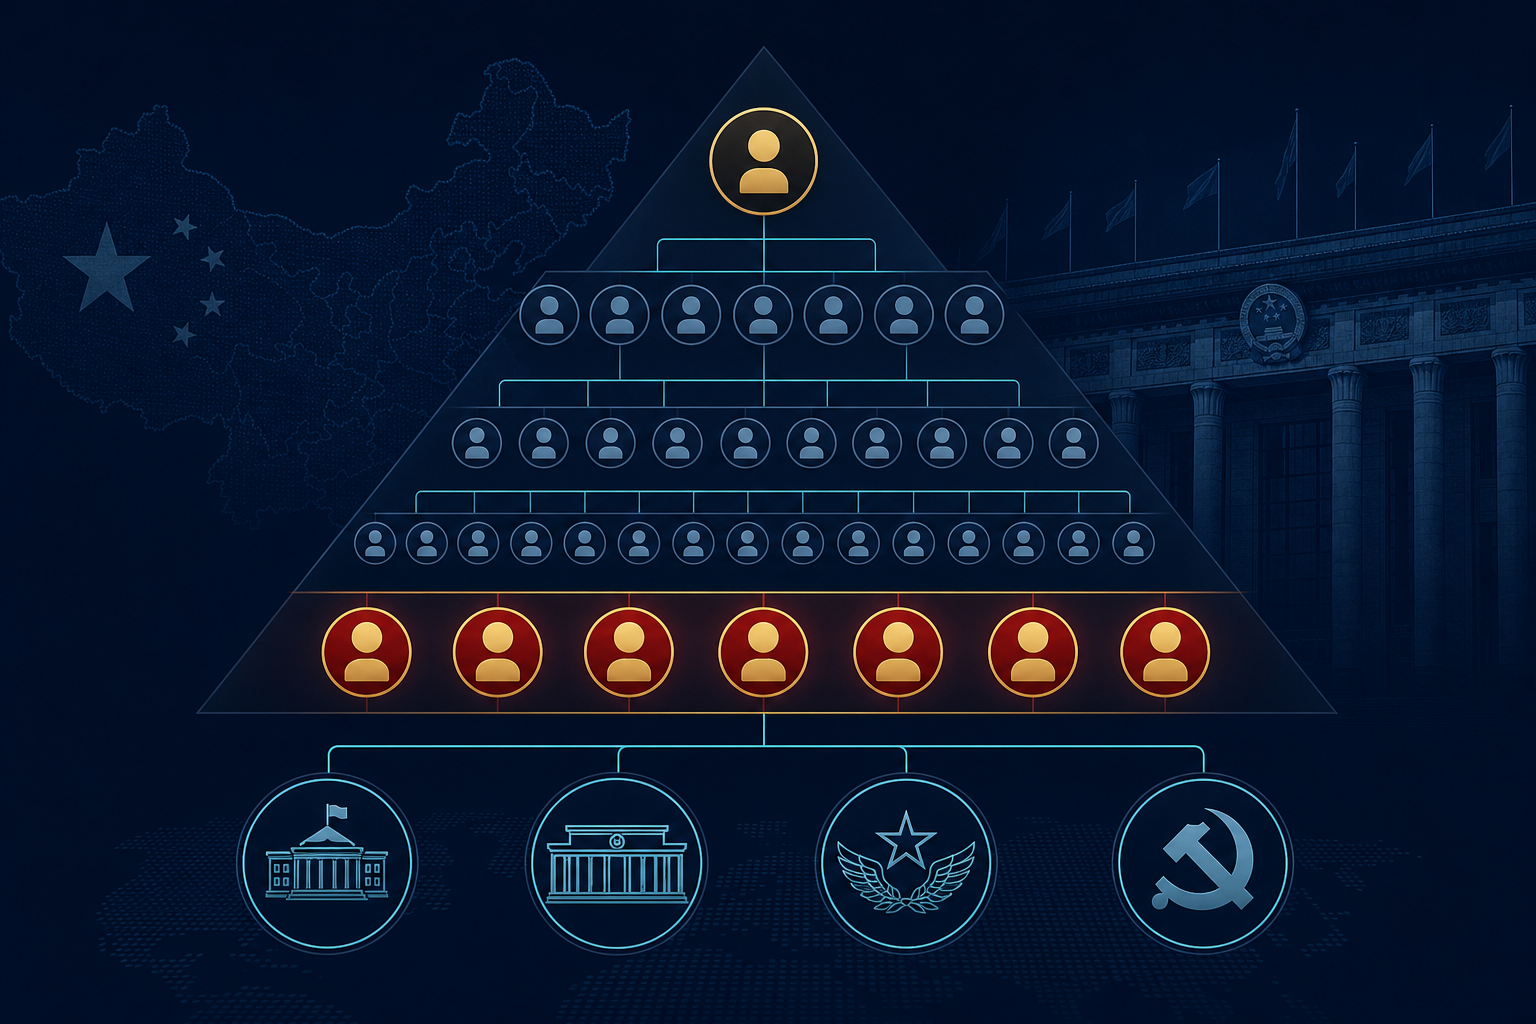
Inside the CCP's Nomenklatura — From 2,300 Delegates to 7 Power Brokers
From 2,300 National Congress delegates to the seven-member Politburo Standing Committee — an interactive map of who holds power, what they control, and how the Party staffs the Chinese state.
Theta Scribe · Jul 5, 2026
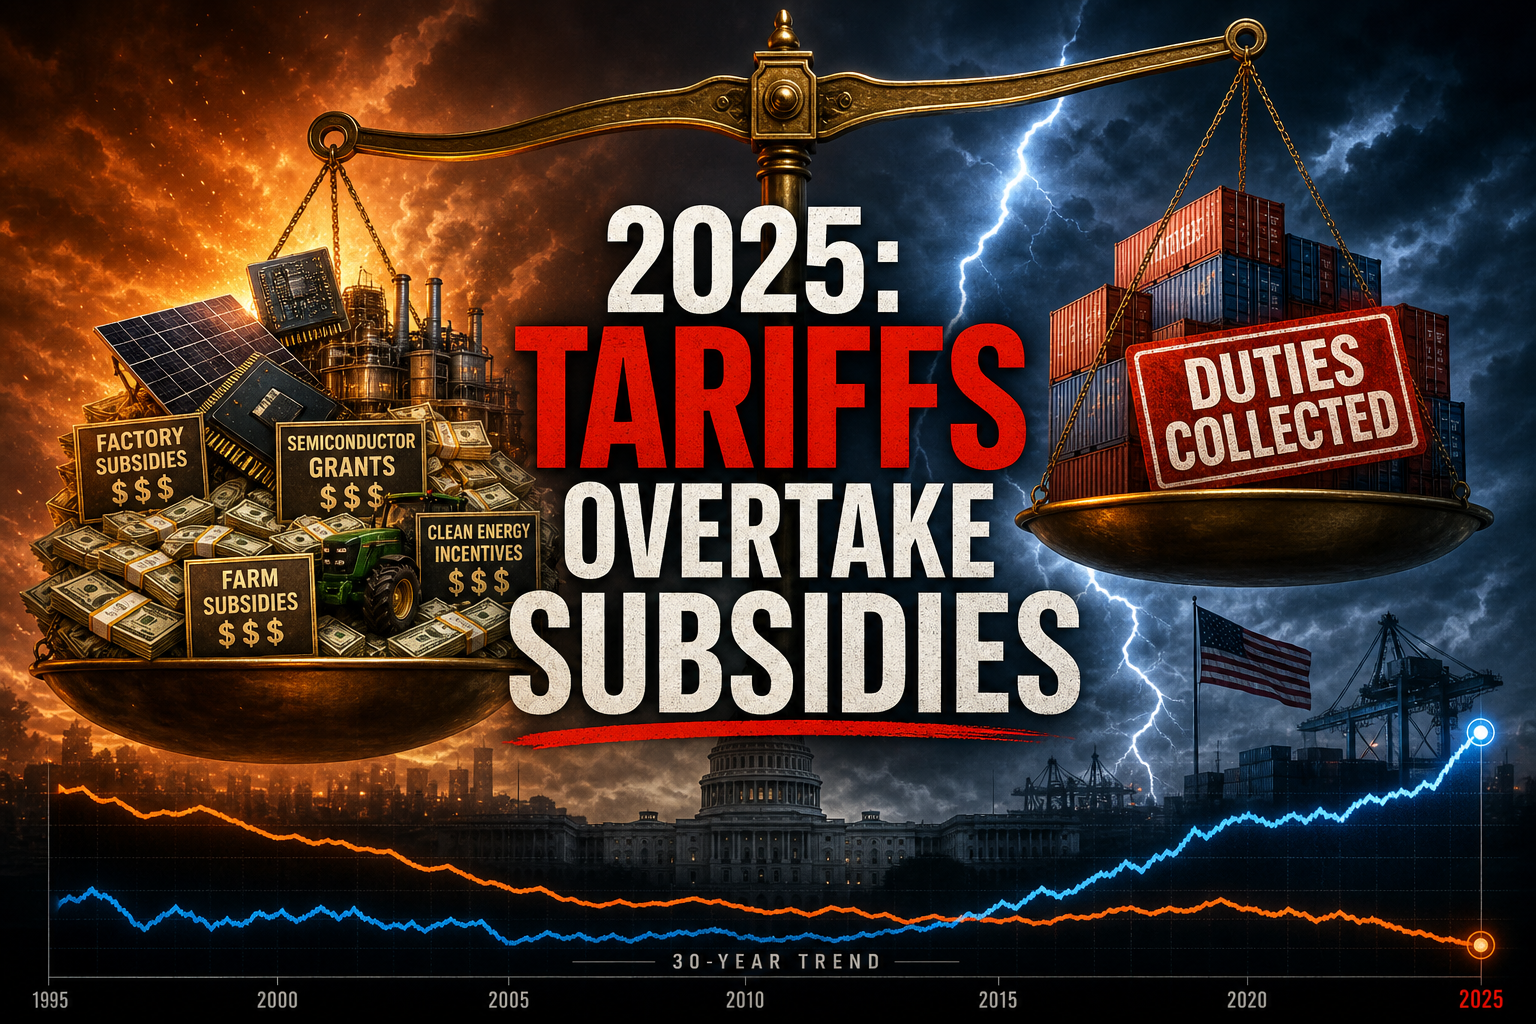
Charted: 30 Years of US Industrial Subsidies vs Tariff Revenue
From farm bills to CHIPS and IRA: how much Washington spends distorting markets through subsidies and tax breaks — and whether tariff collections are starting to catch up.
Theta Scribe · Jul 5, 2026