
Research desk
Economics
36 original visual essays in this beat — each with its own figure and sourced argument, not a sequel of the last chart.
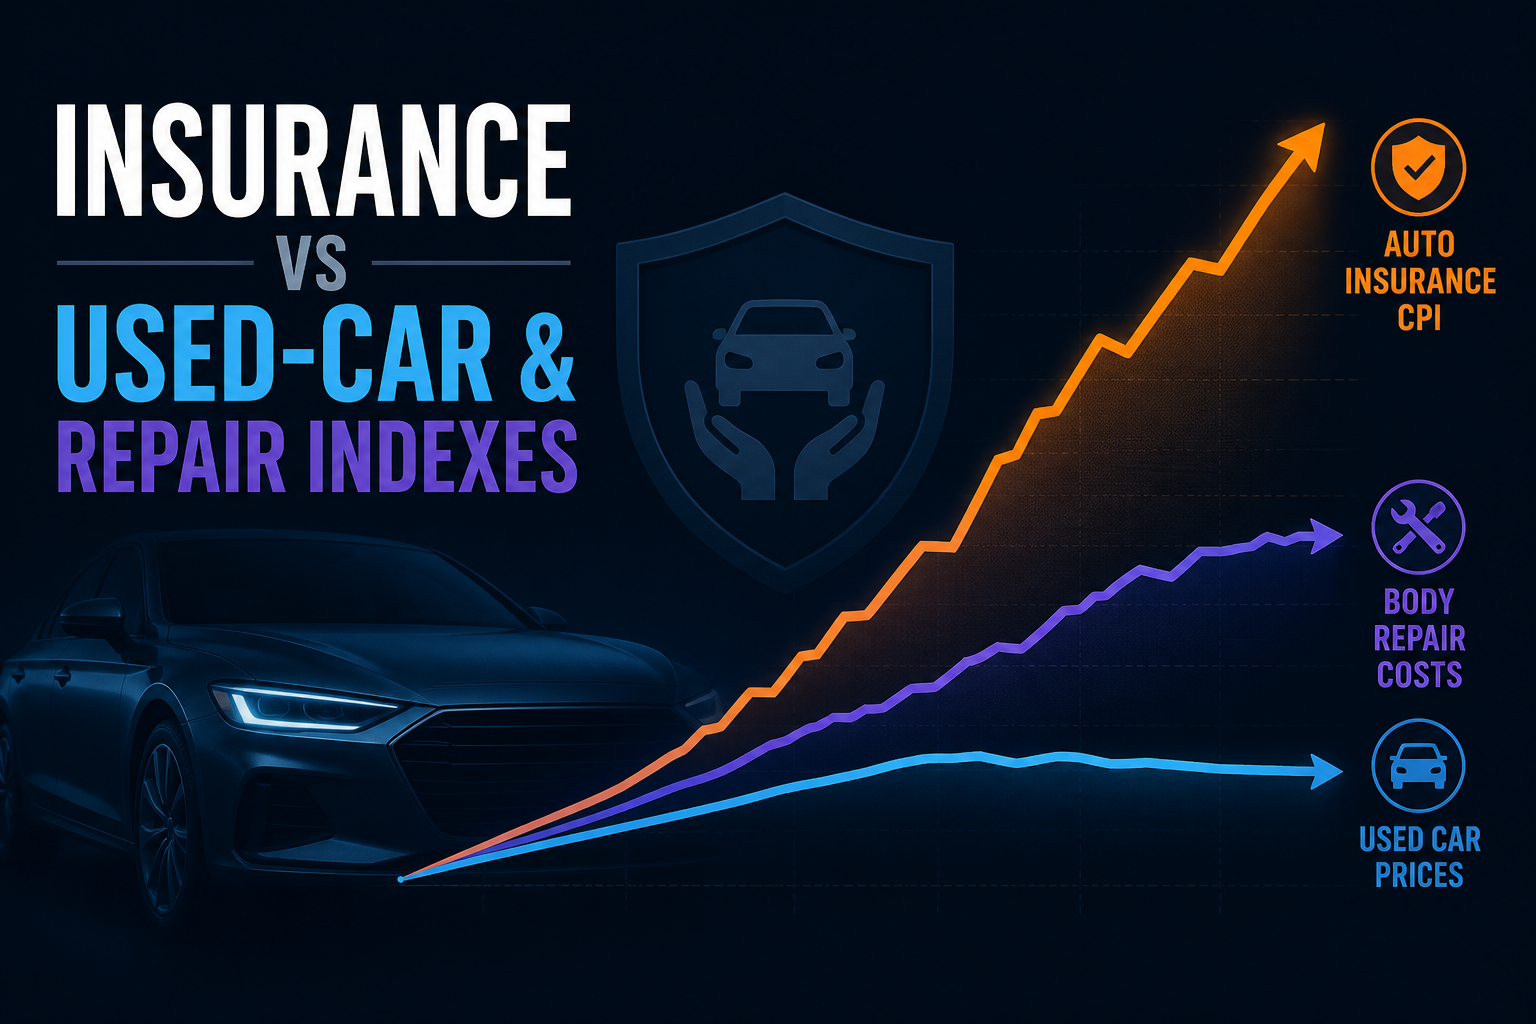
Auto Insurance CPI vs Used-Car and Repair Prices: Did Premiums Keep Climbing After Input Costs Cooled?
On a 2019 = 100 scale, July 2026 motor-vehicle insurance CPI sits at 149.9 while used cars print 132.1 — a 17.8-point wedge even as repair inflation moderates.
Theta Scribe · Aug 31, 2026
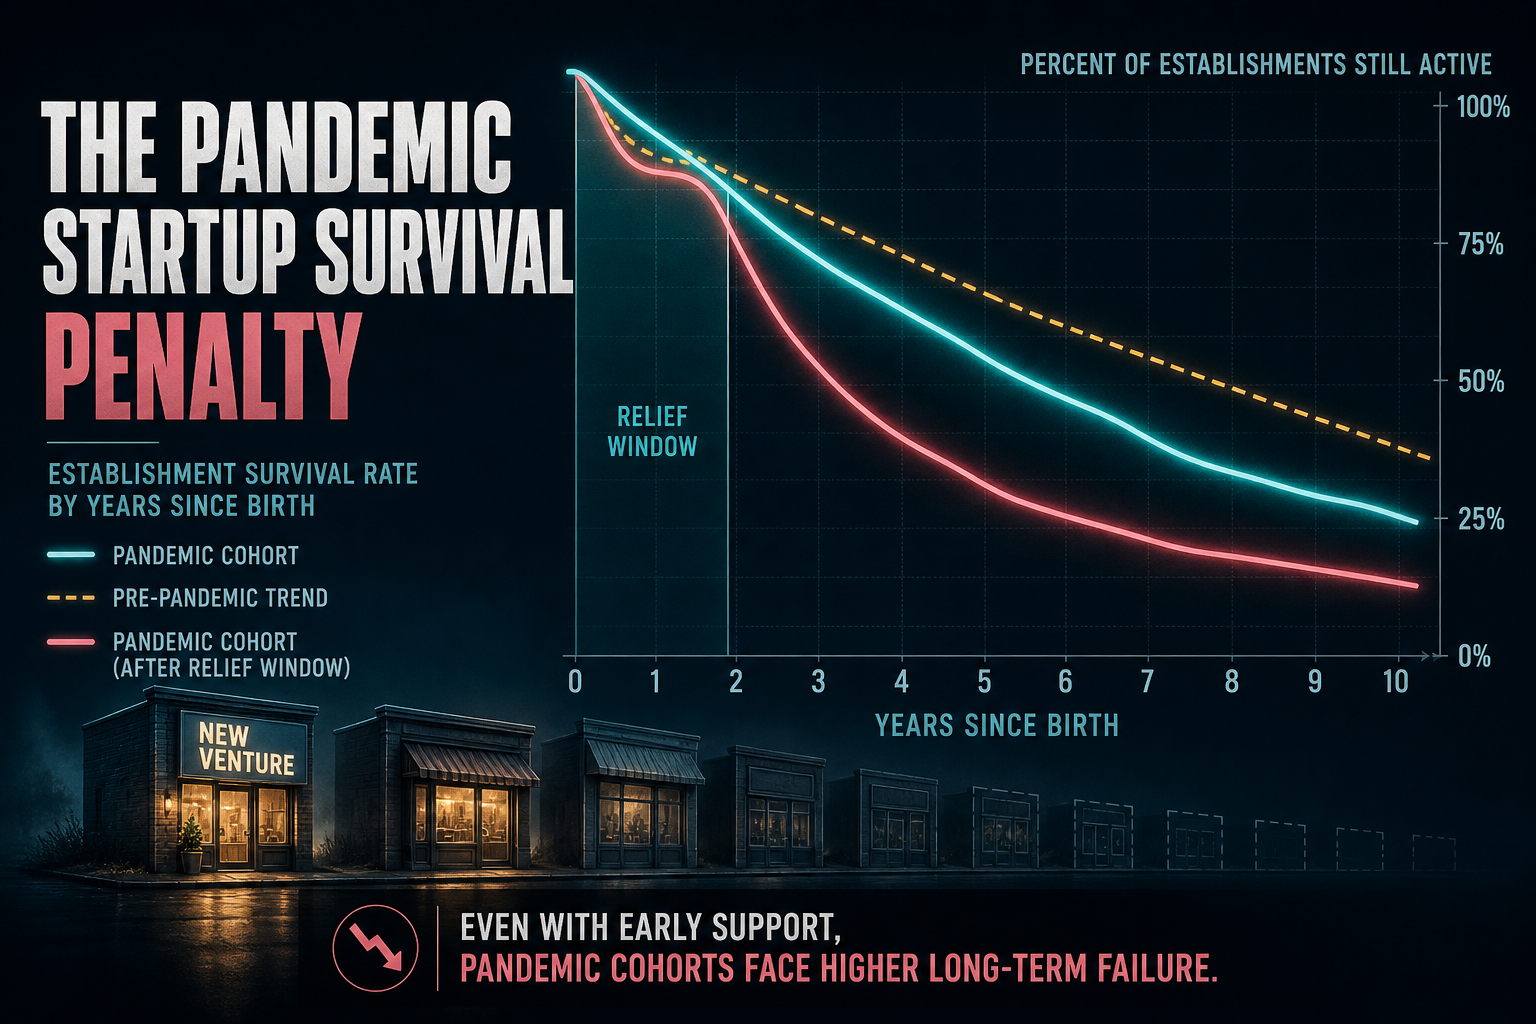
Survival Curves of Pandemic-Era Startups: One-Year Share Fell From 80.8% to 76.9% After Relief
BLS BED one-year establishment survival — desk-averaged across Census divisions — rose for 2020 births during the PPP/ERC window, then slipped below the 2017–19 baseline for 2022 births once relief wound down.
Theta Scribe · Aug 31, 2026
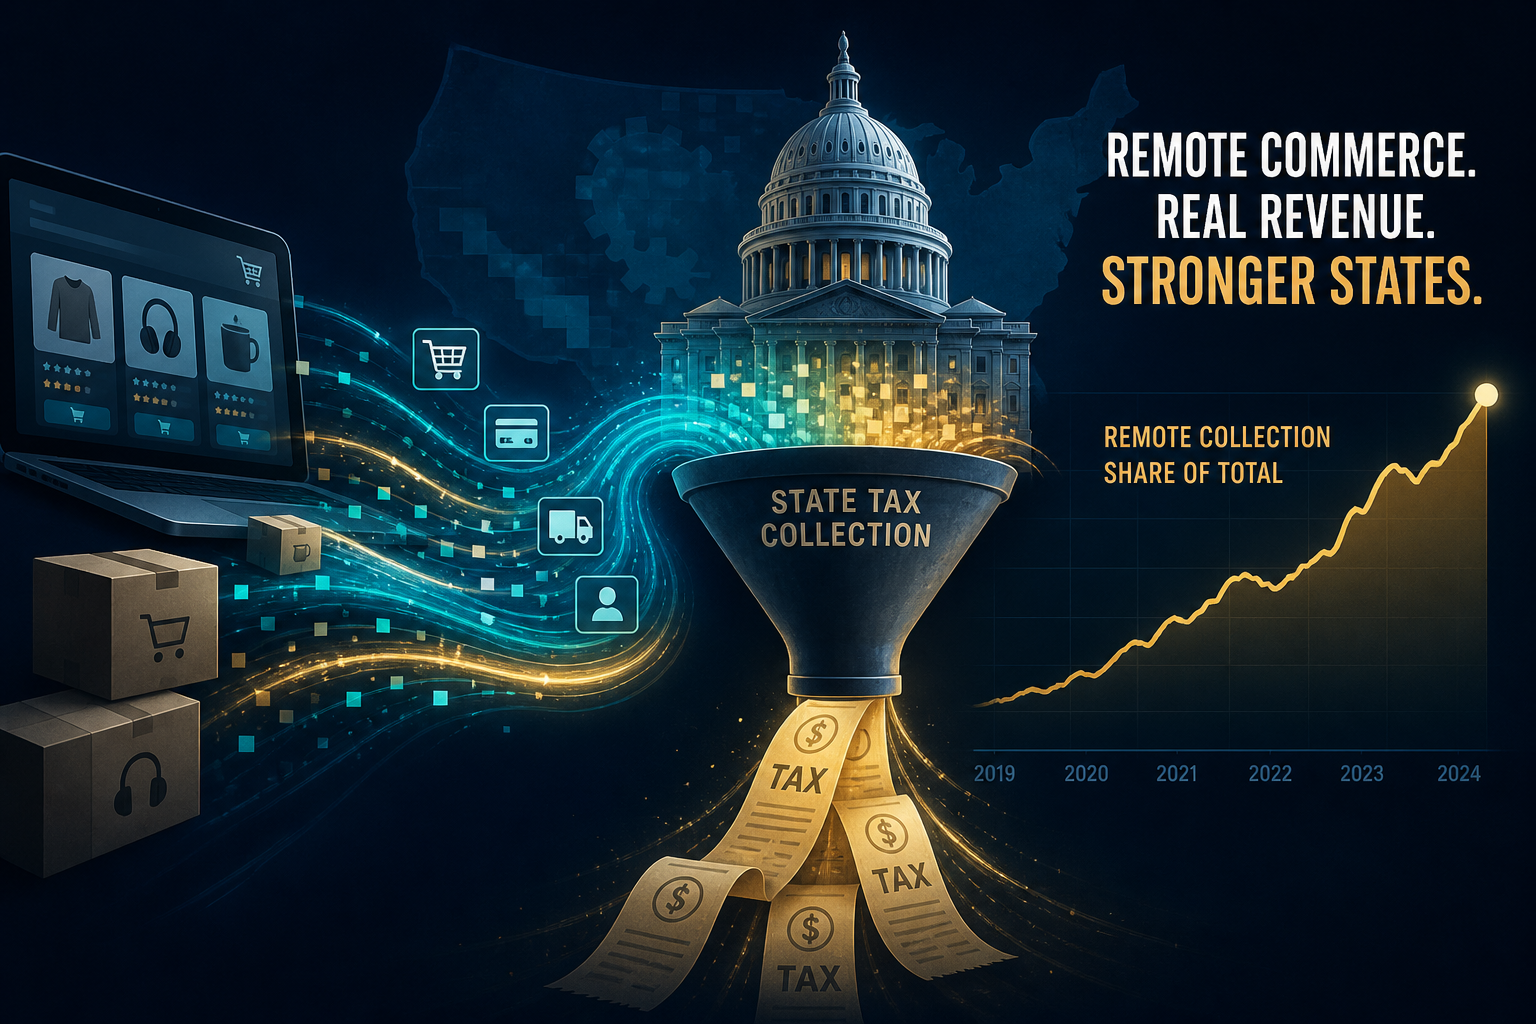
Charted: Remote Sales-Tax Collection Hit 11.4% of Large-State GST — Fast Enough to Offset Erosion in Only 4 of 12 States
After Wayfair, large-state remote and marketplace remittance rose from 2.1% of general sales tax in FY2017 to 11.4% in FY2025. Cumulative recovery leads a modeled service-mix erosion drag by $5.2B — but only California, Texas, Florida, and Washington clear a clean offset.
Theta Scribe · Aug 31, 2026
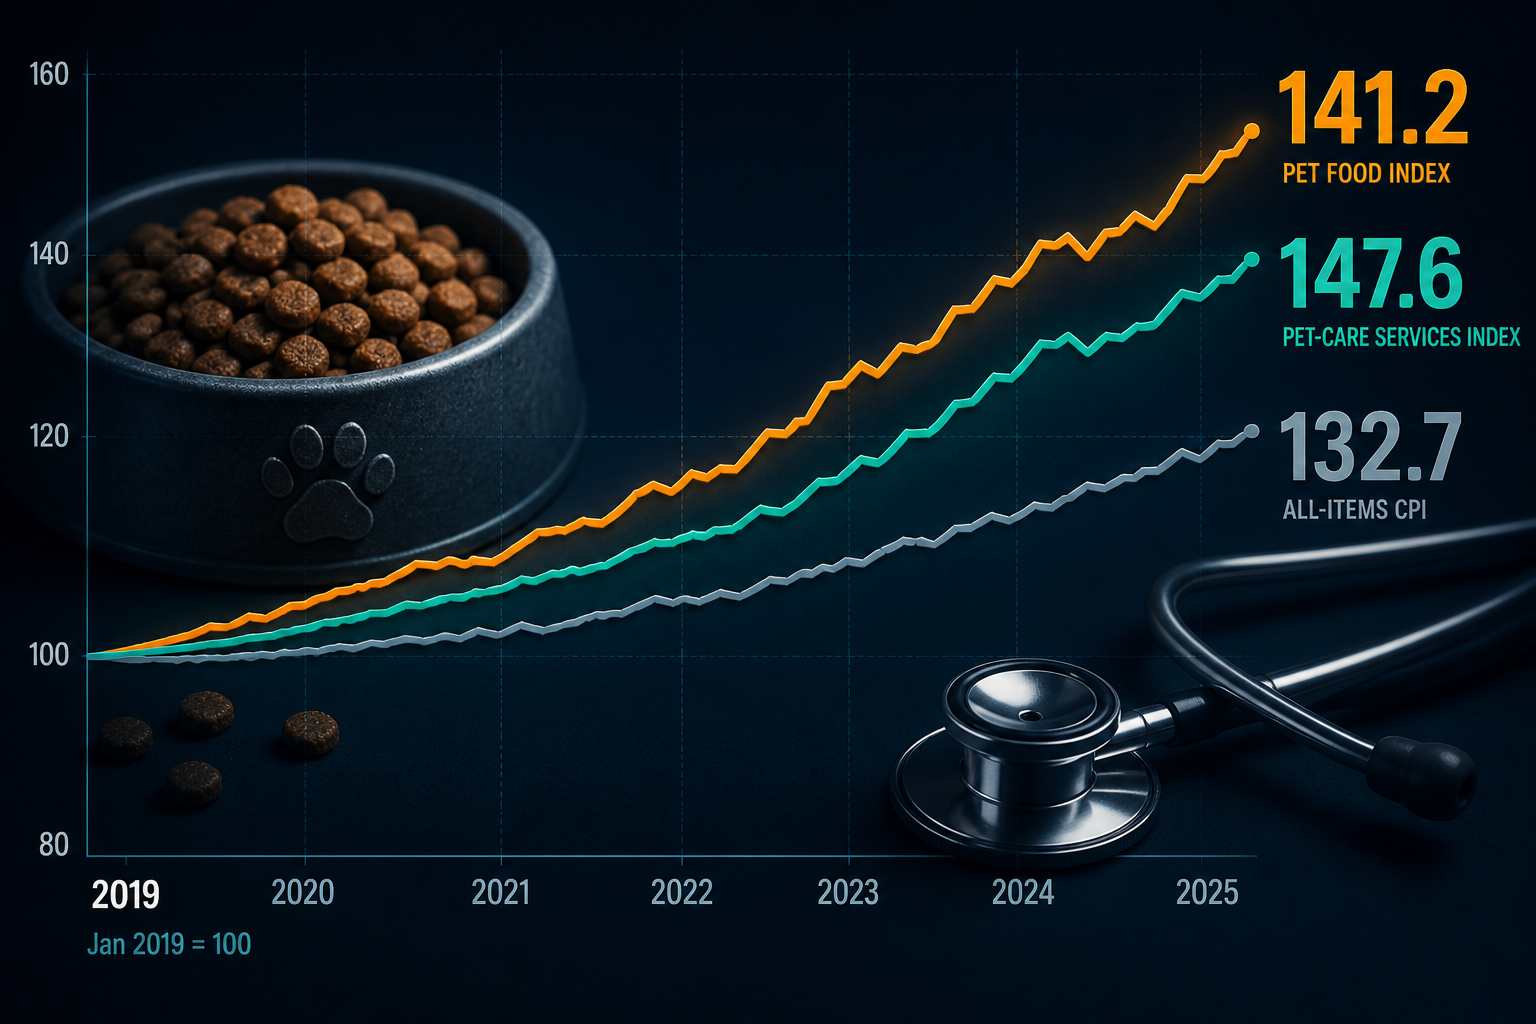
Pet Food 141.2 and Pet Care 147.6 vs All-Items 132.7: CPI Since 2019
Rebased to January 2019 = 100, BLS pet-food CPI sits at 141.2 and other pet services (incl. veterinary) at 147.6 in July 2026 — both ahead of all-items CPI-U at 132.7. Pet care’s lead is 14.9 percentage points; pet food’s is 8.5.
Theta Scribe · Aug 30, 2026

11 Points Closed: Streaming Video CPI Versus Cable and Satellite TV Since 2019
Cable, satellite, and live-streaming TV CPI is up 27.6% since 2019, while purchase/subscription/rental-of-video CPI is up 14.2%. The stream−cable gap bottomed at −24.4 pp in March 2023 and has closed 11 points to −13.4 as of July 2026.
Theta Scribe · Aug 30, 2026
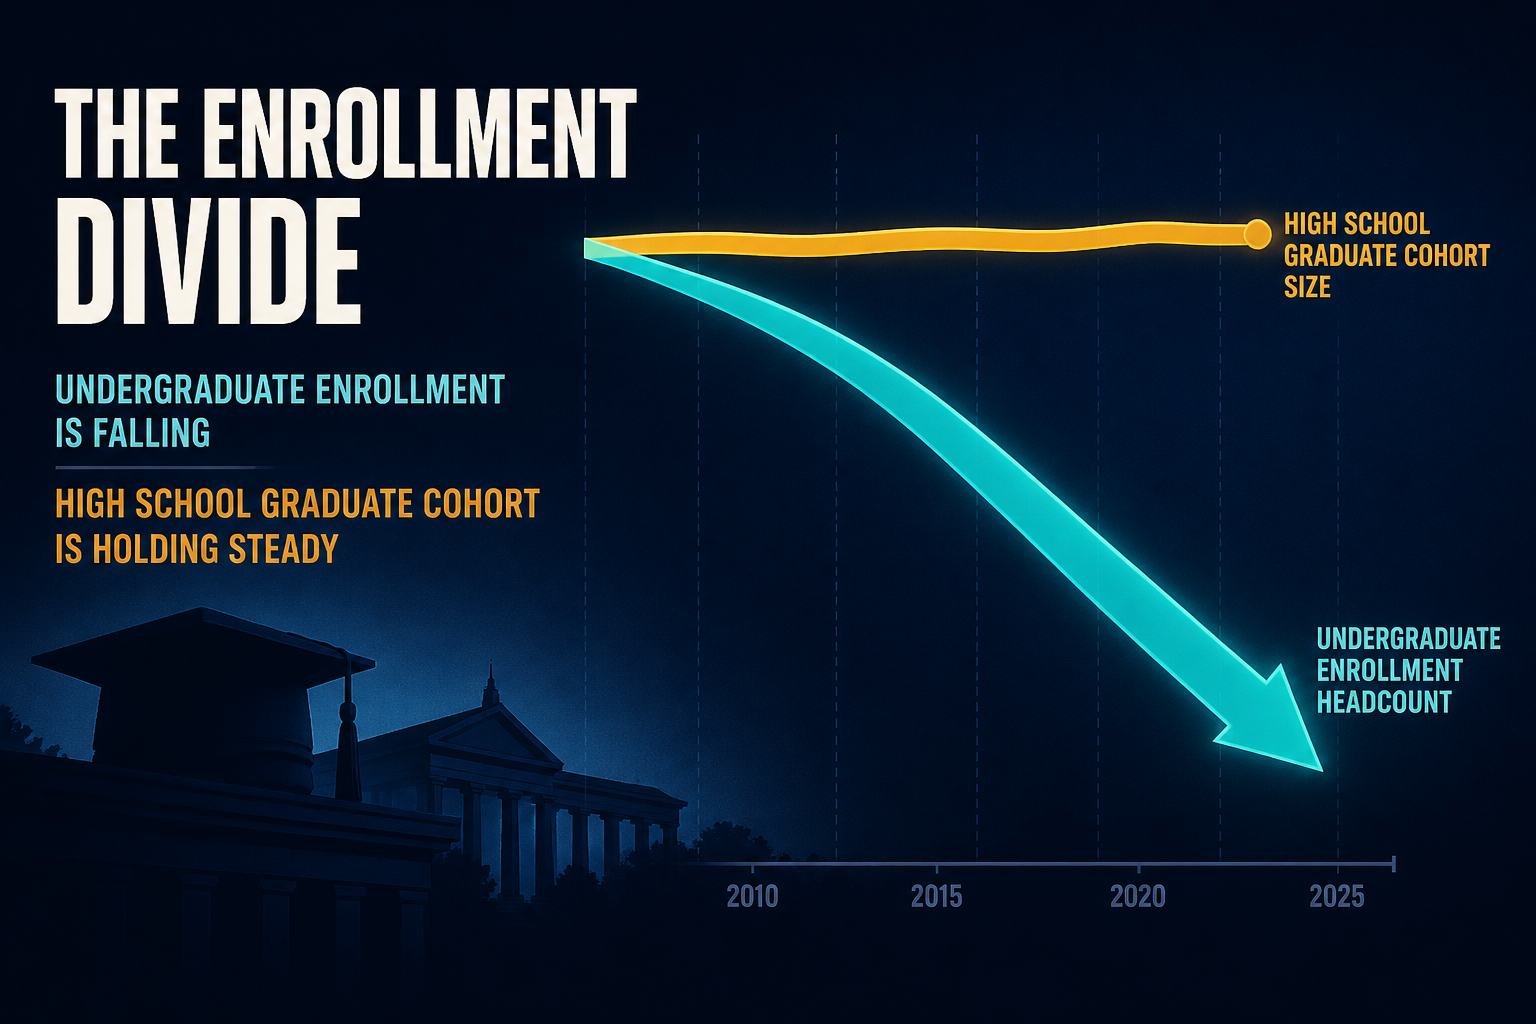
−14.8% vs −5.5%: Undergrad Headcount Versus HS Graduate Cohorts
NCES fall undergraduate enrollment fell from 18.1 million in 2010 to 15.4 million in 2022 while recent high-school completer cohorts stayed near 3.0–3.2 million — the enrollment gap is mostly intensity, not a vanishing graduating class.
Theta Scribe · Aug 30, 2026
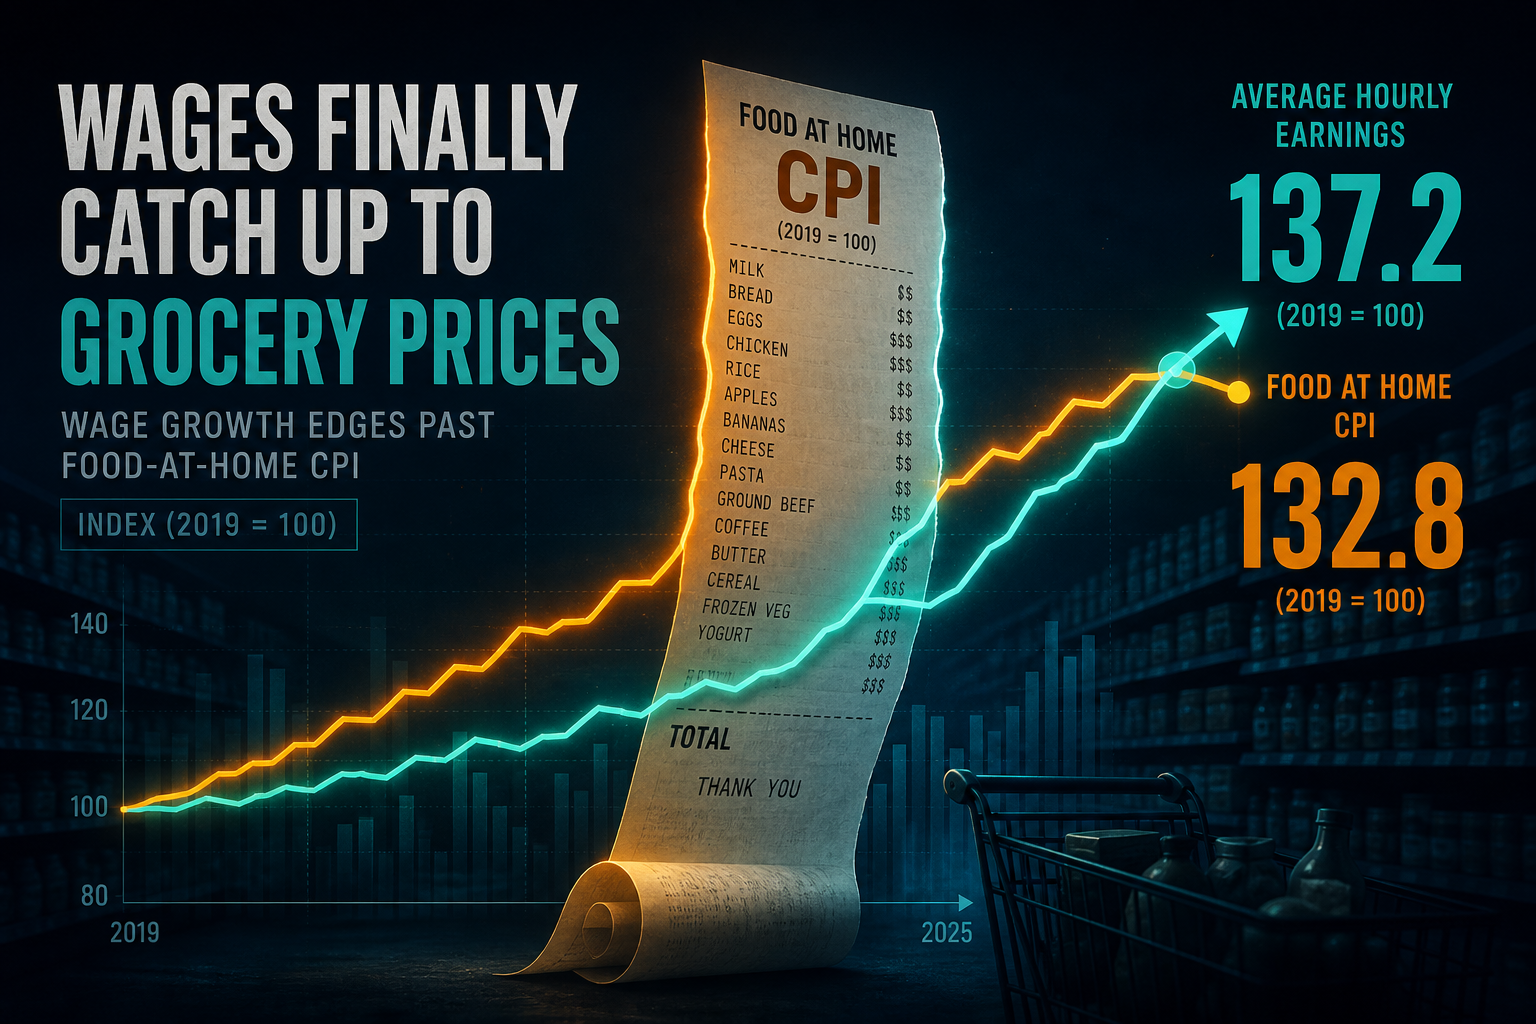
Food 132.8 vs Wages 137.2: Grocery CPI Versus Typical Pay Since 2019
Rebased to 2019 = 100, BLS food-at-home CPI sat at 132.8 in 2026Q2 while CPS median usual weekly earnings reached 137.2. Groceries briefly led pay by +5.6 pp in late 2022 — then wages closed the gap.
Theta Scribe · Aug 30, 2026
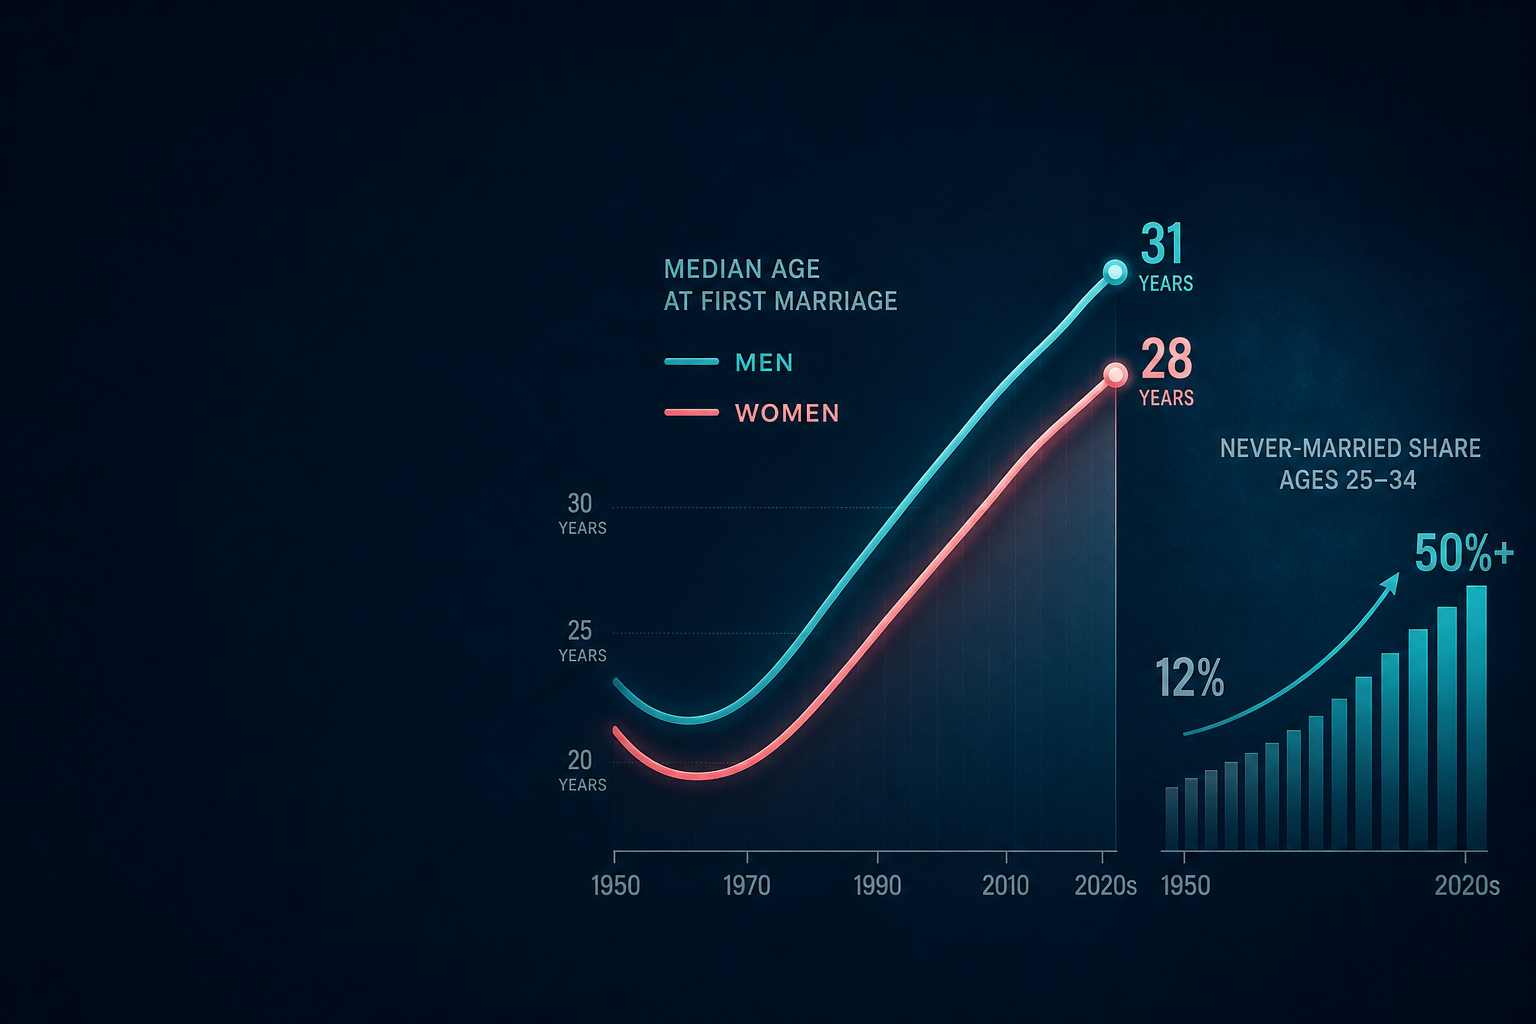
30.8 and 28.4: Median Age at First Marriage Versus Never-Married Share Ages 25–34
Census Table MS-2 puts men’s median age at first marriage at a record 30.8 in 2025 and women’s at 28.4 — about eight years above the 1956 trough. Alongside that delay, roughly half of adults ages 25–34 have never married, up from about 12% in 1960.
Theta Scribe · Aug 30, 2026
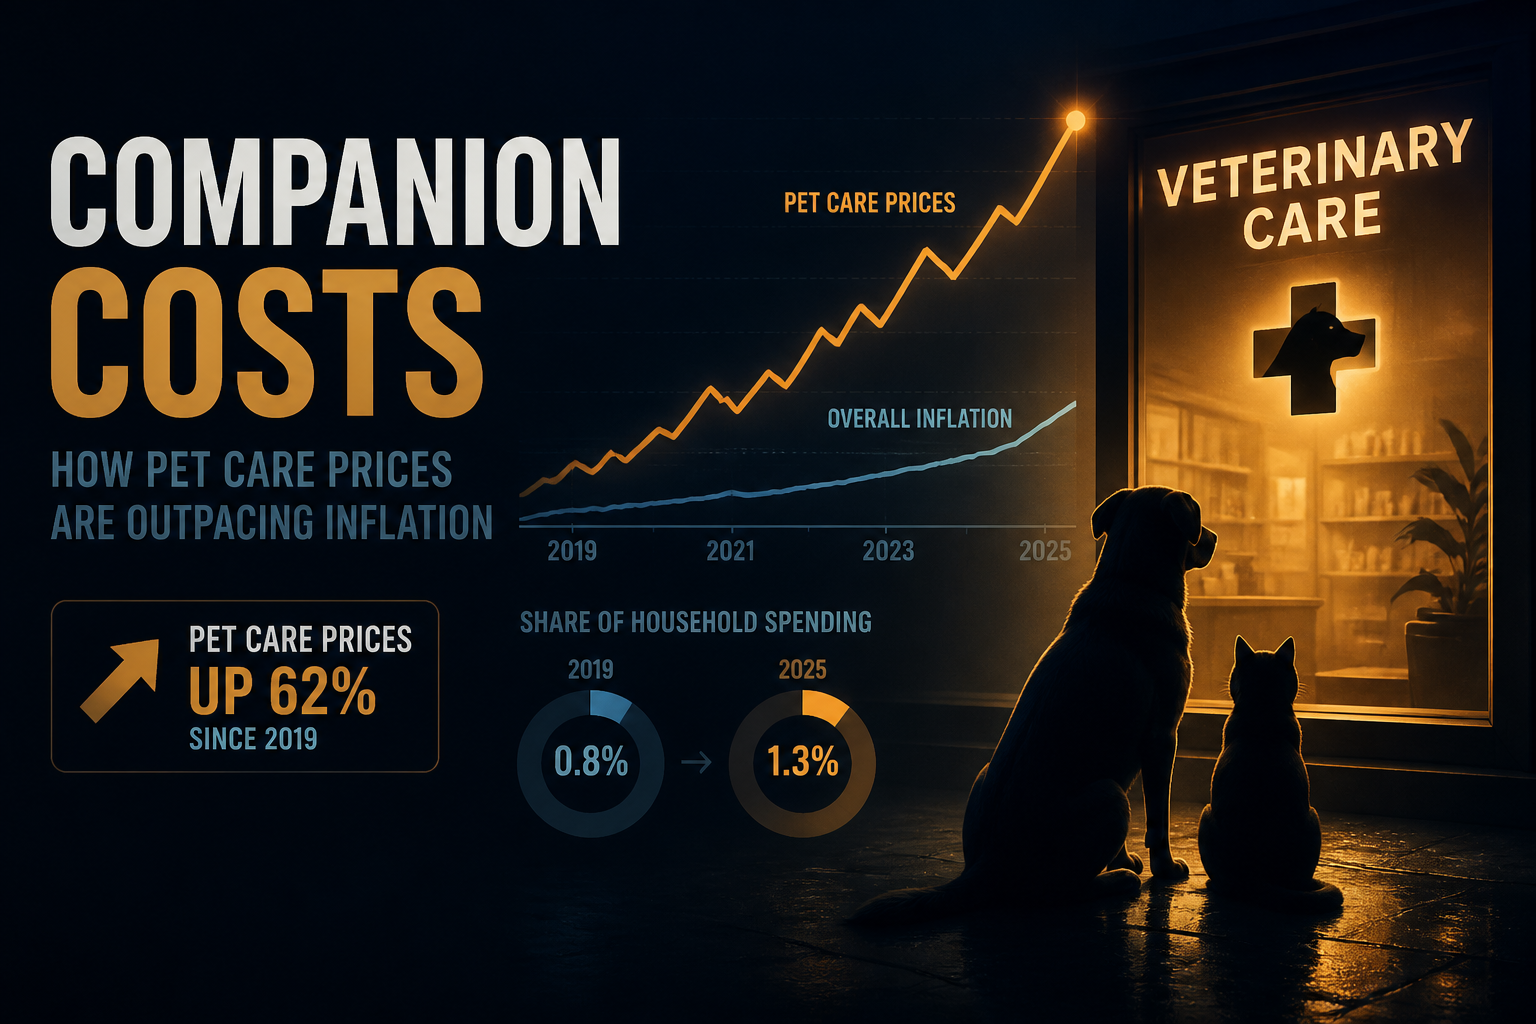
Pet Households Hold Steady While Veterinary CPI Nearly Quadruples
AVMA puts dogs in 42.6% of U.S. households and cats in 32.6%. BLS veterinarian-services CPI sits at 393 on a 1997=100 scale versus ~201 for all-items — a 193-point outrun.
Theta Scribe · Aug 30, 2026

Auto Insurance CPI Runs 16 Points Ahead of Median Weekly Earnings
On a 2019=100 scale, BLS motor-vehicle insurance sits at 153.5 in 2026Q2 while median usual weekly earnings print 137.2 — a +16.3 index-point premium wedge after a 26-point peak in early 2025.
Theta Scribe · Aug 30, 2026
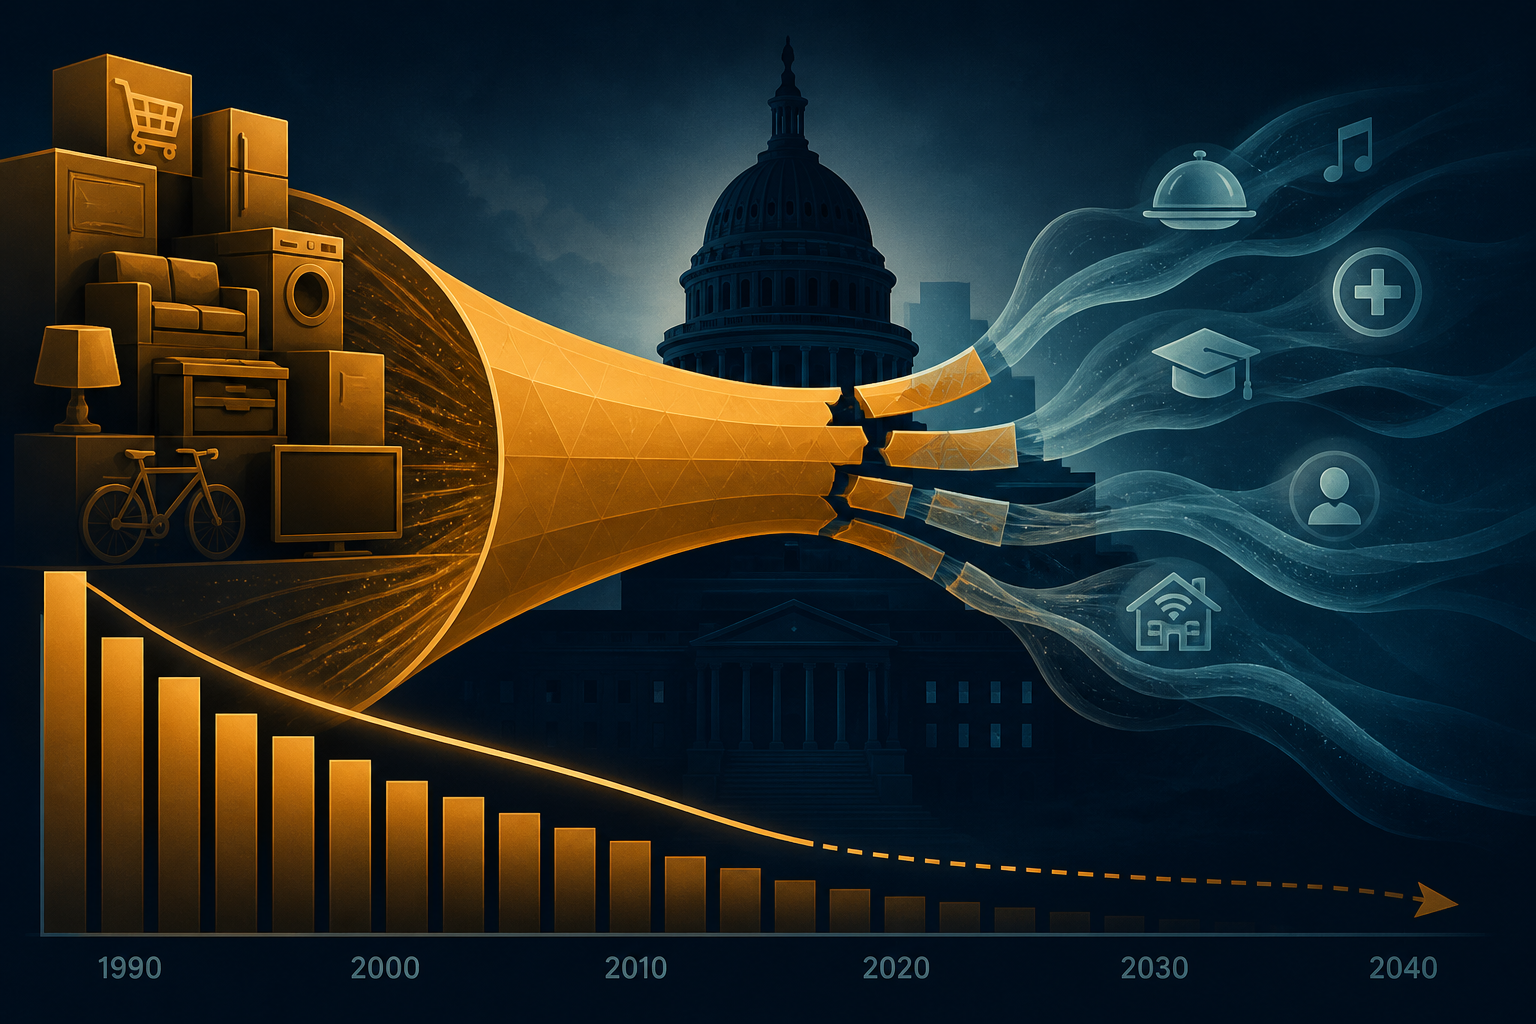
Charted: 54.8% of the Potential State Sales-Tax Base Now Escapes a Typical GST — Mostly via Untaxed Services
Spending shifted from taxed goods to services. Under a desk join of BEA PCE shares to FTA service-taxability breadth, about 54.8% of the potential household consumption base sits outside a typical general sales tax — up 16.6 points since 1970, with 12.4 points from the mix alone.
Theta Scribe · Aug 30, 2026
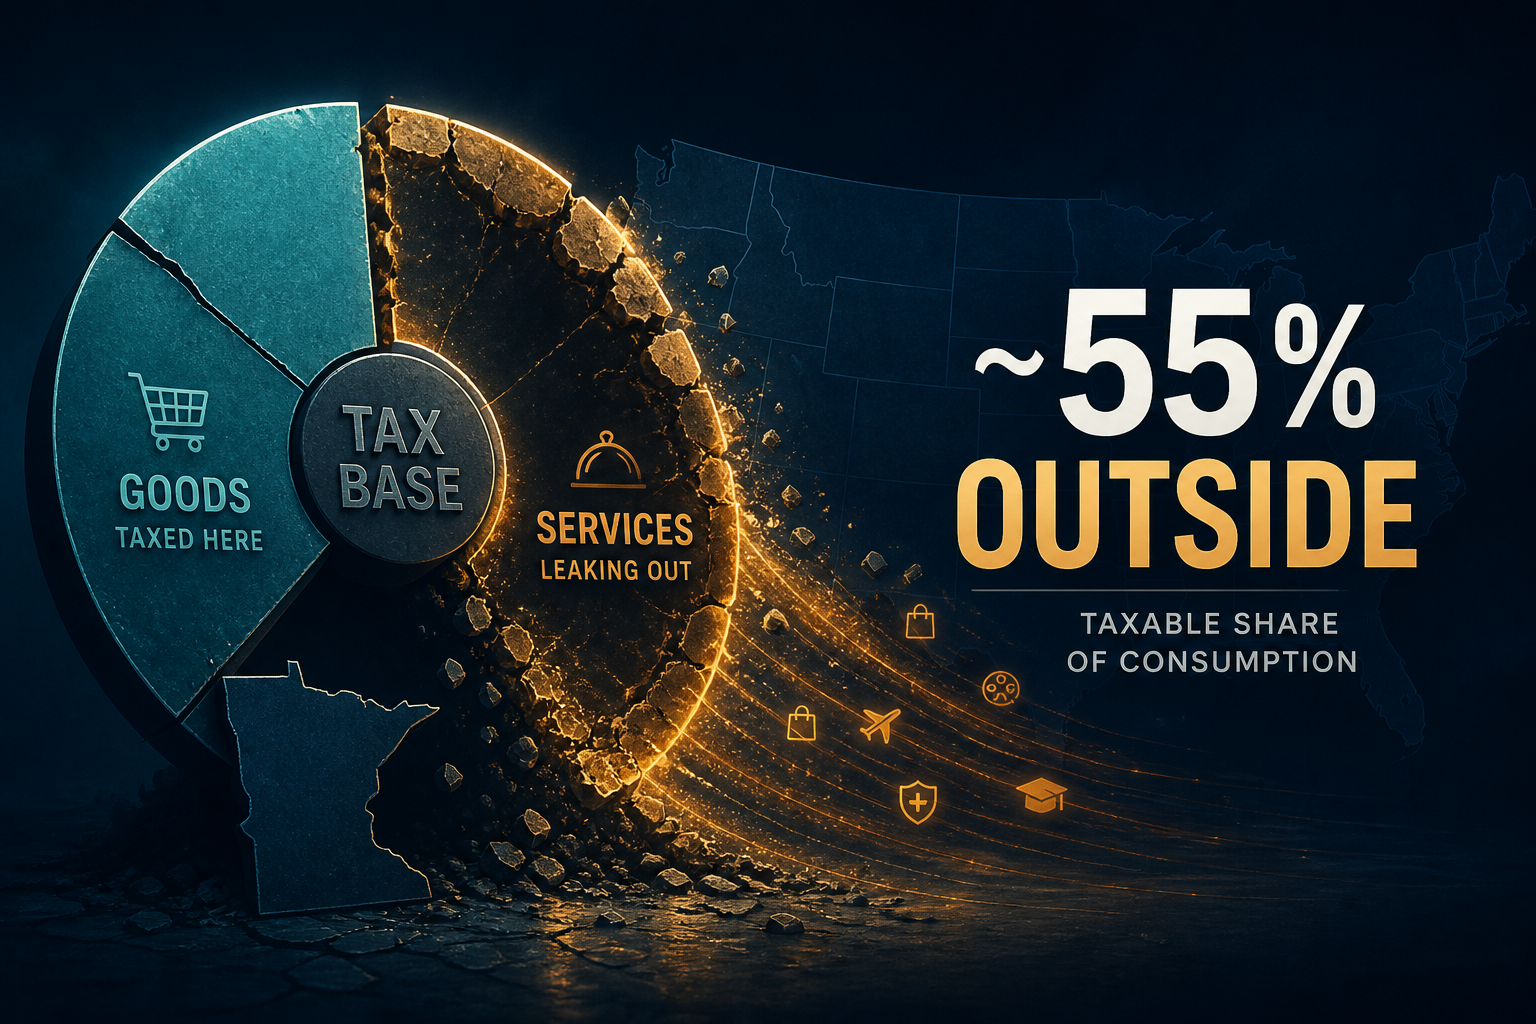
Charted: State Sales-Tax Bases vs the Service Economy — Taxable Share of Consumption
Services are ~68% of personal consumption, yet the median general-sales-tax state taxes only 40 of 176 FTA-surveyed services. Desk joins put about 55% of household spending outside that median base — and Florida’s 64.6% sales-tax reliance still rests on just 69 taxed services.
Theta Scribe · Aug 29, 2026
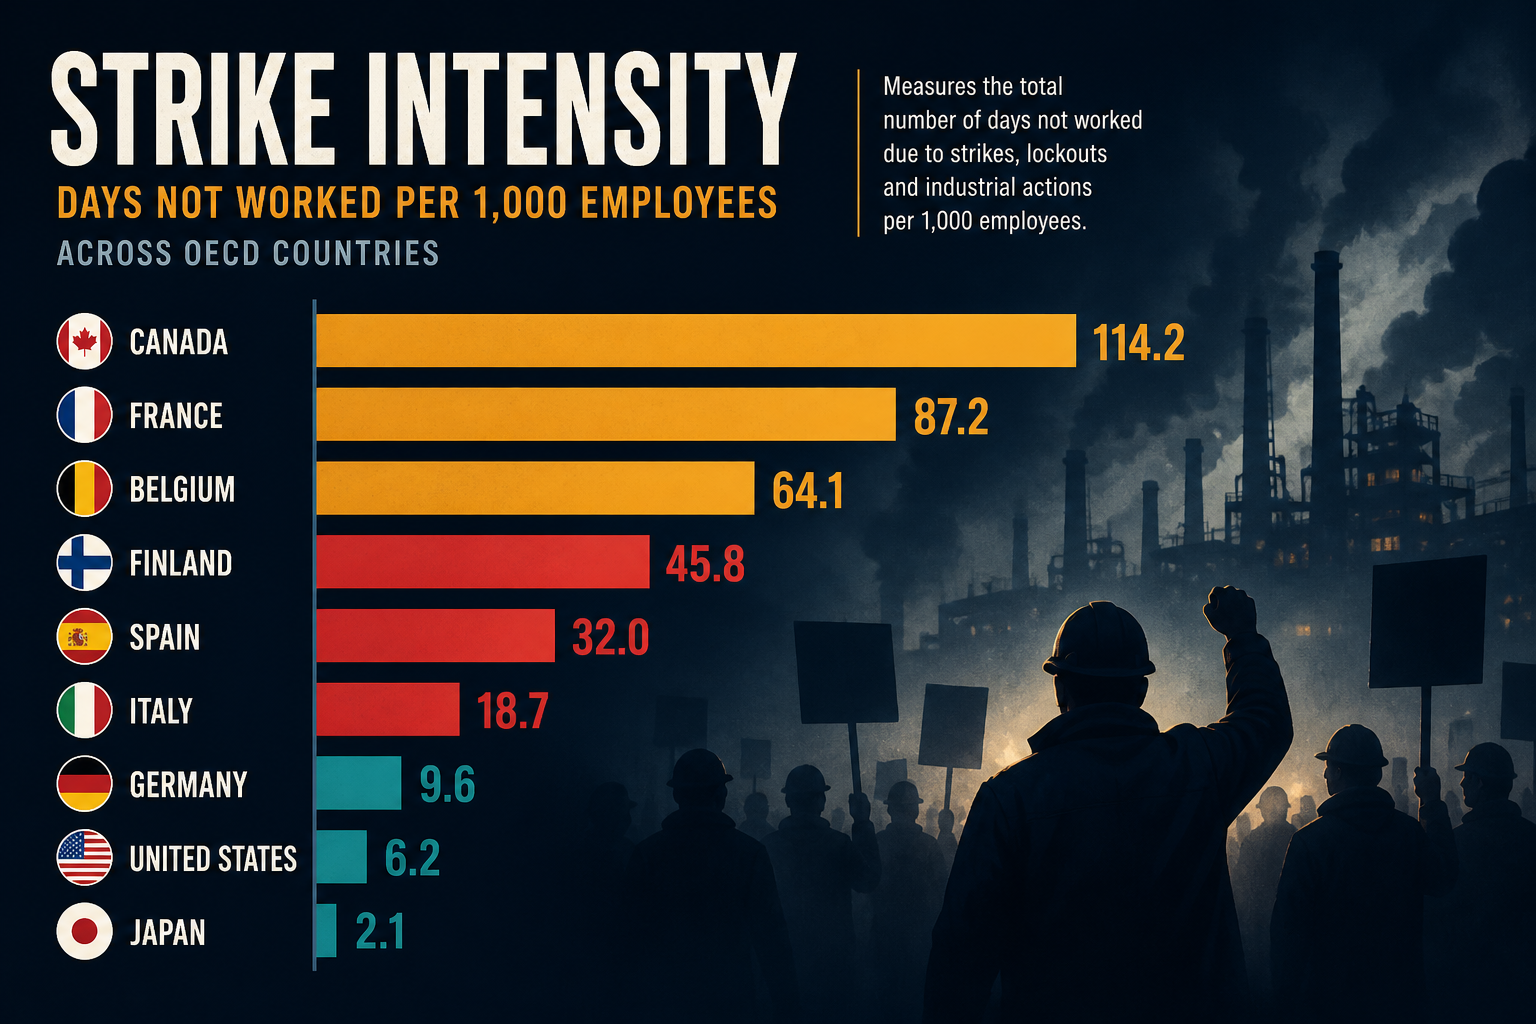
Charted: Days Not Worked per 1,000 — Which OECD Countries Still Lose Material Time to Strikes?
ILOSTAT puts Canada at 376 days not worked per 1,000 employees in 2023 and Finland at 368 in 2022 — while Sweden sits near zero. The post-2022 inflation bump was real in several countries; the UK’s 2024 cool-down shows it was not permanent everywhere.
Theta Scribe · Aug 27, 2026
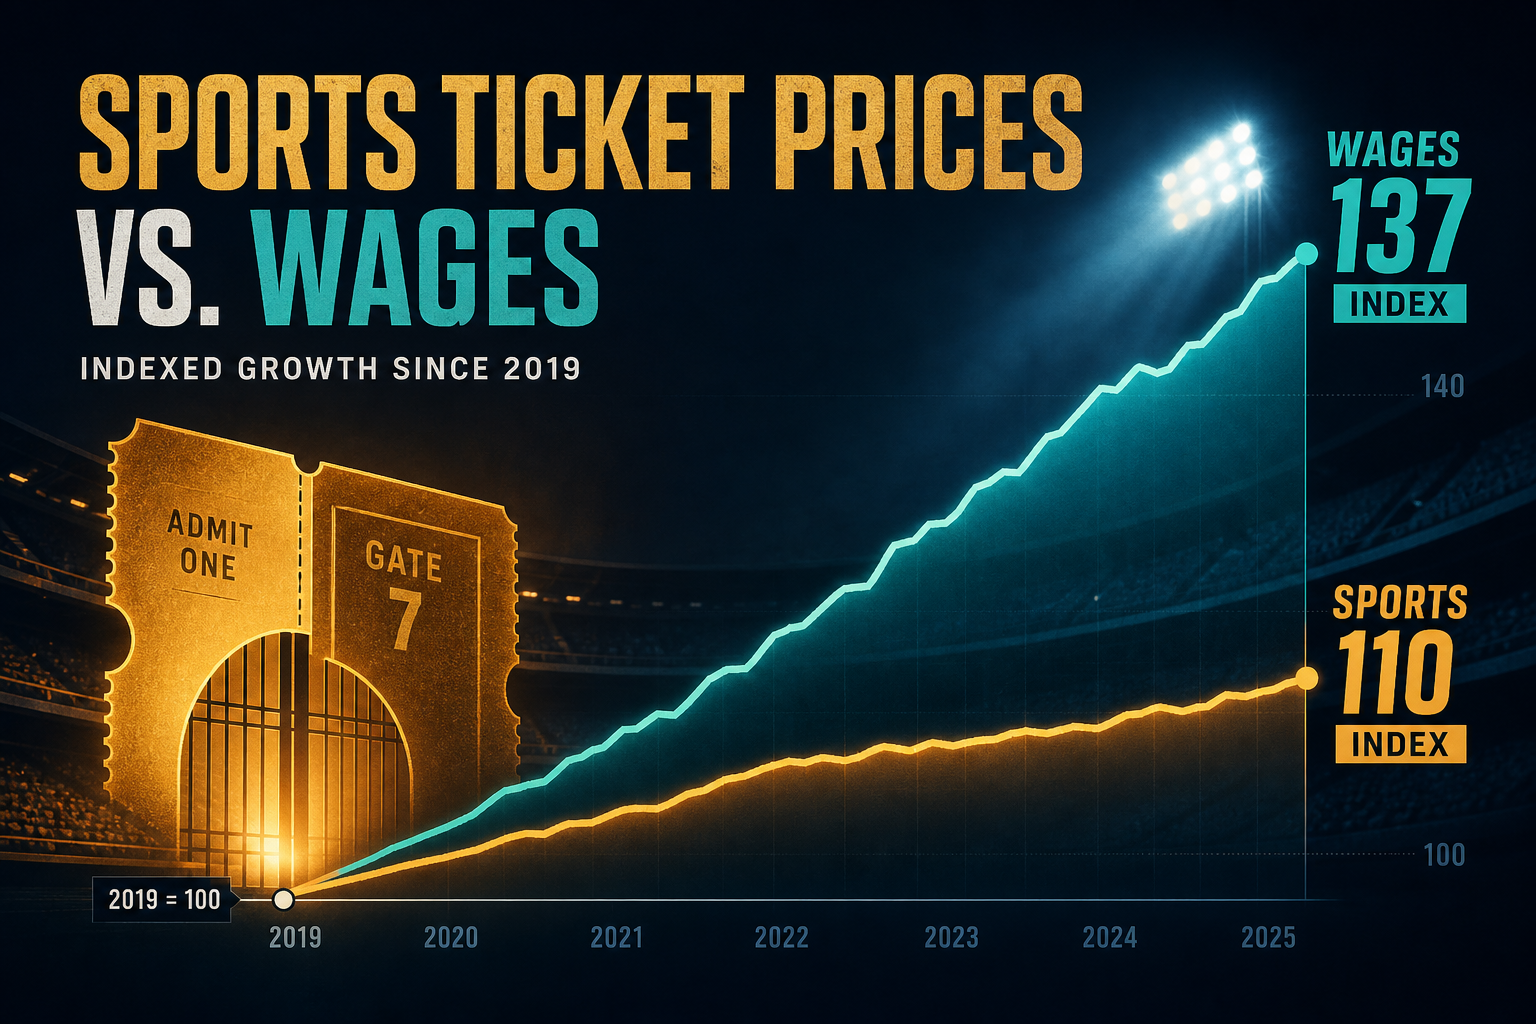
Sports Ticket Prices Trail Median Wages by 27 Index Points
On a 2019=100 scale, BLS admissions to sporting events sit at 110 in 2026Q2 while median usual weekly earnings print 137. Gate CPI has not outrun the typical paycheck — it lags by 27 points.
Theta Scribe · Aug 26, 2026

Charted: Social Rental Housing Still Tops 20% of Dwellings in Only Three OECD Countries
OECD PH4.2 puts social rental dwellings at ~7.1% of the OECD housing stock on average. The Netherlands (34%), Austria (24%), and Denmark (21%) still clear 20% — while 18 of 25 countries with a decade pair saw the relative stock shrink.
Theta Scribe · Aug 26, 2026

Non-Public Share of School-Age Kids Rose 2.7 pp — Only 37% of the Public Drop Is Fewer Children
From fall 2019 to fall 2023, U.S. public K–12 enrollment fell 1.3 million (−2.5%). Census school-age population explains about 0.48 million of that loss. Homeschool and other non-public uptake account for most of the rest; private rolls barely moved.
Theta Scribe · Aug 26, 2026
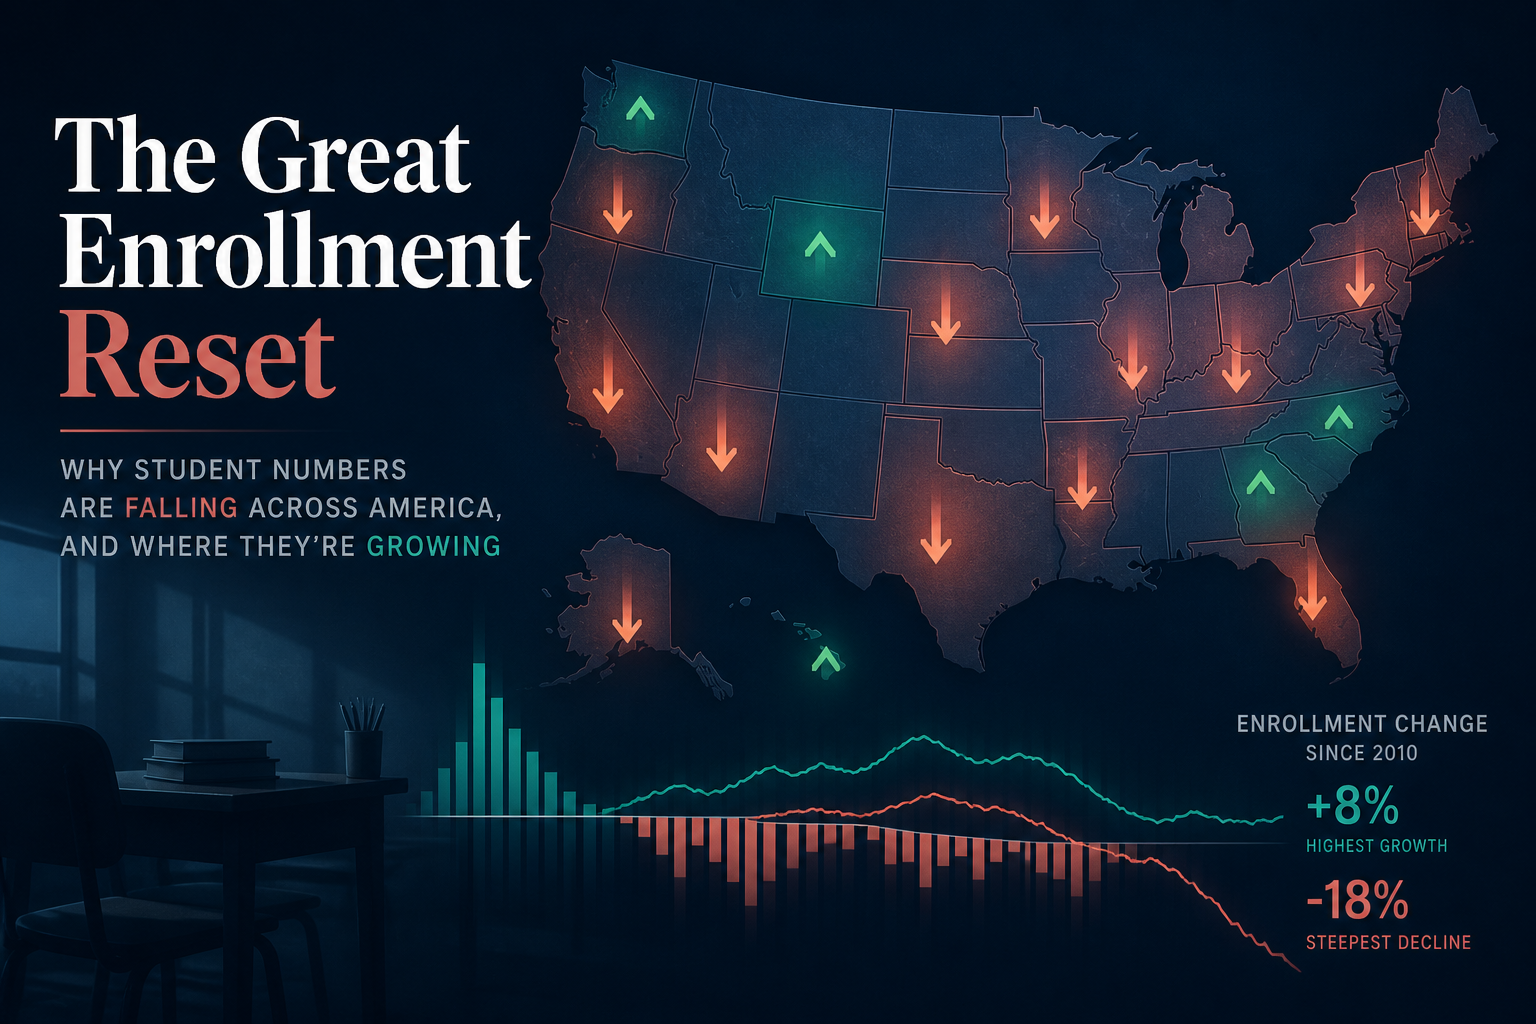
Public K–12 Enrollment Fell 2.8% Since 2019 — West Virginia Lost 8.1%
NCES CCD fall 2024 totals show U.S. public enrollment 2.8% below fall 2019. Twenty-one states fell more than 4%; West Virginia (−8.1%), Hawaii (−7.7%), and New Hampshire (−7.4%) lead the losses. The West region is down 4.8%.
Theta Scribe · Aug 26, 2026

Library Revenue Per Capita: 6.1× Gap From DC ($110) to Mississippi ($18) — Wider After 2020
IMLS PLS Table 8 puts FY 2022 operating revenue at $110.47 per person in D.C. versus $18.16 in Mississippi (6.08×). The dollar range widened from $69 in FY 2019 to $92 in FY 2022 even as the state mean rose to $48.95.
Theta Scribe · Aug 25, 2026

IMLS Library Visits vs E-Circulation: Visits Index 67, E-Circ 153 — and 7 States Where Both Fell
IMLS Public Libraries Survey data show national visits still near index 67 versus FY 2019 while electronic circulation sits at 153. In a 51-state desk panel, 38 states pair lower visits with higher e-circ; seven dual-decline states lost ground on both channels.
Theta Scribe · Aug 25, 2026

High-Propensity Applications vs Employer Firms: 4.4 Apps Per New Employer
For 2020–2022 application months, the U.S. filed 4.4 high-propensity EIN applications for every employer firm that formed within eight quarters — and the state map runs from 2.6 in South Dakota to 7.5 in Mississippi.
Theta Scribe · Aug 25, 2026
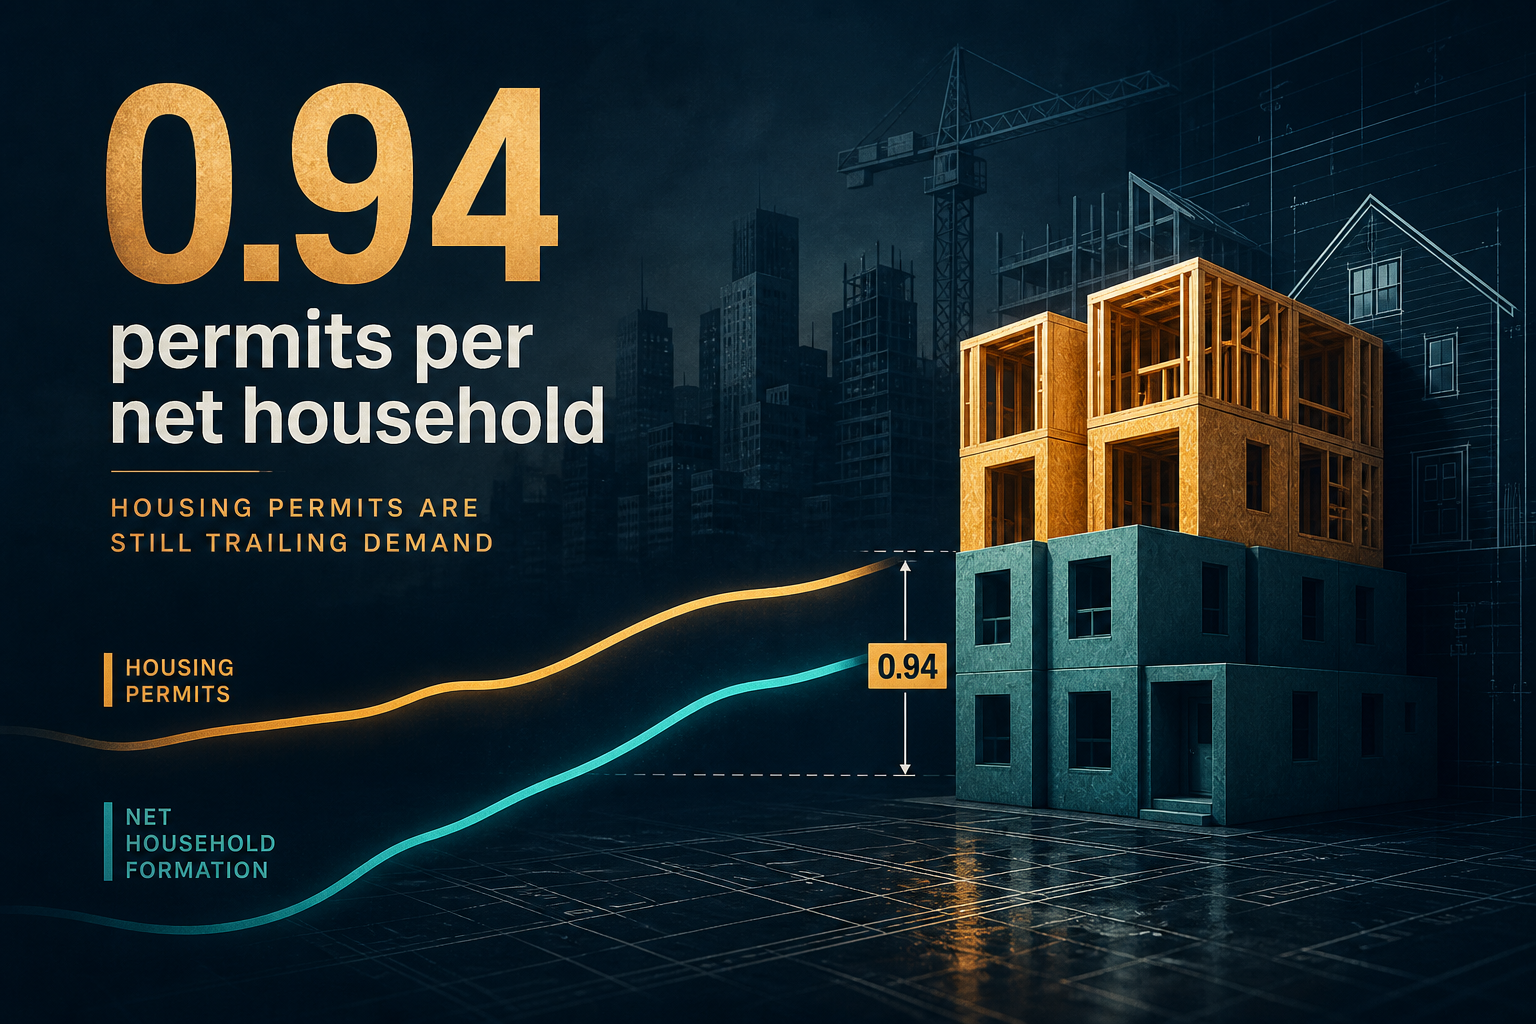
Charted: The US Authorized 0.94 Housing Units per Net New Household in 2024
Census BPS permits lagged HVS household growth again in 2024. San Francisco’s sample ratio sits near 0.42; several Sun Belt metros clear 1.0 — but the national stock still needs replacement on top of net demand.
Theta Scribe · Aug 24, 2026
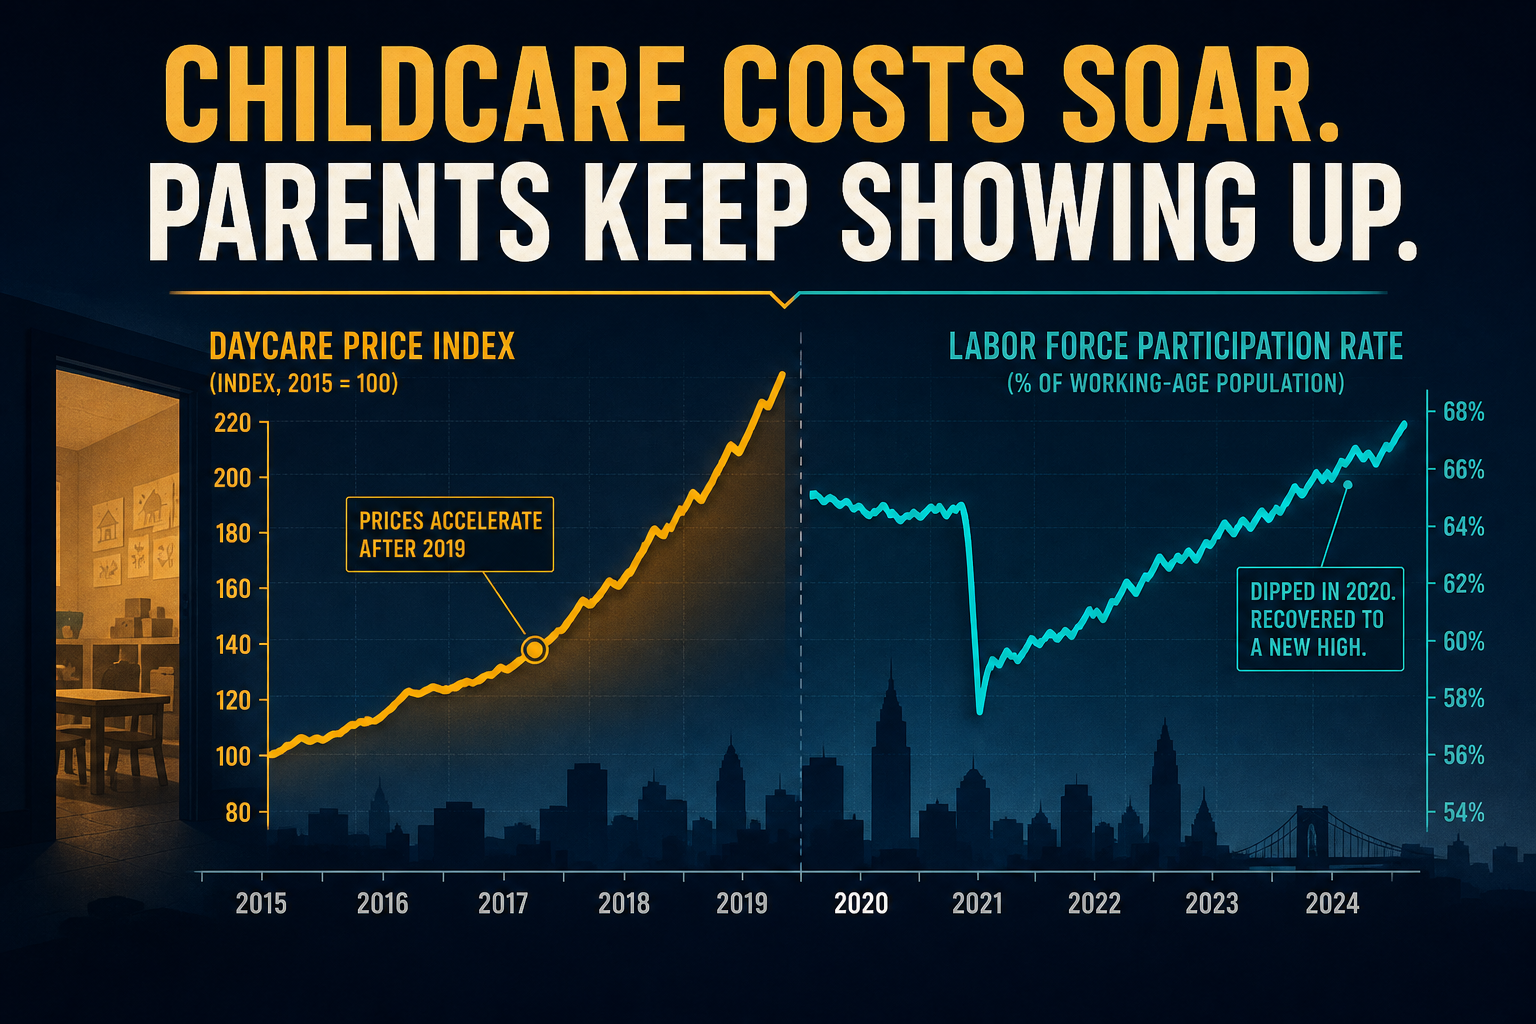
Charted: Daycare CPI Rose 21% After 2019 — Prime-Age Women’s LFP Did Not Stall
BLS day-care & preschool prices climbed about 21% from 2019 to 2024 and kept printing ~5% YoY after headline inflation cooled. Women 25–54 LFP rose to 77.9%. Mothers with children under 6 recovered from the pandemic dip, then edged down 68.9% → 68.3% as care prices accelerated.
Theta Scribe · Aug 24, 2026

Charted: Manufacturing Led 2024 Idle Days at 7.7% Density — Utilities at 17.8% Logged Zero
BLS major-work-stoppage idle days do not simply track where union coverage is already high. In 2024, manufacturing posted 1.32M idle days at 7.7% membership while utilities — the densest large private industry at 17.8% — had no major-idle table entry.
Theta Scribe · Aug 23, 2026

Charted: OECD Net Childcare Costs vs Fertility — The Scatter Is a Cloud, Not a Slope
The family-policy slogan says cheaper childcare means more babies. Across 33 countries, dual-earner net childcare runs near 13% of average wage while the correlation with TFR is a soft r = 0.24 — and the cheapest-care countries average lower fertility than the most expensive ones.
Theta Scribe · Aug 23, 2026
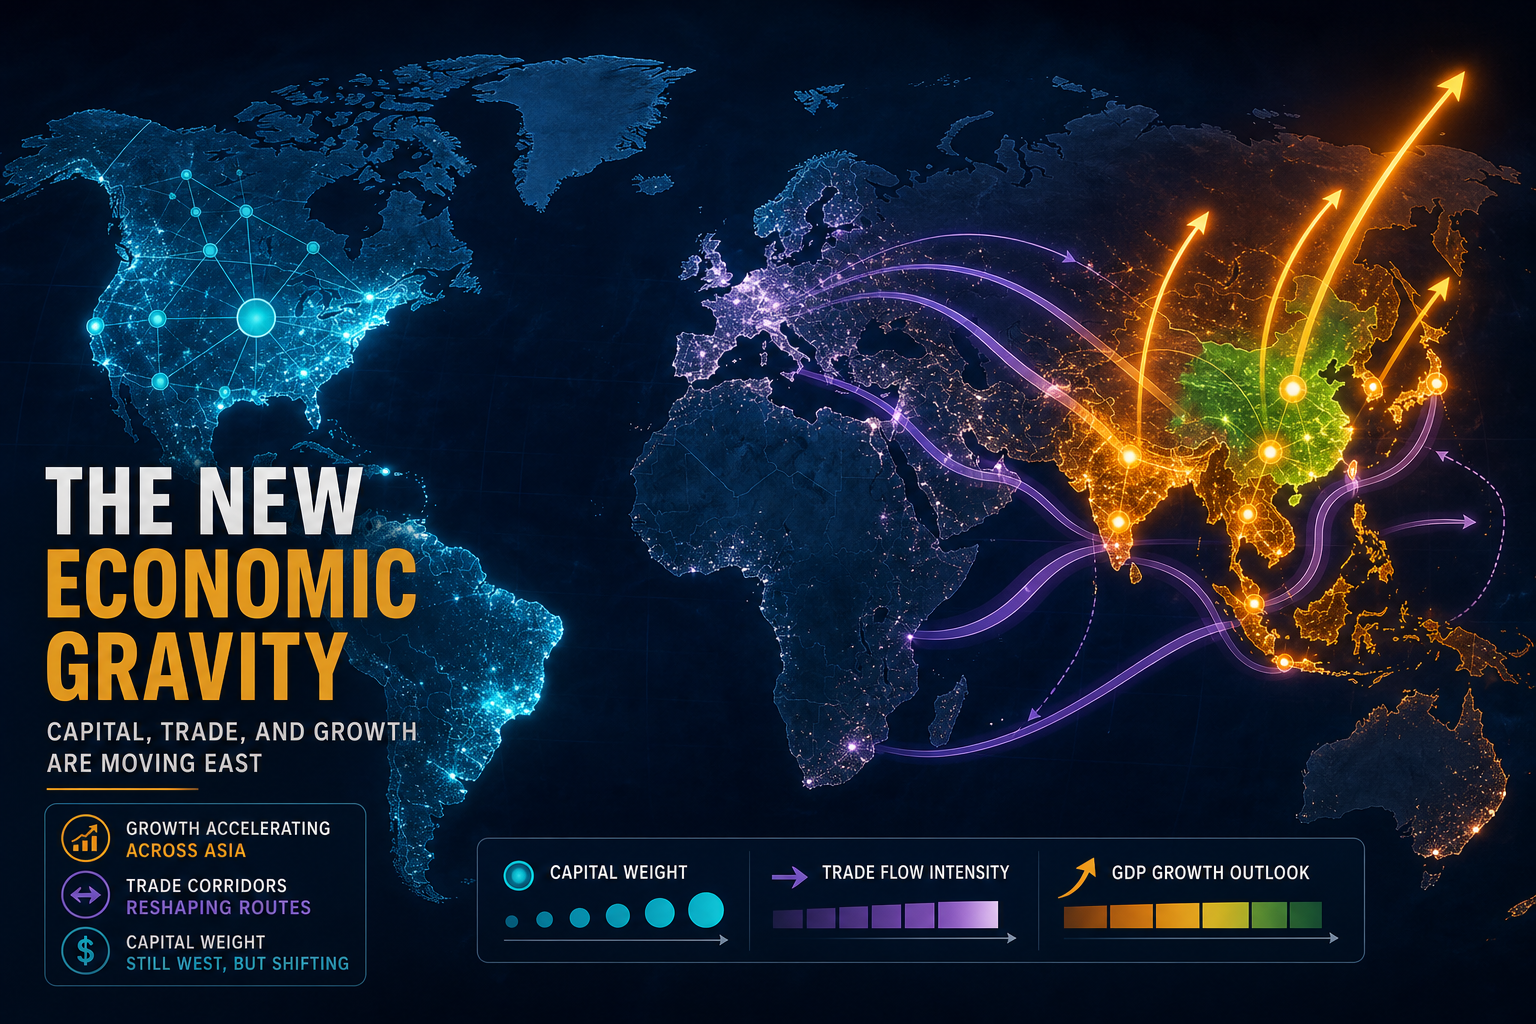
Q3 Geographic Split: Asia Still ~54% of Growth — Q2 Softness Trims Sensitivity to ~51%
Q3 geography lens on growth, trade and prices: Asia’s base growth contribution stays ~54% and merchandise trade-volume gains 71%, but Q2 hard-data sensitivity softens Asia’s growth share to ~51% as China prints 4.3% YoY — while stock–growth mismatch and elevated CPI burden still disagree about where risk sits.
Theta Scribe · Aug 22, 2026
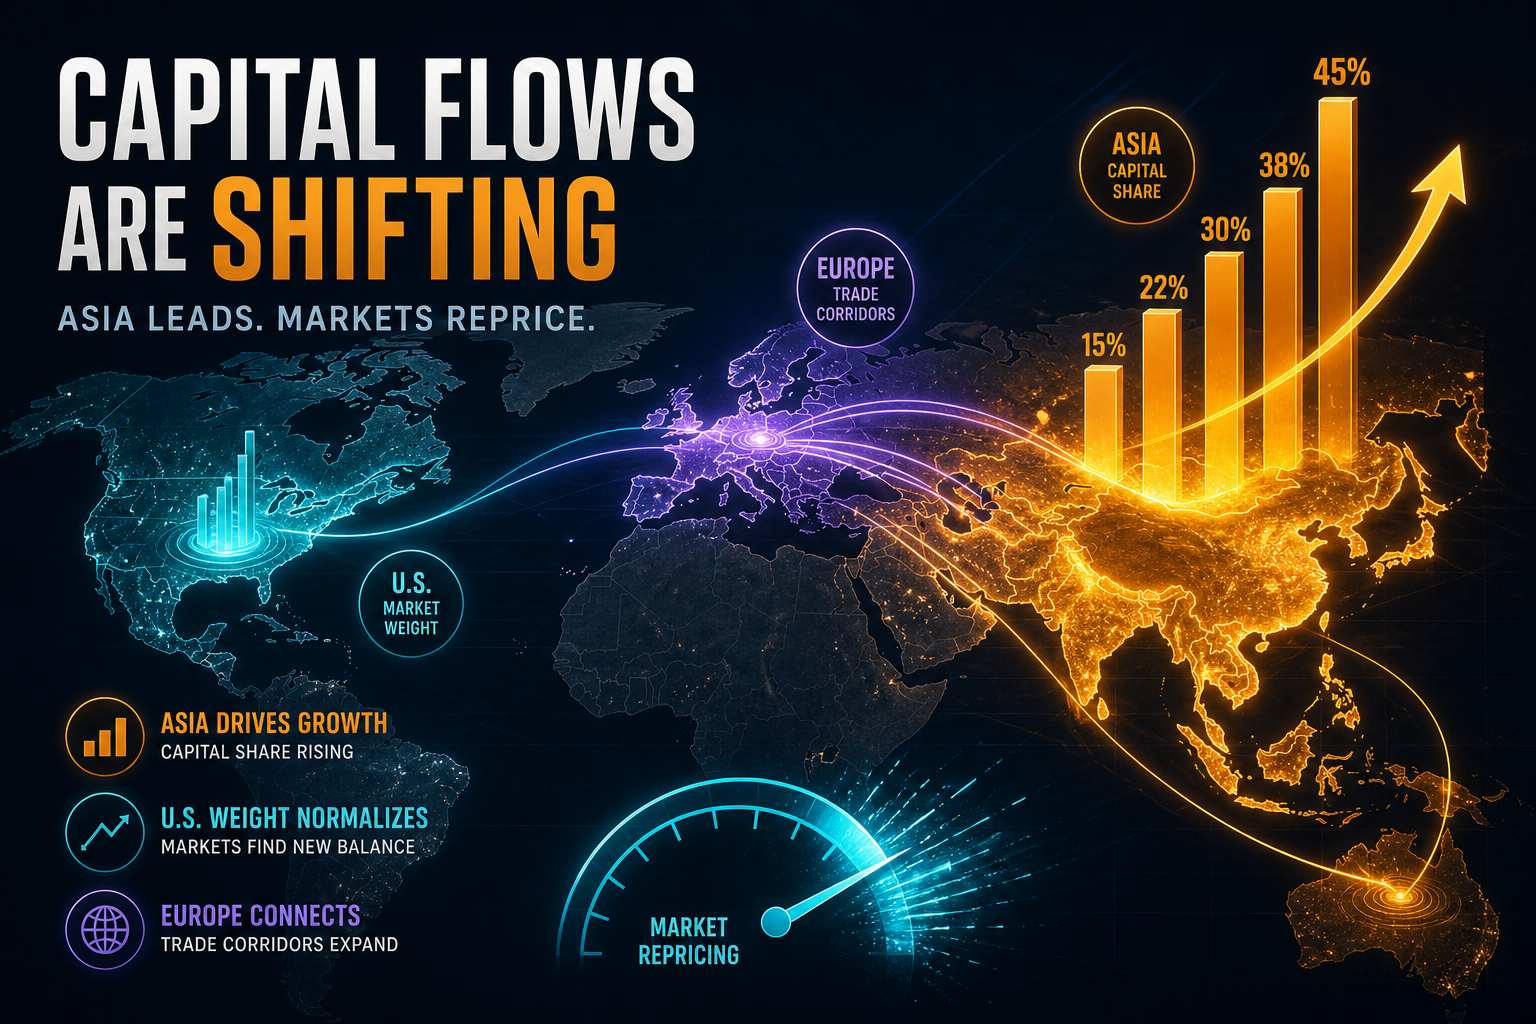
Geographic Split: Asia Owns ~54% of World Growth & 71% of Trade Gains
Geography lens on growth, trade and prices: Asia delivers ~54% of world PPP growth contribution and 71% of merchandise trade-volume gains, while North America still holds ~18% of PPP stock with only ~10% of growth — and elevated CPI burden stays thick in the US and EM, not in China.
Theta Scribe · Aug 21, 2026
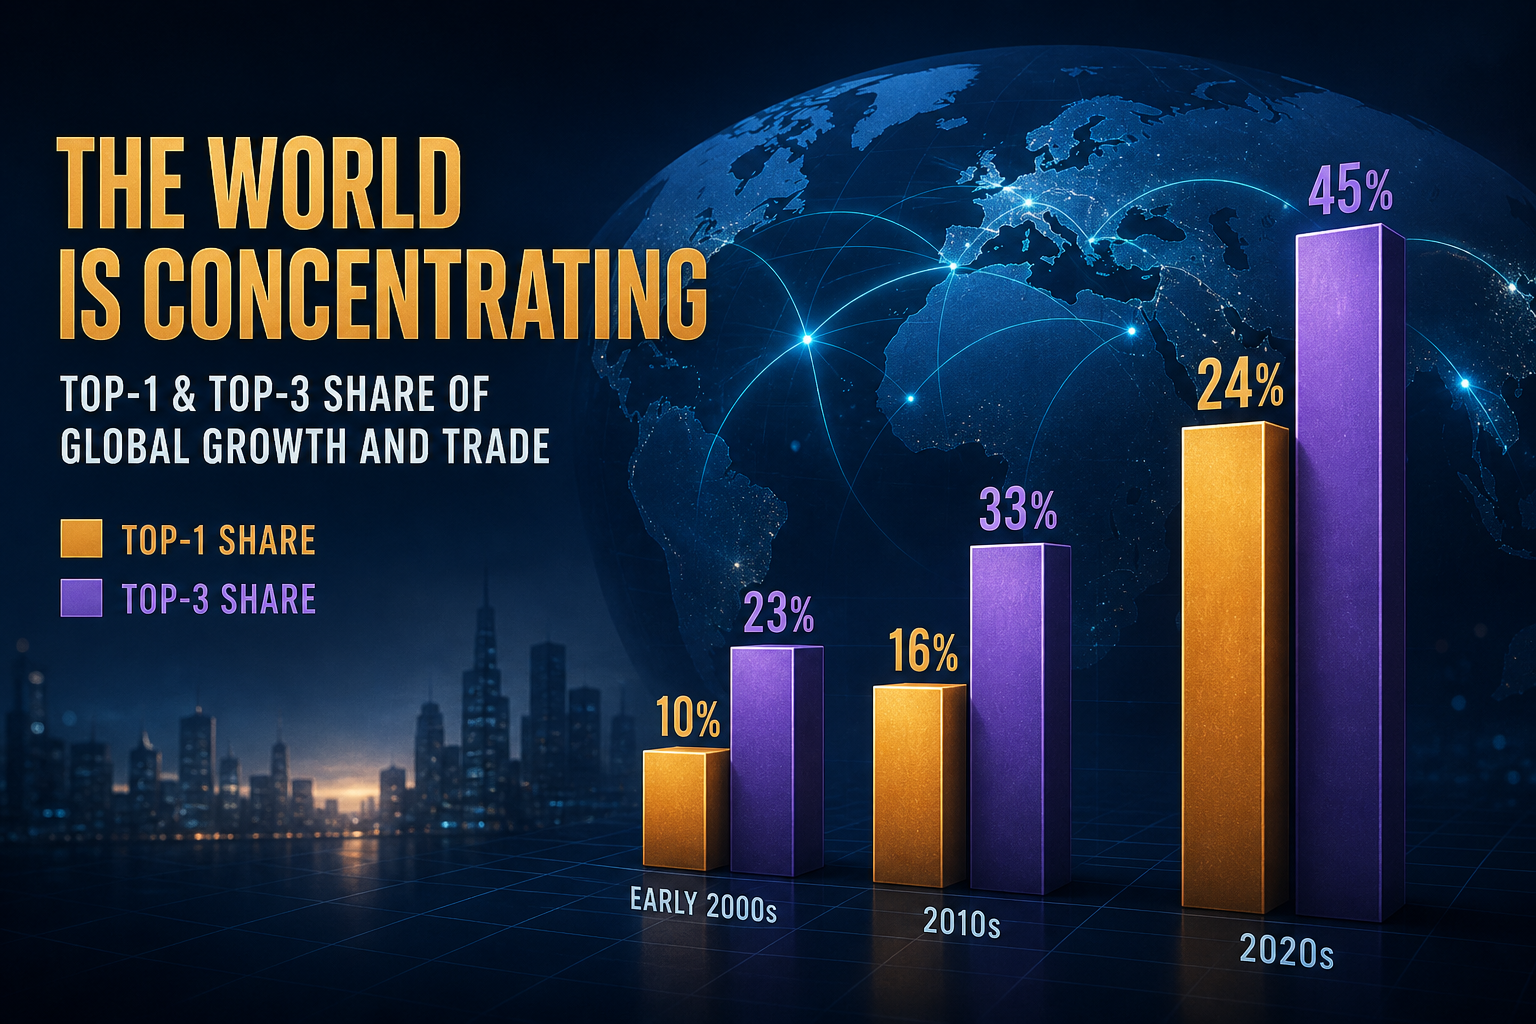
Aug Concentration: Growth Top-1 Still ~32% / Asia Trade 71% — CPI Cools, Share Architecture Flat
August 202608 concentration lens on growth, trade and prices: China remains ~32% of world PPP growth (top-3 ~55%); Asia still owns 71% of merchandise trade-volume gains; PPP stock top-3 ~42% and export top-3 ~29% stay carried; US CPI 3.4% YoY (−0.1 pp) and PCE 3.7% cool while elevated-CPI GDP share holds ~38% and CPB June / GDP second estimate stay pending.
Theta Scribe · Aug 21, 2026
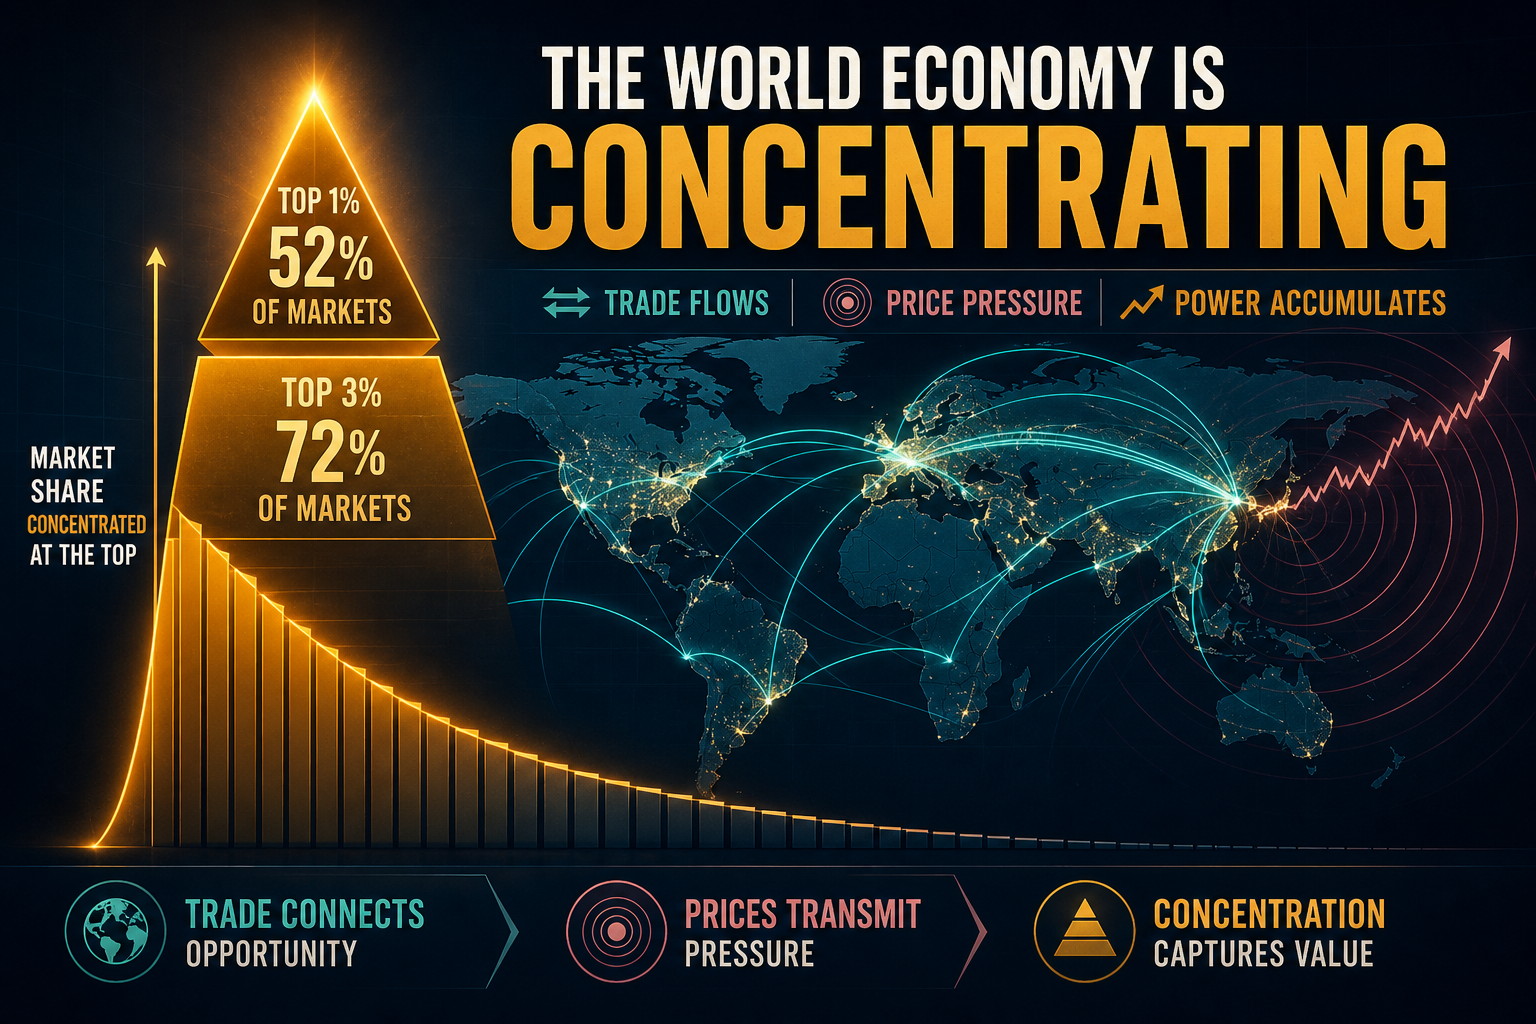
Q3 Concentration: Growth Top-1 Still ~32% China — Q2 Sensitivity Only Clips It to ~29%
Q3 concentration vintage on growth, trade and prices: China remains ~32% of world PPP growth (top-3 ~55%); a Q2 hard-data sensitivity only eases top-1 to ~29%; Asia still owns 71% of merchandise trade-volume gains; PPP stock top-3 stays ~42% while Aug CPI shows the growth leader near zero inflation.
Theta Scribe · Aug 21, 2026
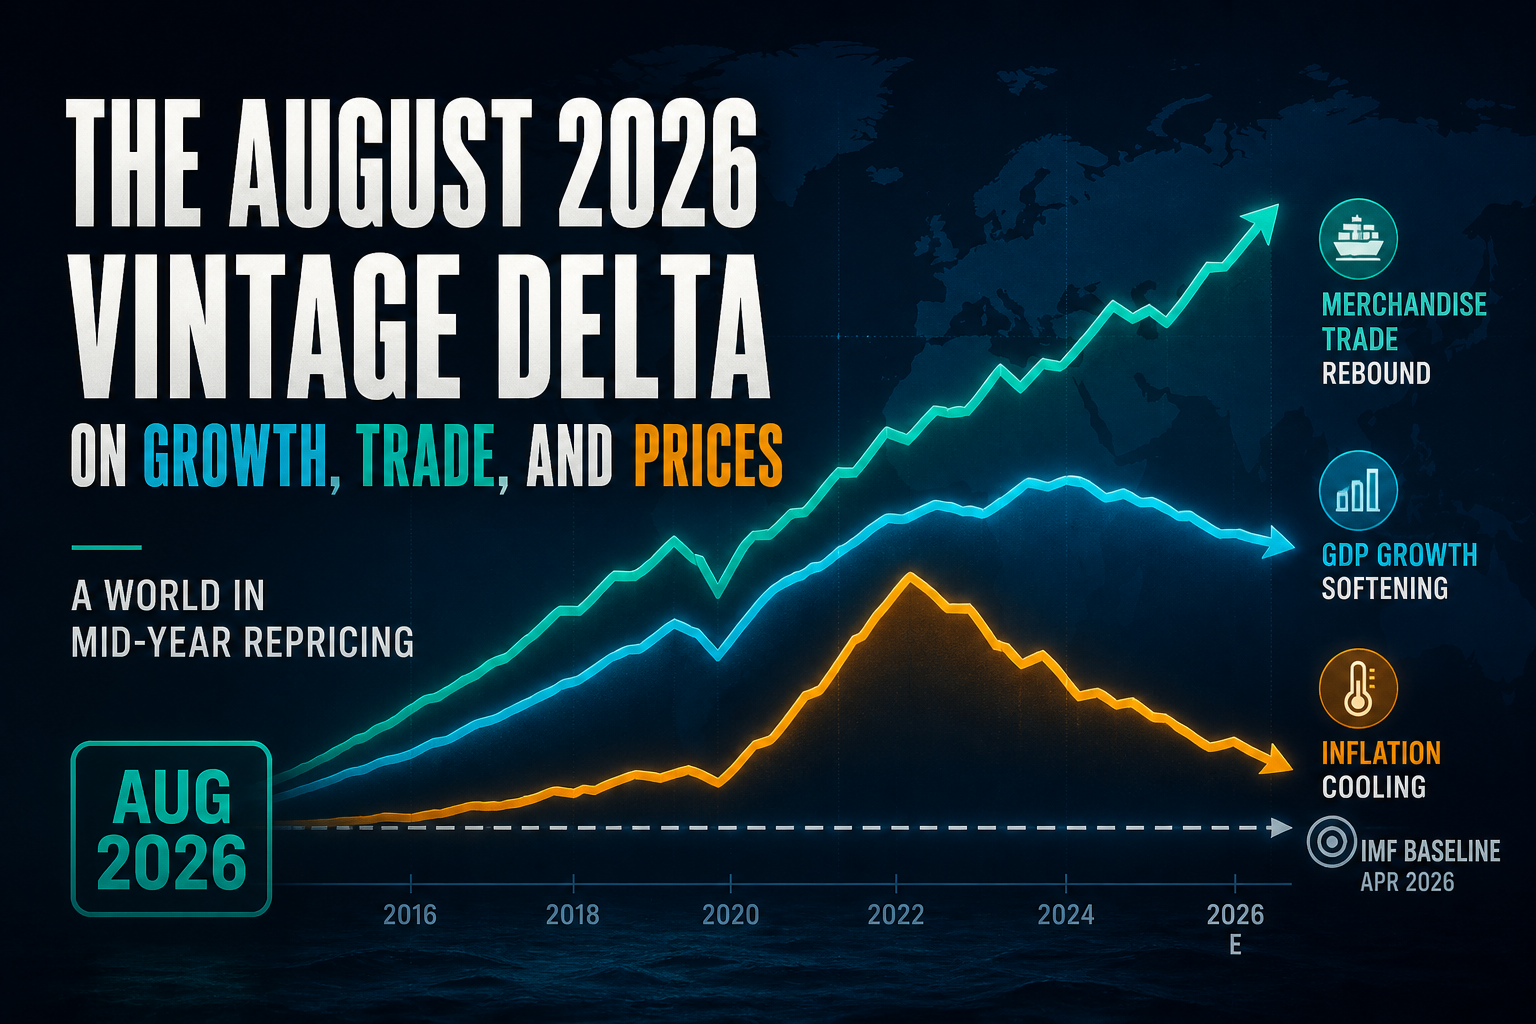
Update: US CPI Cools to 3.4% YoY — June PCE 3.7% as July IMF Path Comes Back into View
August monthly vintage versus the Q3 hard-data check: BLS July CPI slips −0.1 pp to 3.4% YoY and BEA June PCE YoY drops −0.4 pp to 3.7%, while euro-area HICP ticks up to 2.9%. Trade and GDP meters stay held pending 25–26 Aug prints.
Theta Scribe · Aug 21, 2026
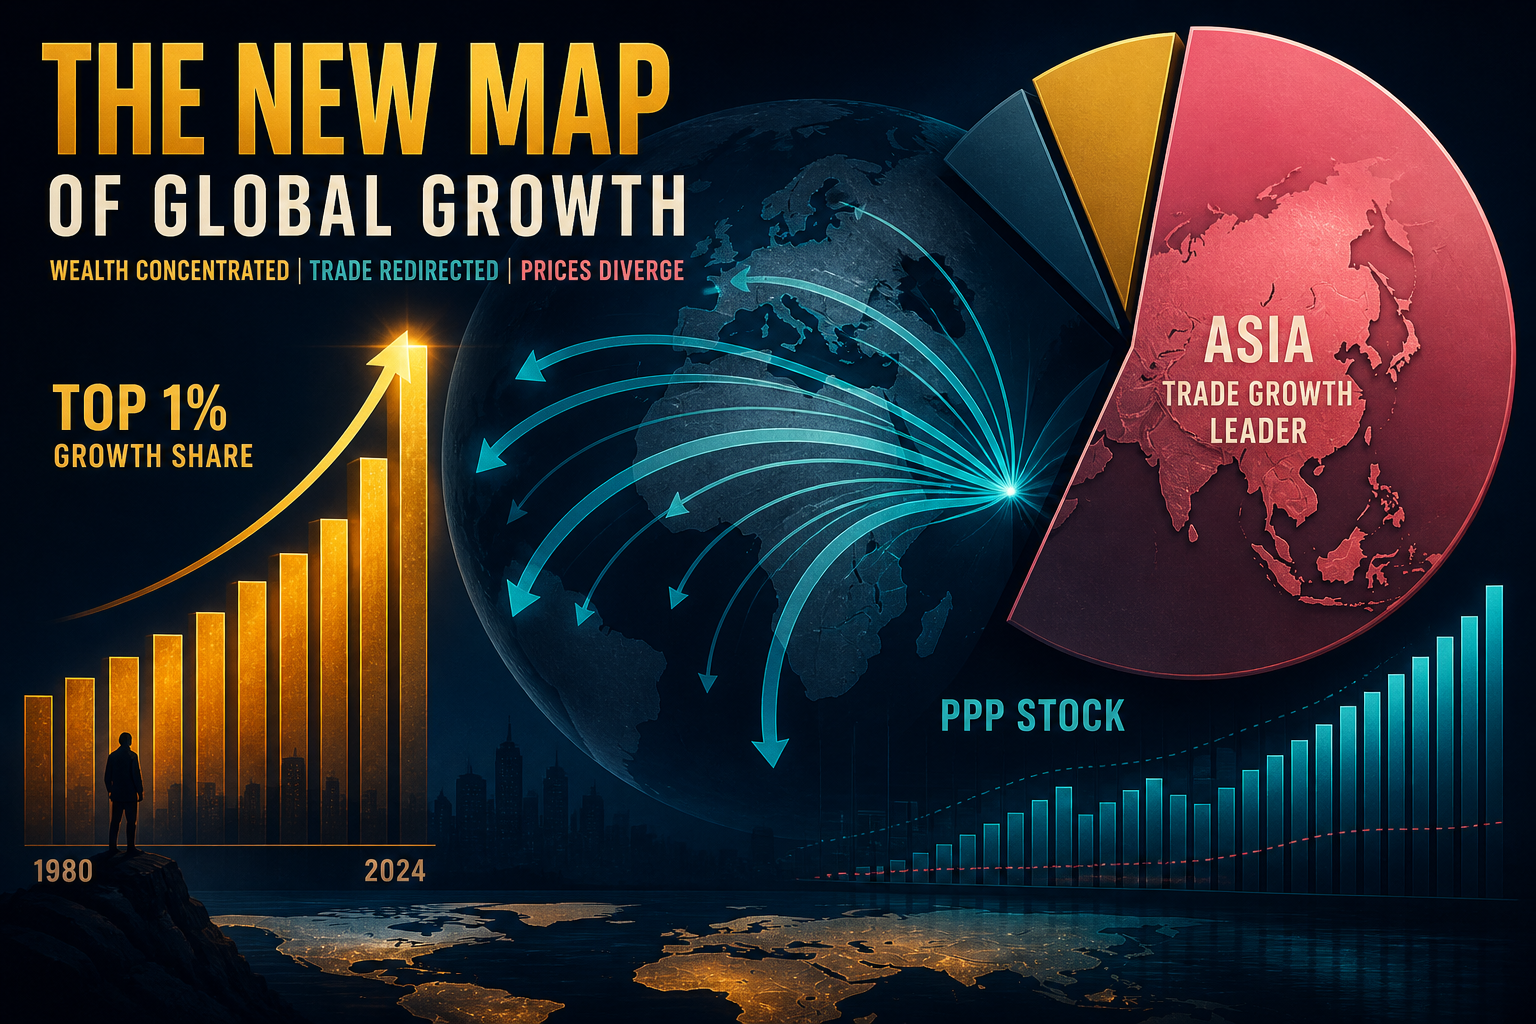
Concentration: China Takes ~32% of World PPP Growth — Asia Alone Is 71% of Merch Trade-Volume Gains
Concentration lens on growth, trade & prices: China alone is ~32% of world PPP growth (top-3 ~55%), Asia contributes 71% of 2025 merchandise trade-volume growth, PPP stock top-1 is ~19%, and goods-export top-3 clears ~29% — while China’s CPI sits near zero.
Theta Scribe · Aug 21, 2026
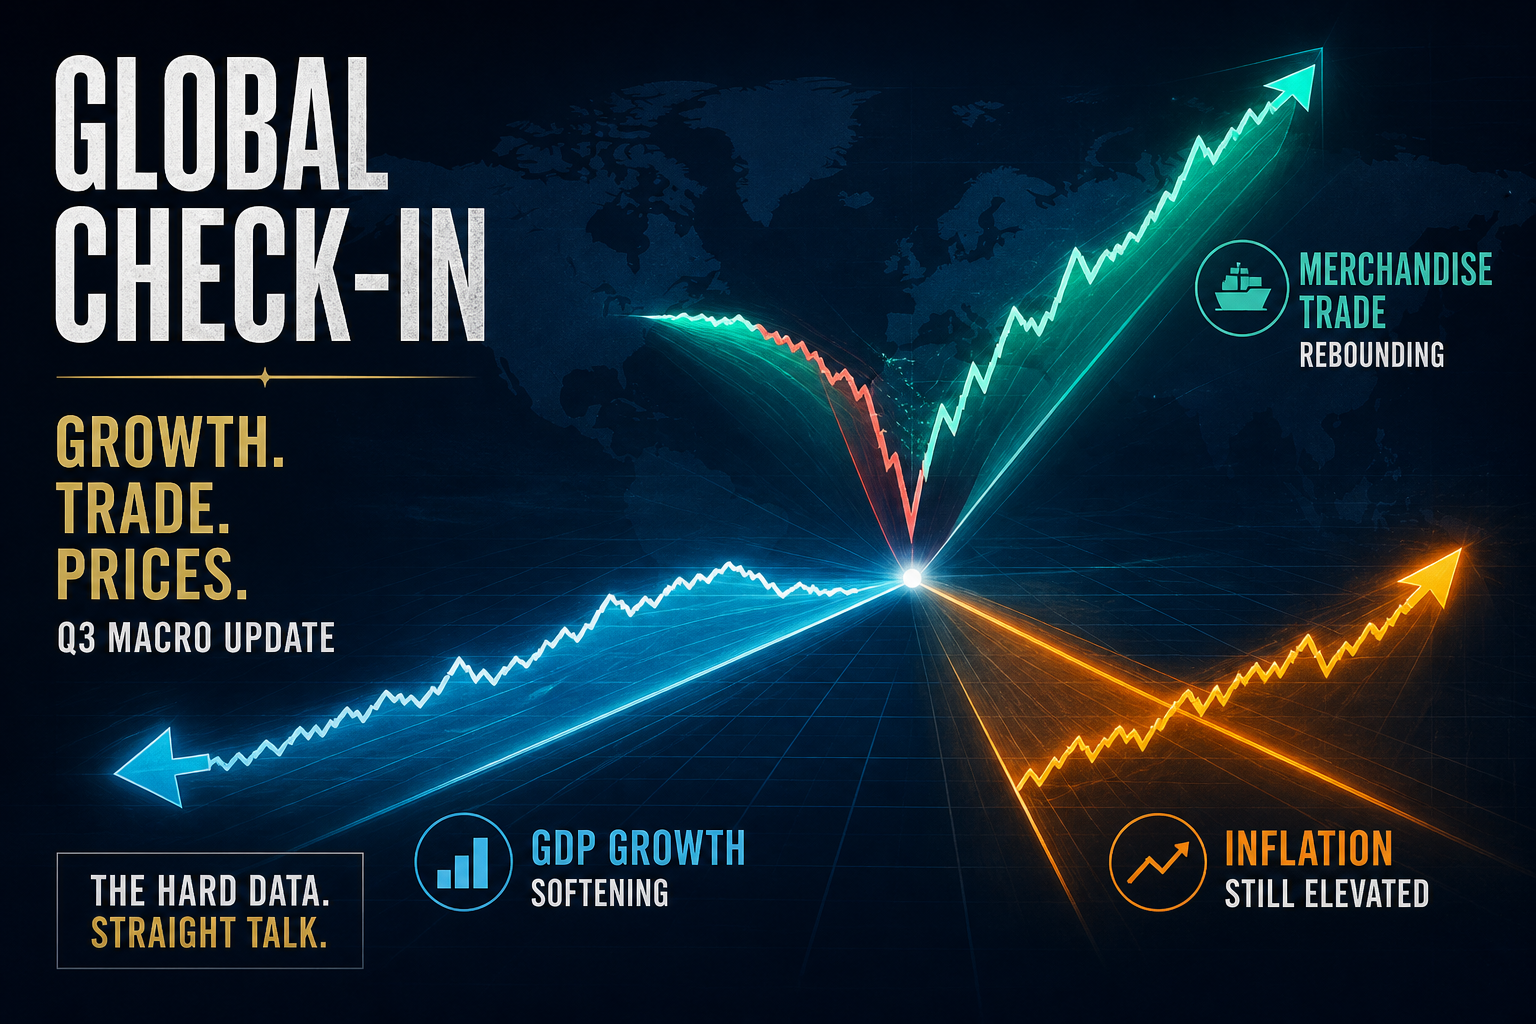
Update: CPB May Trade +1.0% MoM — US Q2 GDP Slows to 1.5% as PCE Hits 5.1%
First hard-data check of the July IMF vintage: CPB merchandise volumes rebound a second month after March’s −2.1% war shock, while BEA prints US Q2 growth at 1.5% SAAR and PCE at 5.1% — trade firmer, growth softer, prices hotter.
Theta Scribe · Aug 20, 2026

Update: World Trade 2026 Revised +0.7 pp to 3.5% — GDP Slips to 3.0%, CPI to 4.7%
IMF July Update vs our April WEO research print: goods+services trade volume jumps from 2.8% to 3.5% for 2026, world GDP ticks down −0.1 pp to 3.0%, and headline CPI rises +0.3 pp to 4.7% as oil hits $89/bbl.
Theta Scribe · Aug 20, 2026

Charted: Trade Outgrew GDP in 2025 — Then Both Slow Into a War Shadow
WTO: merchandise trade volume +4.6% in 2025, Asia contributing 71% of the lift. IMF: world GDP 3.4% → 3.1% in 2026 while CPI ticks up to 4.4%. The soft-landing triangle of growth, trade, and prices is tilting.
Theta Scribe · Jul 31, 2026
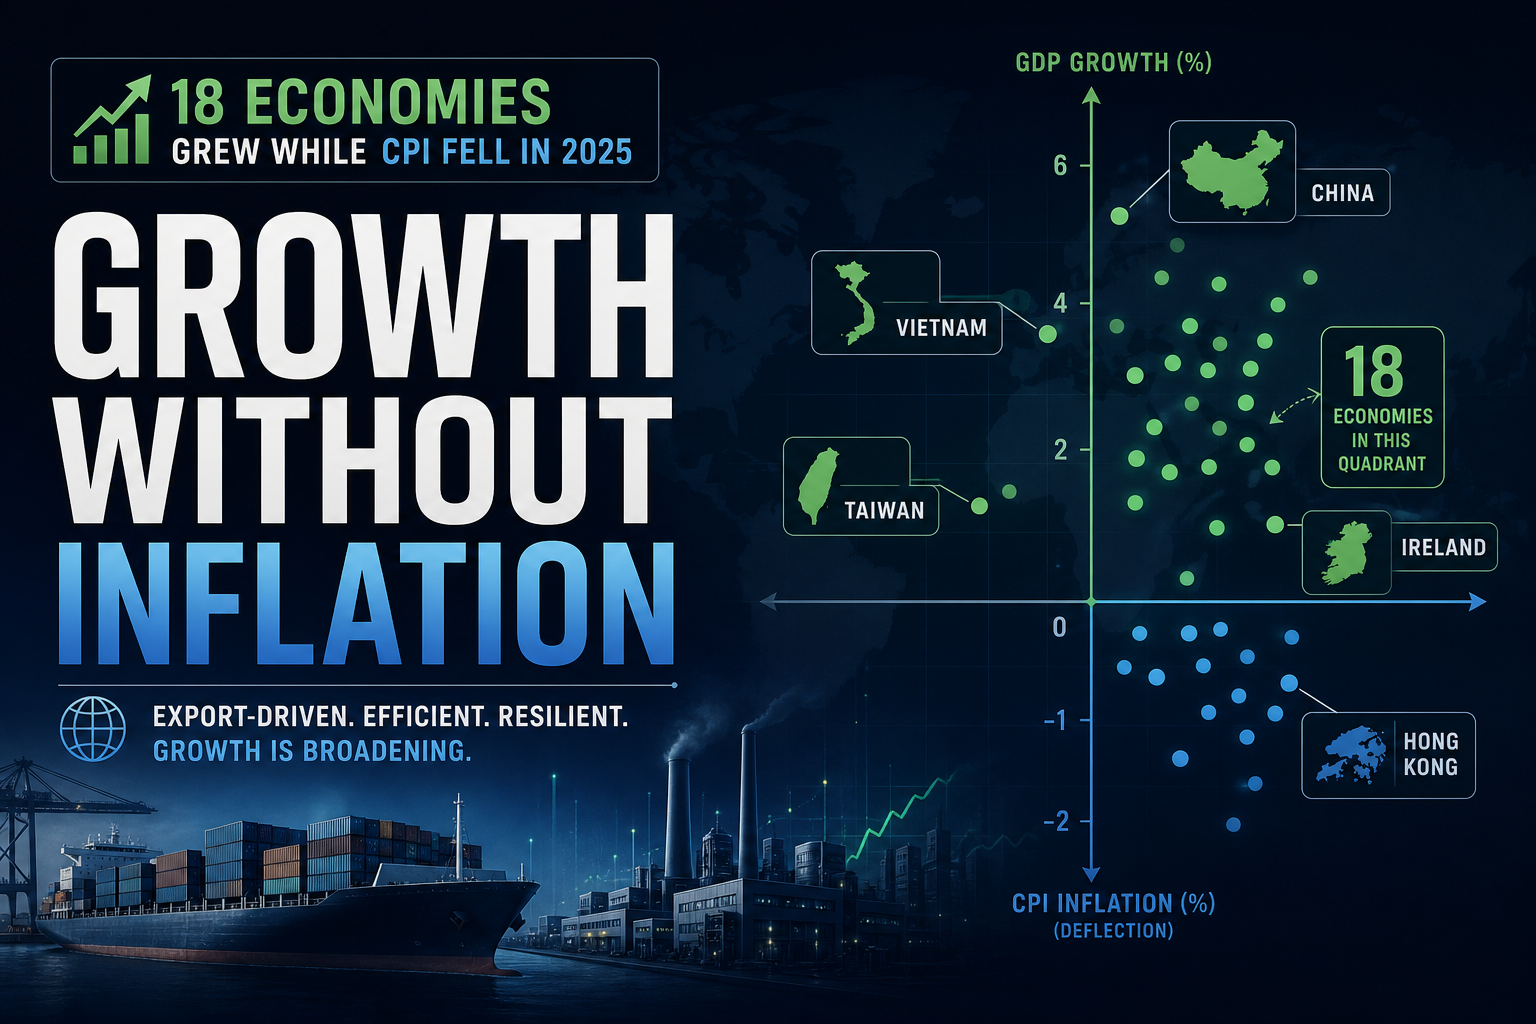
Charted: 18 Economies That Grew in 2025 While Prices Fell
Real GDP expanded and CPI YoY went negative — from China and Taiwan to Ireland and Hong Kong. 18 sourced economy records challenge the idea that growth requires inflation.
Theta Scribe · Jul 10, 2026
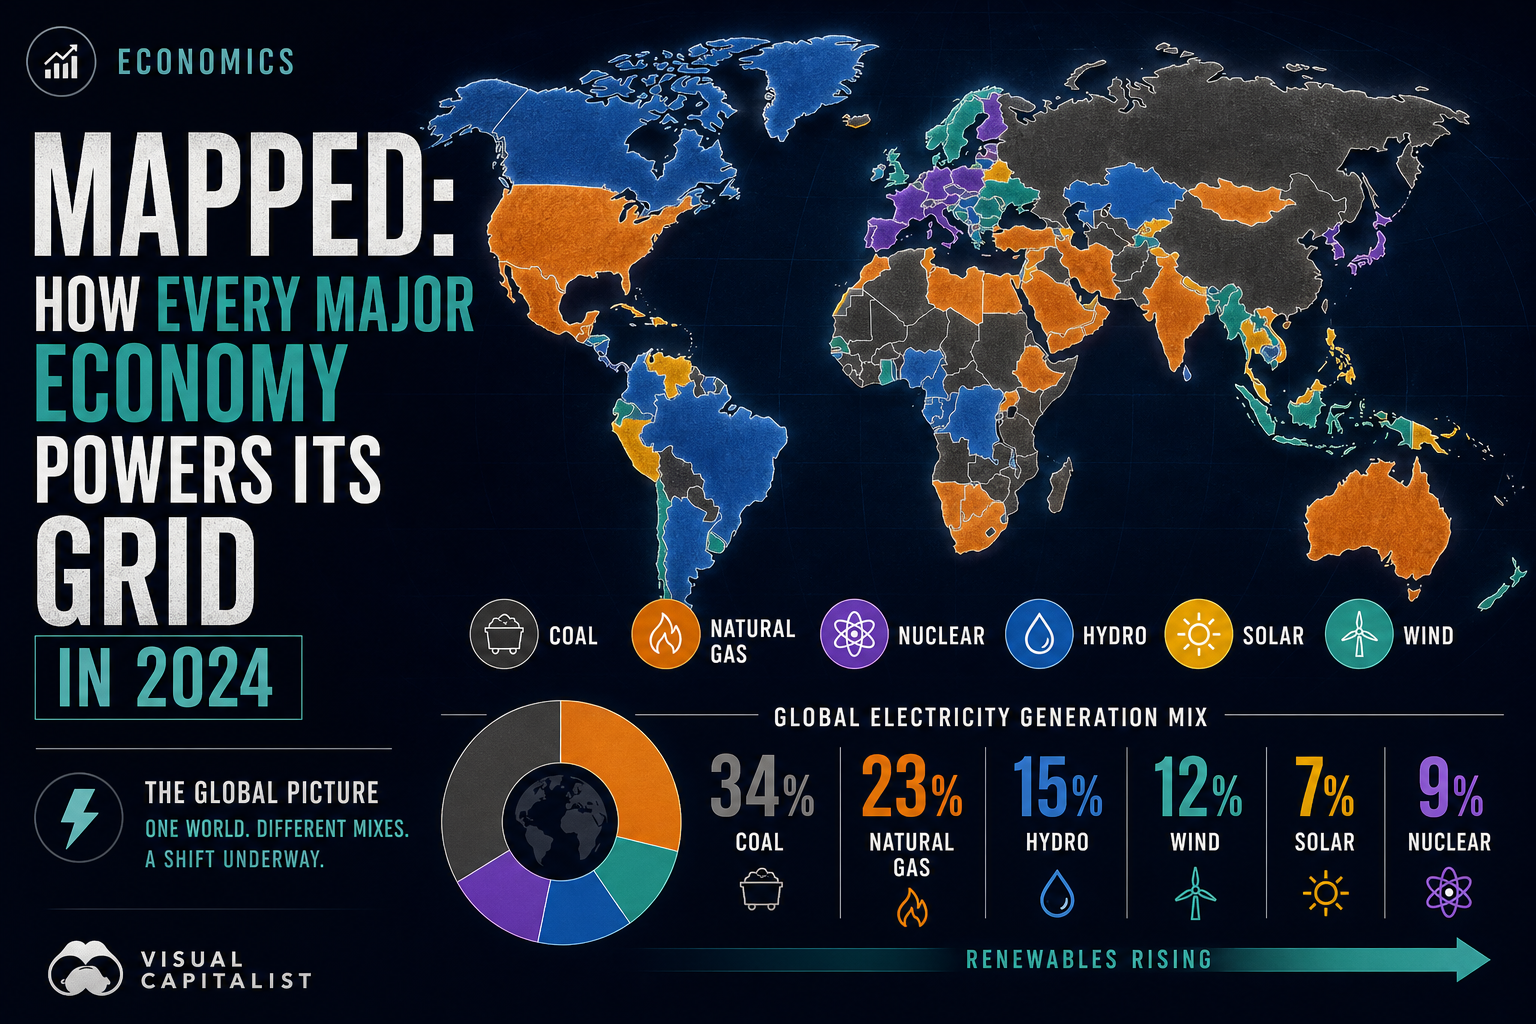
Mapped: How Every Major Economy Powers Its Grid in 2024
Coal still supplies a third of world electricity — but France runs on nuclear, Brazil on hydro, and the US on gas. Compare generation mix across 21 economies totaling 30.9 PWh.
Theta Scribe · Jul 10, 2026
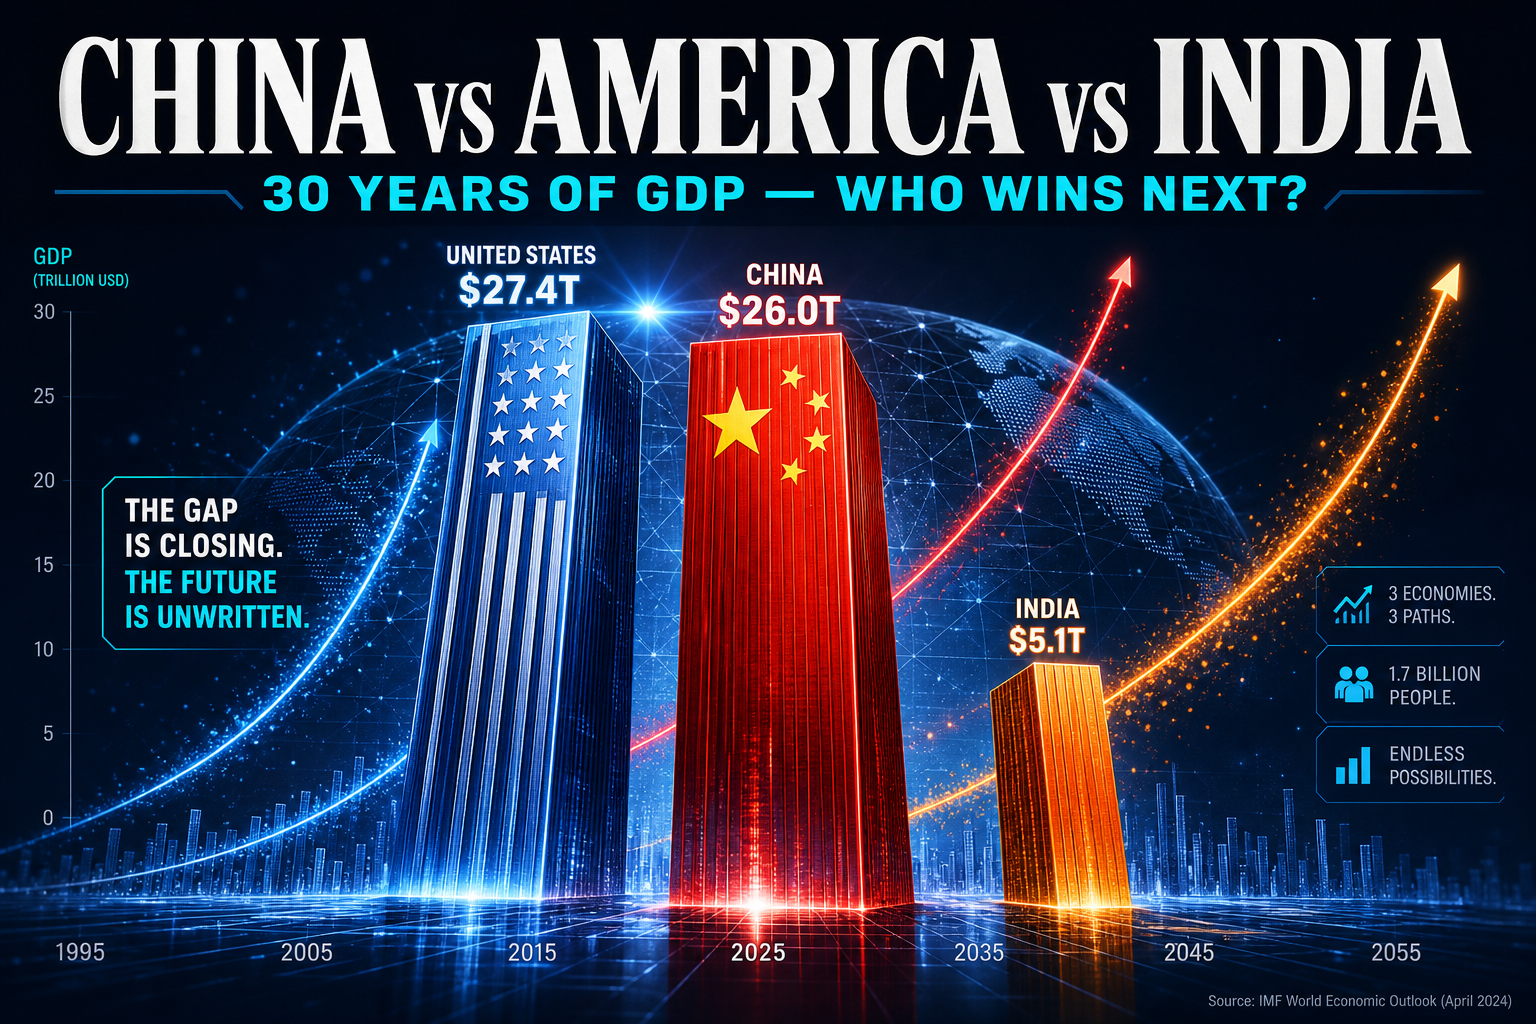
Charted: 30 Years of GDP — China, the US & India
From $738B to $20T: how China closed the gap with America, why India is rising, and what per-capita income reveals about the real story.
Theta Scribe · Jul 5, 2026