
Research desk
Consumer Finance
14 original visual essays in this beat — each with its own figure and sourced argument, not a sequel of the last chart.

20.94% Card APR Versus New Accounts Still 17% Below the 2022 Peak
Commercial-bank all-accounts credit-card APRs print at 20.94% in May 2026 — 6.4 points above the 2021 trough — while large-bank new accounts in 2026 Q1 remain 17.9% below the 2022 quarterly peak.
Theta Scribe · Aug 30, 2026
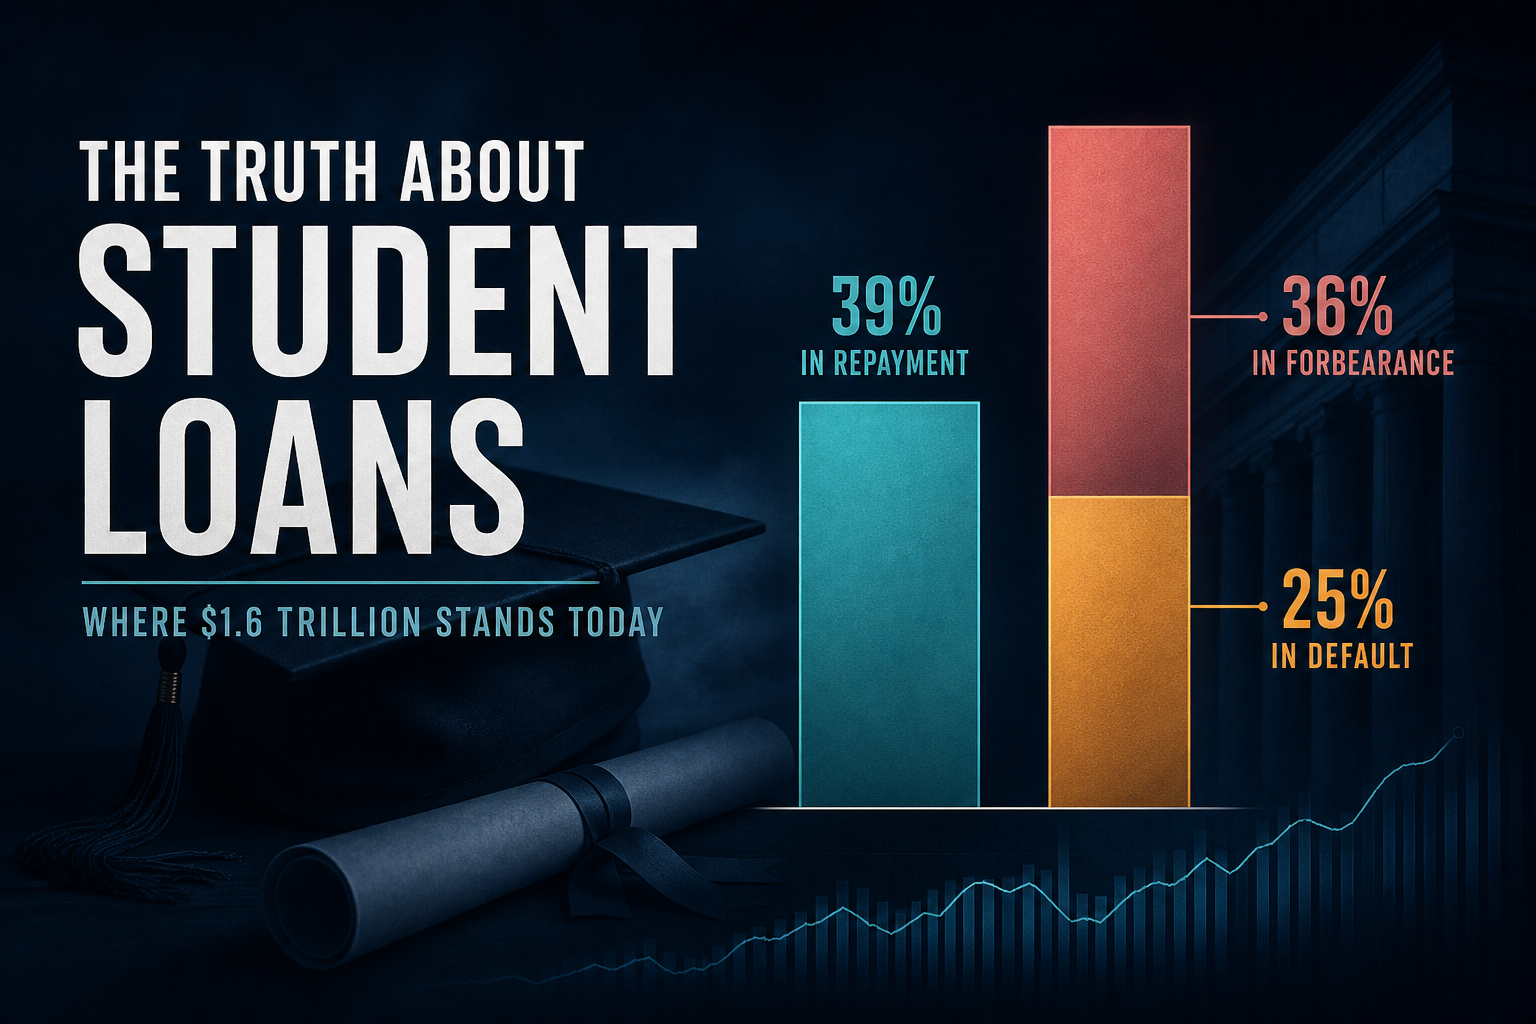
39% of Federal Student Loan Dollars Sit With Borrowers in Repayment
As of March 31, 2026, only $633B of the $1.64T ED-managed book is in current repayment or delinquency. Forbearance, deferment, default, and in-school statuses still hold the majority of outstanding balances.
Theta Scribe · Aug 30, 2026
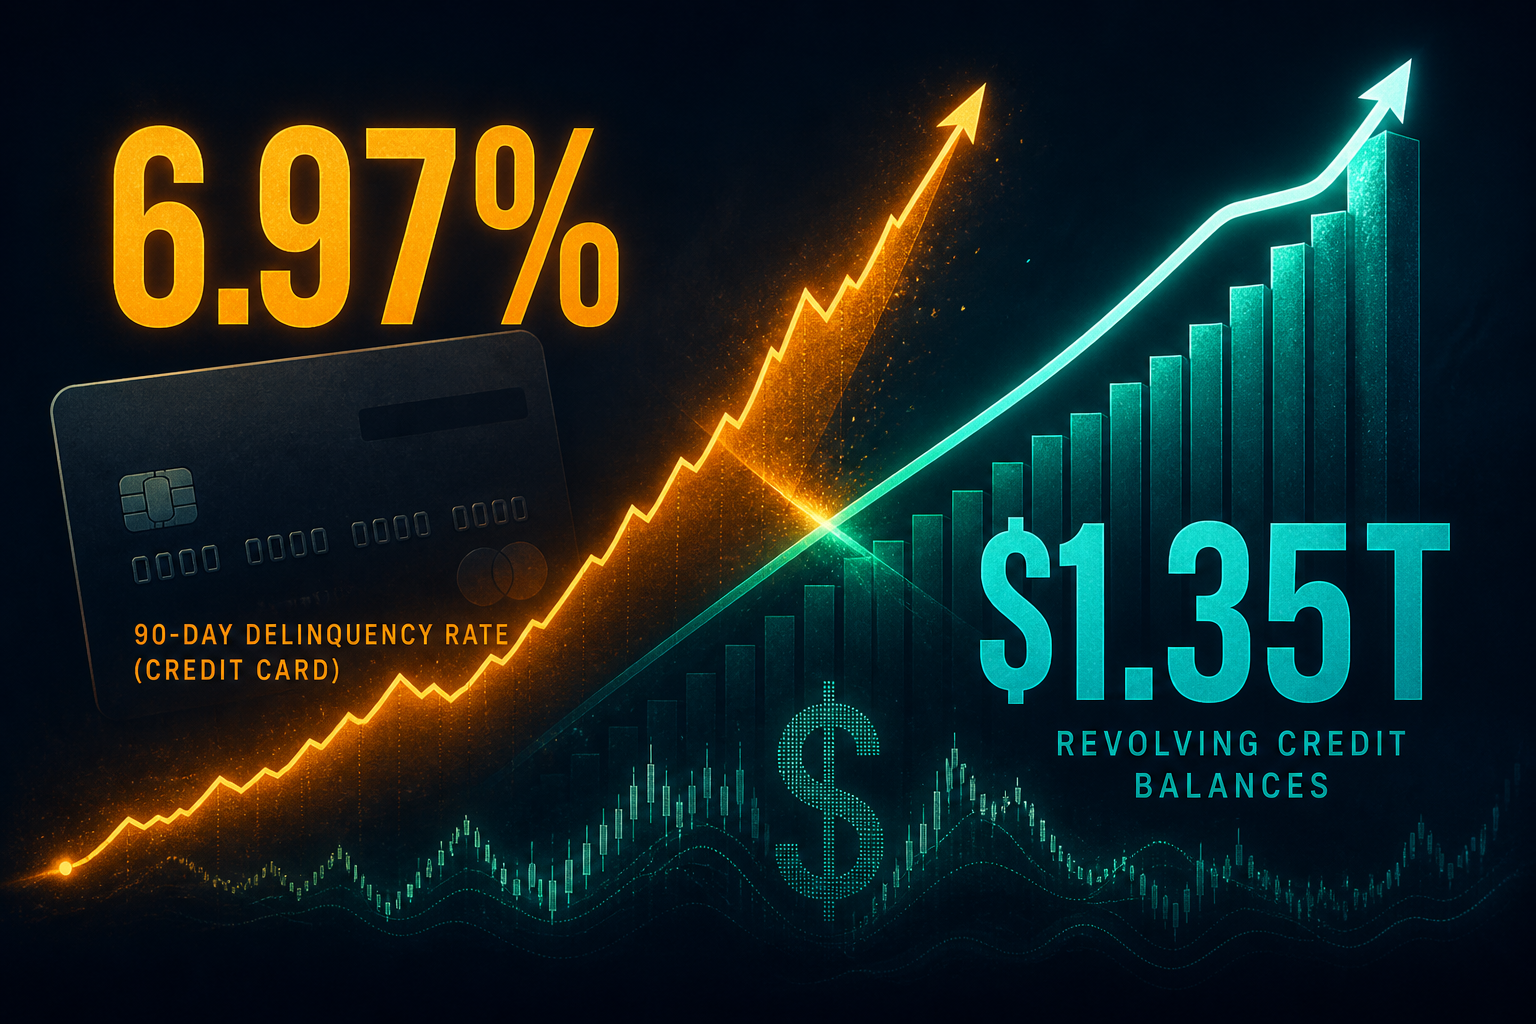
6.97% vs $1.35T: Card 90+ Delinquency Versus Revolving Credit
NY Fed credit-card transitions into 90+ day delinquency sit near 7% while Fed G.19 revolving credit outstanding climbs to $1.35 trillion — stress stayed elevated even as the revolving stock kept expanding.
Theta Scribe · Aug 30, 2026
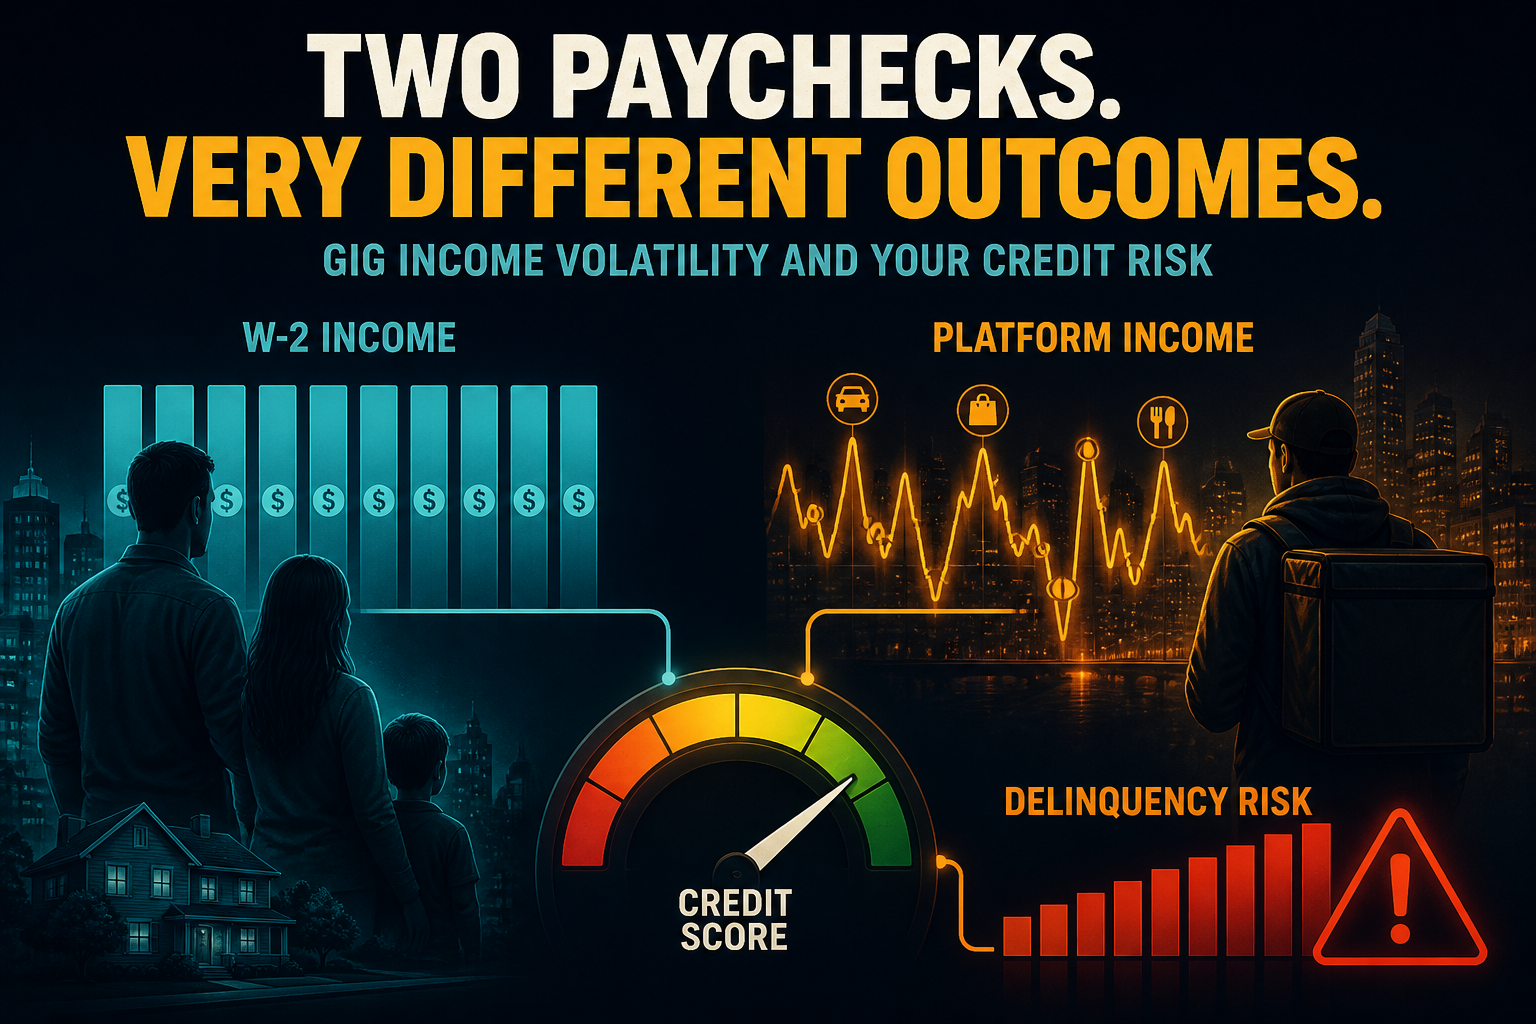
Charted: Gig-Primary Households Show a 2.8 pp Card Delinquency Gap vs Matched W-2 Peers
Desk-harmonized CFPB credit-panel and Fed SHED cuts put gig-primary card 60+ DPD at 8.4% versus 5.6% for matched W-2-only households — a 2.8 percentage-point gap — with a 19 pp thinner $400 cash buffer.
Theta Scribe · Aug 25, 2026

Charted: Platform Earnings Swing Month to Month — For Whom Is Gig the Majority Paycheck?
JPMorgan Chase Institute data show labor-platform participants earn in only 56% of months — averaging $533 (33% of income) when active. One in four active labor participants relied on platforms for more than 75% of income, while the median pandemic-era driver sat near 10% of family income.
Theta Scribe · Aug 25, 2026
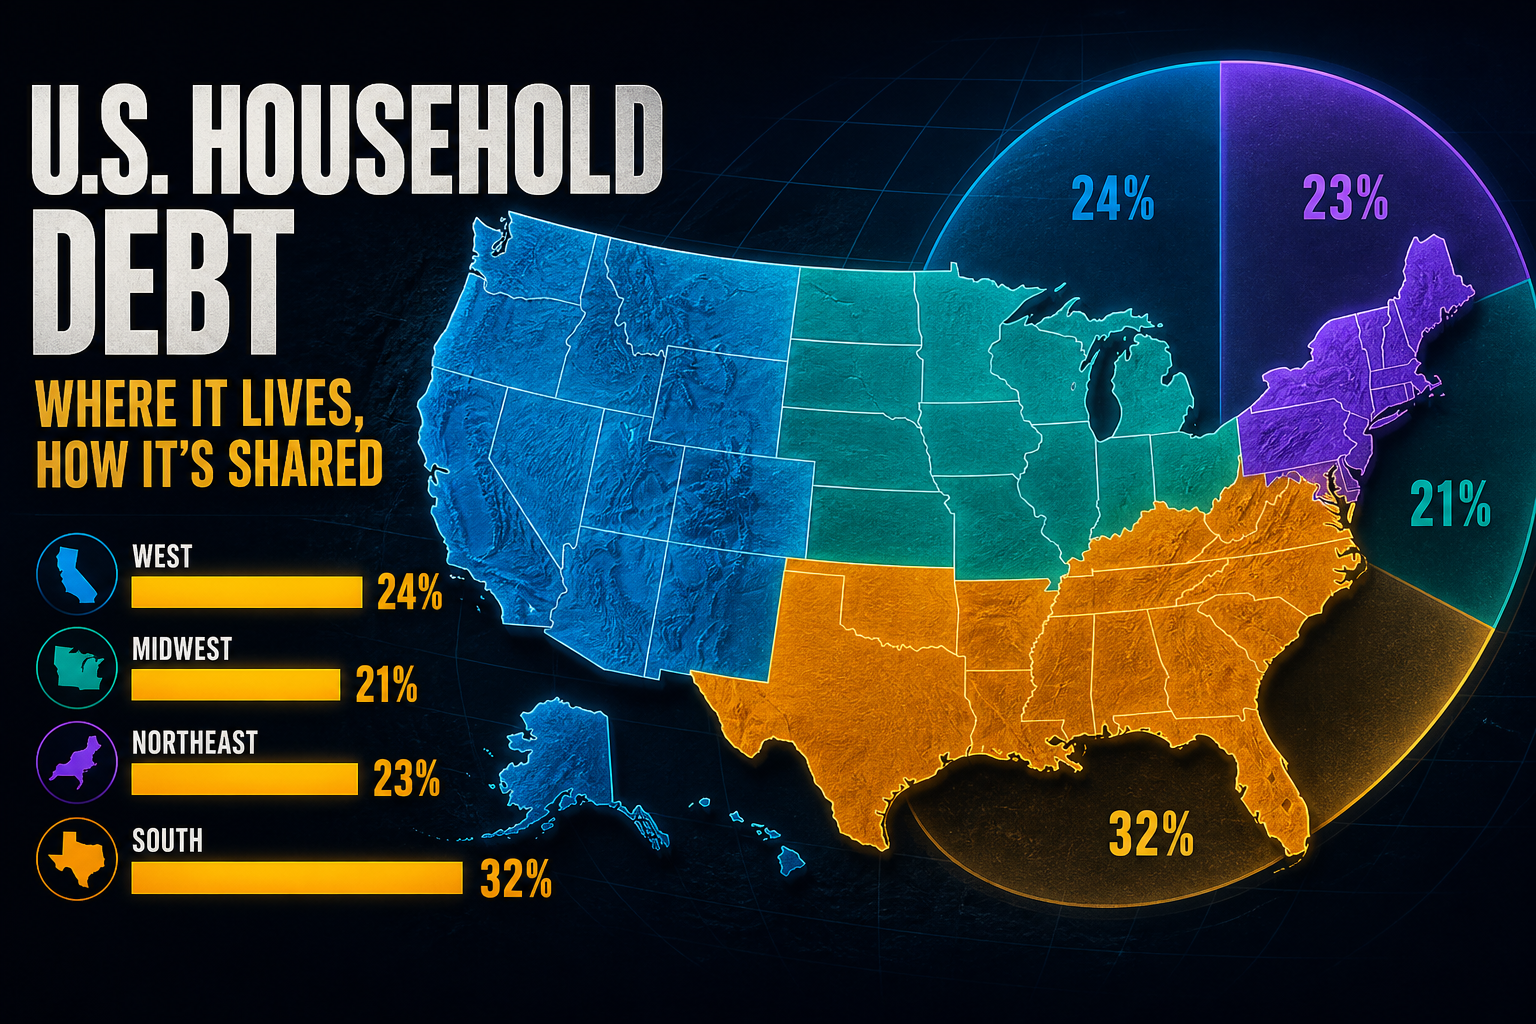
Charted: West Holds 28% of US Household Debt — California Alone 15%
Geography lens on consumer finance: the West leads Census-region household debt (~28% of the $18.9T perimeter), California alone is ~15%, revolving tip and card 90+ stress lean South, while bank-deposit capacity still thickens in the Northeast (~32%) — three maps that disagree.
Theta Scribe · Aug 21, 2026

Aug Concentration: Top-1 Equities Still 54% — Official MMF $7.93T (−$92B) While Tip Shares Stay Sticky
August 202608 concentration lens on consumer finance: people-side top-1 equities remain ~54% and top-1 wealth ~30.5%, top-3 card issuers still ~52% of purchase volume, mortgage alone is 70.1% of NY Fed $18.93T debt — while the official ICI MMF print restates to $7.93T (−$92B vs the Q3 claim) without moving the tip.
Theta Scribe · Aug 21, 2026
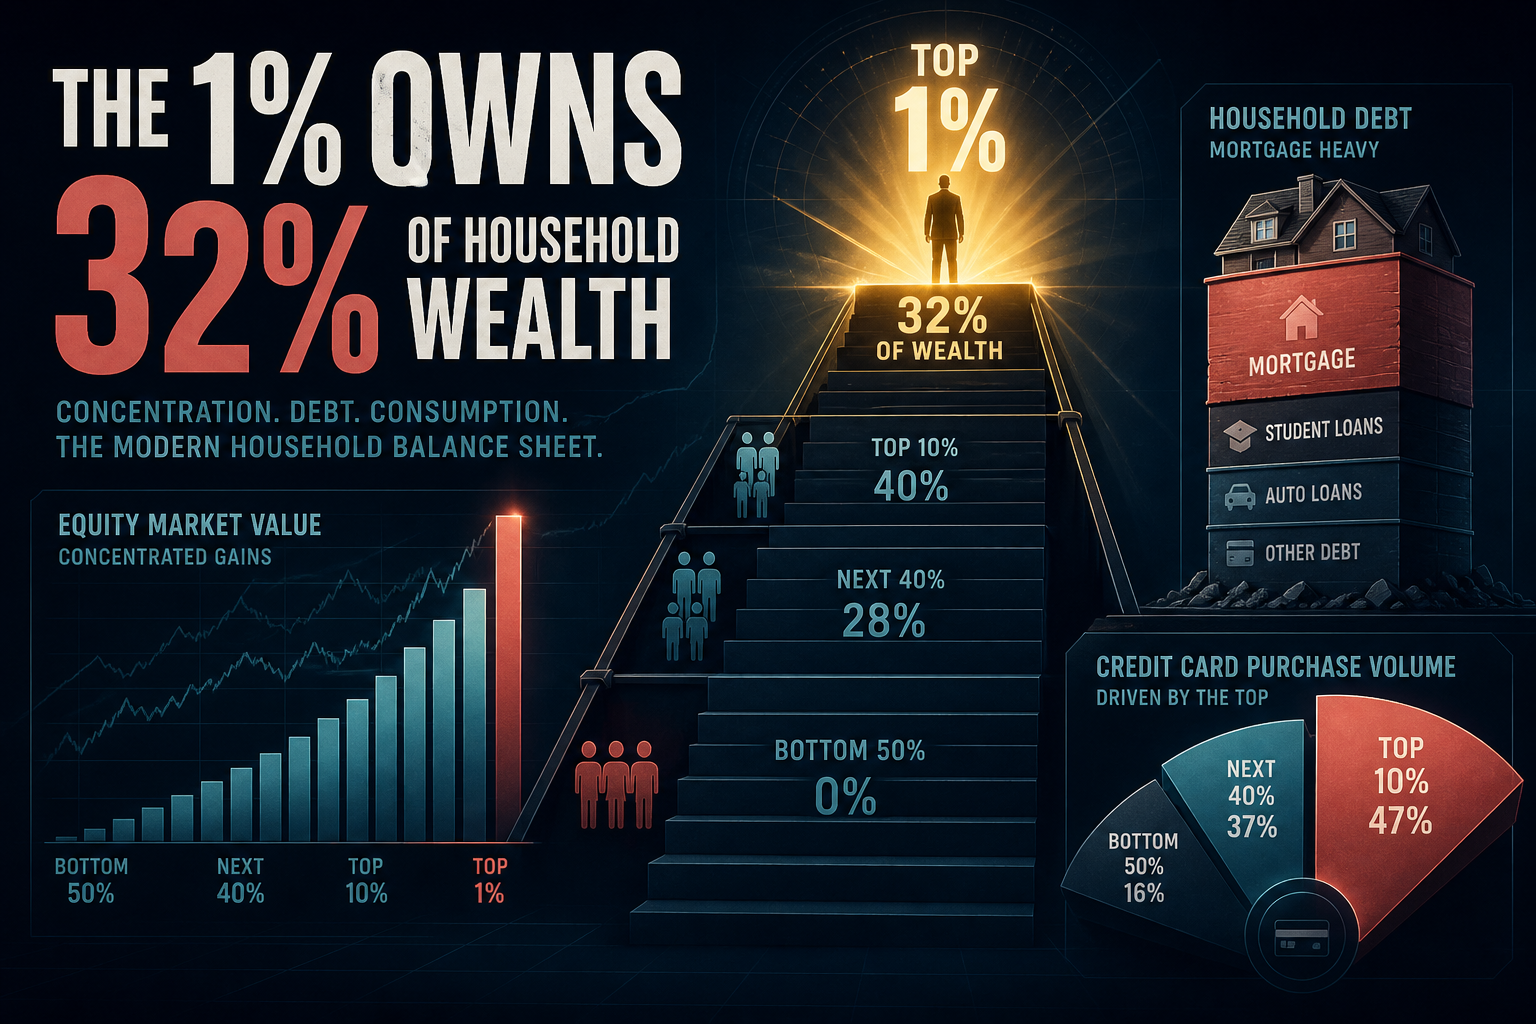
Q3 Concentration: Equity HHI Hits 4,150 — Mortgage Takes 70% of Household Debt
Q3 concentration lens on consumer finance: people-side equities print HHI ~4,150 with top-1 ~54%, liability-side mortgage alone is 70.1% of NY Fed $18.93T debt, while top-3 card issuers clear ~52% of purchase volume — and deposits still dominate the liquid pair vs $8.02T MMF.
Theta Scribe · Aug 21, 2026

Charted: Top 1% Holds 30.5% of Household Wealth — Equities Hit 54%, Cards Invert the Skew
Concentration lens on consumer finance: Fed DFA-style top 1% / top 10% own ~30.5% / ~67.5% of net worth, equities concentrate harder (~54% / ~87%), while revolving balances sit with the middle and bottom — and top-3 card issuers clear ~52% of purchase volume.
Theta Scribe · Aug 21, 2026
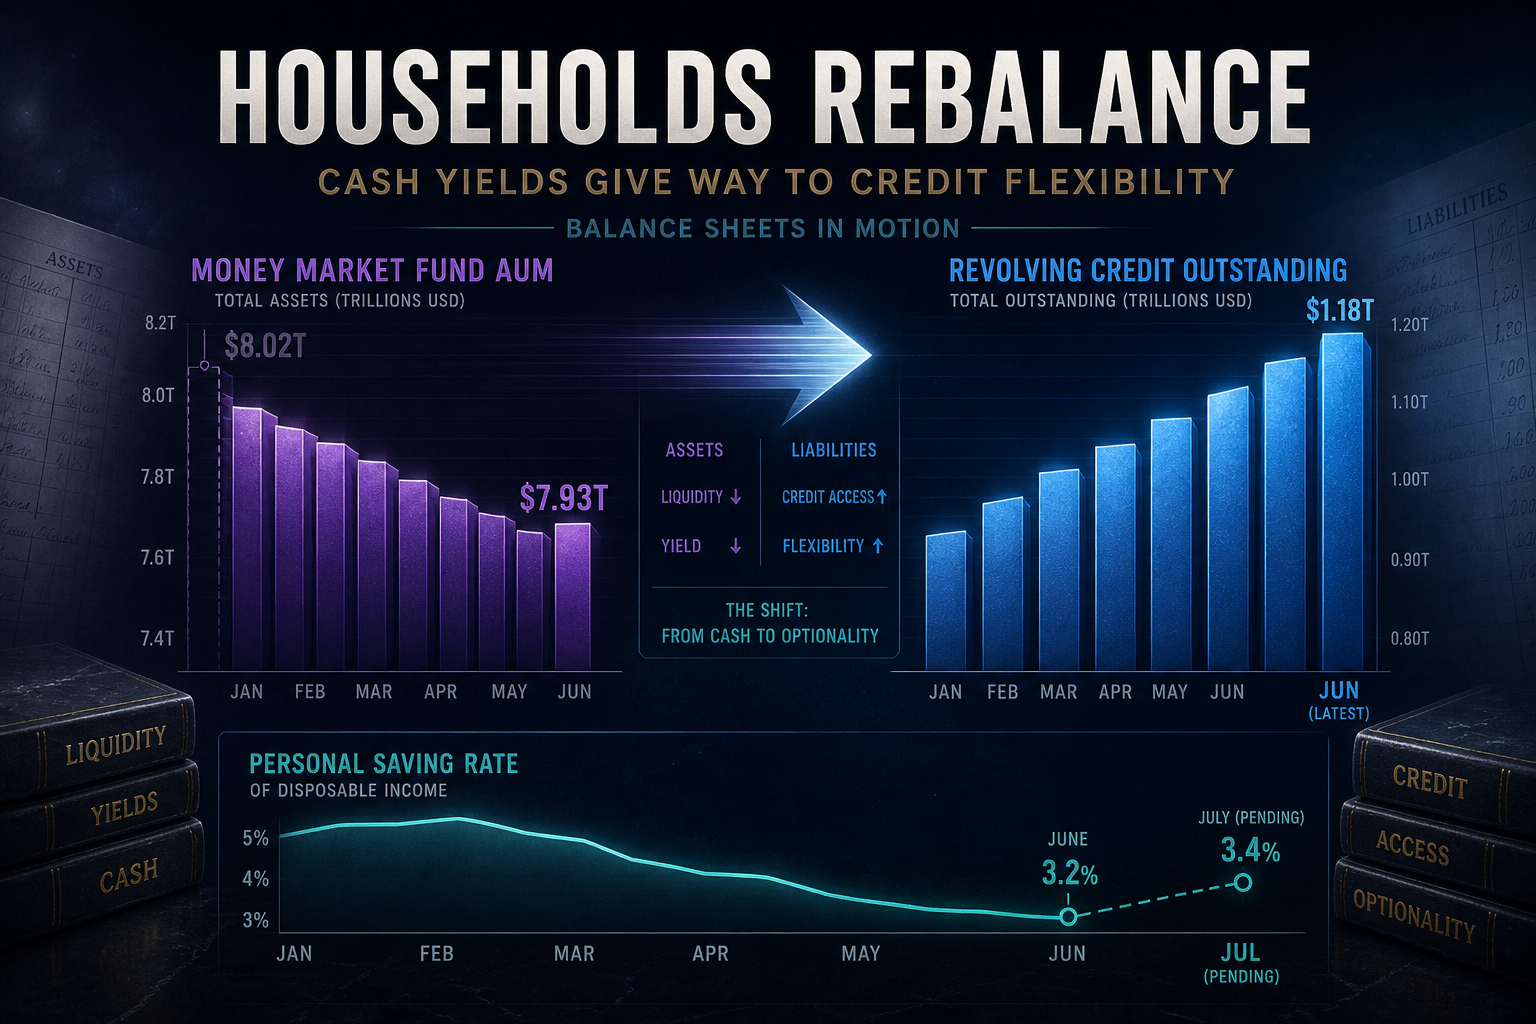
Update: Official MMF Print Restates to $7.93T (−$90B vs Q3) as G.19 Revolving Hits $1.35T
Versus our Q3 theme print ($8.02T MMF; July saving 3.1%), the Aug 20 ICI release puts week-ended Aug 19 AUM at $7.93T (−$92B). G.19 June revolving prints $1.351T; disclosed PSAVERT remains June 2.7% pending Aug 26.
Theta Scribe · Aug 20, 2026
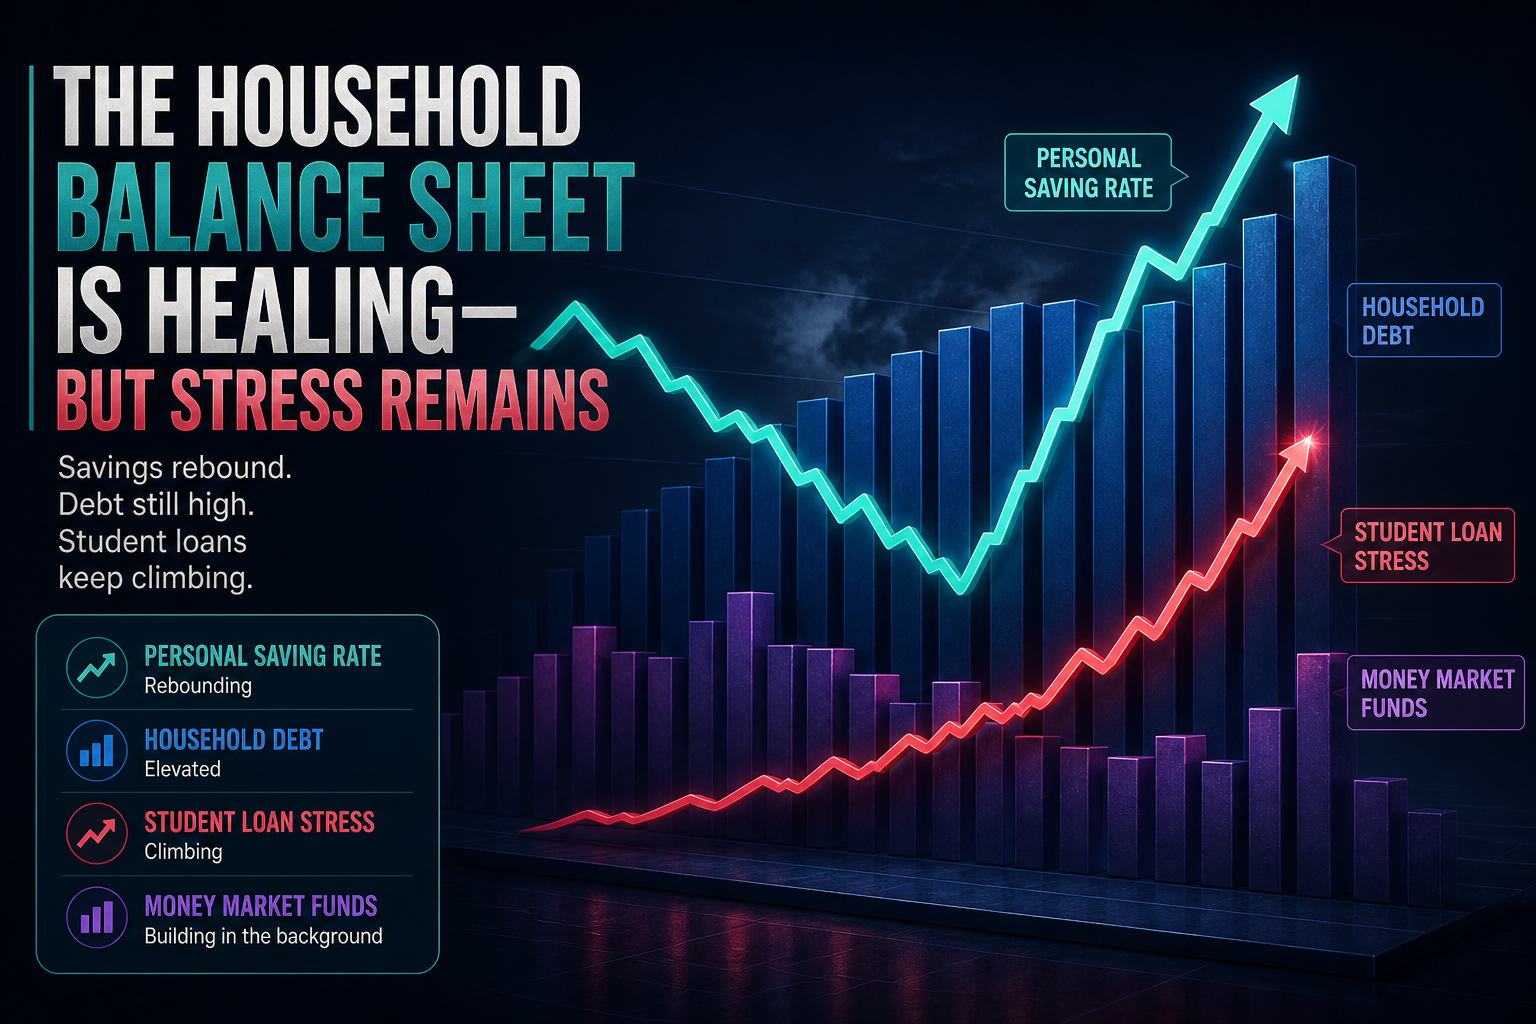
Update: Household Saving Rebounds to 3.1% — Debt Prints $18.93T as Student 90+ Hits 10.6%
Versus our Aug update (2.8% Q2 saving, $18.79T debt), July PSAVERT rebounds to 3.1% (+0.3 pp) and NY Fed 2026Q2 debt prints $18.93T (+$132B). Student-loan 90+ rises to 10.6%; MMFs revise up to $8.02T.
Theta Scribe · Aug 20, 2026
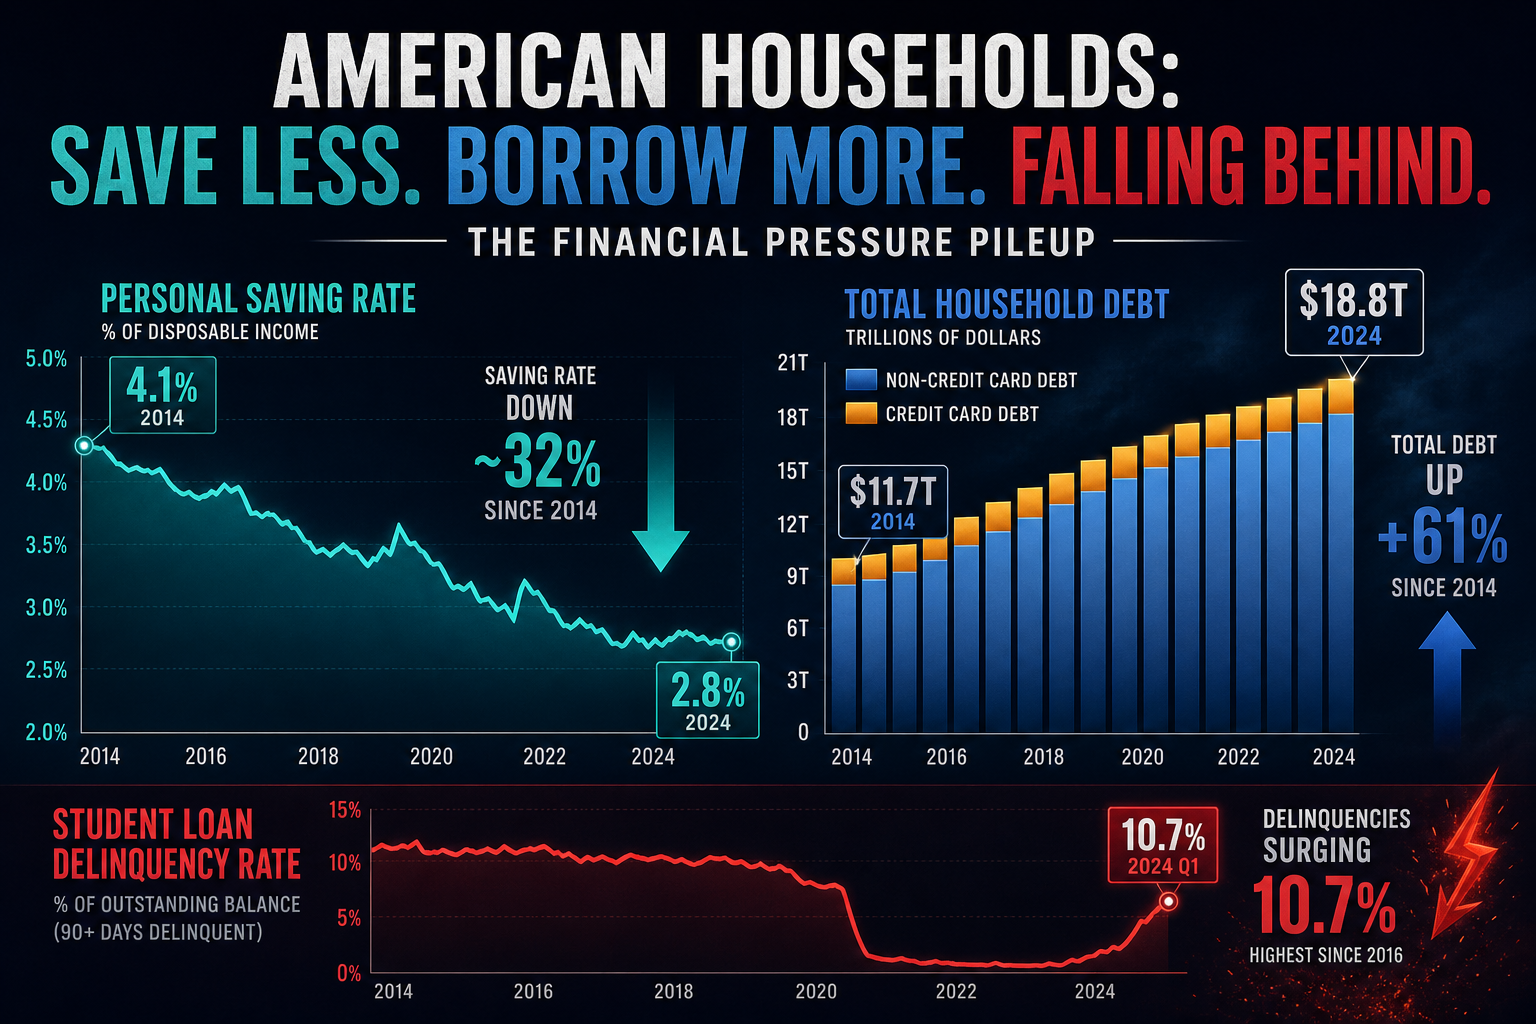
Update: Household Saving Rate Falls to 2.8% — Debt Prints $18.8T as Student 90+ Hits 10.3%
Versus our research print (~3.9% saving, $18.42T debt), BEA Q2 2026 saving drops to 2.8% (−1.1 pp) and NY Fed 2026Q1 debt prints $18.79T. Student-loan 90+ stock rises to 10.3% (+0.7 pp); MMFs edge up to $7.93T.
Theta Scribe · Aug 20, 2026
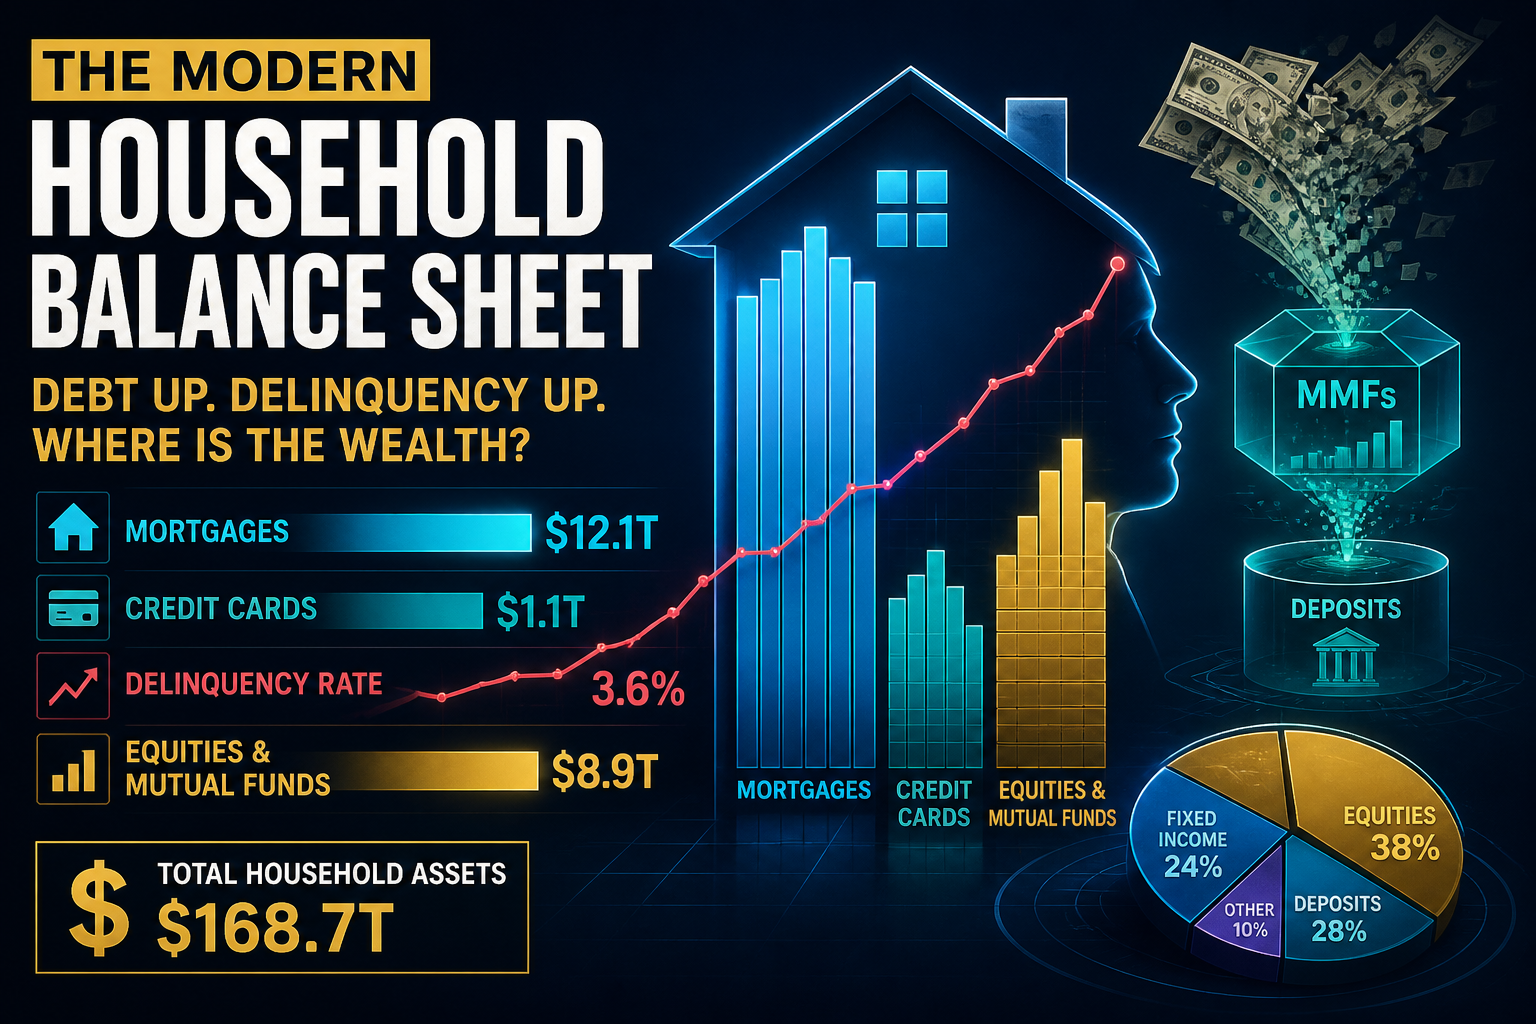
Charted: $18.4T Household Debt — Cards Delinquent at 7.2% While Mortgages Hold Near 1.1%
NY Fed–style household debt sits near $18.4 trillion; credit-card 90+ day delinquency runs about 7.2% against ~1.1% for mortgages. The personal saving rate is back near 3.9%, card APRs still clear fed funds by ~17 pp, and liquid cash splits between ~$15T deposits and $7.85T MMFs.
Theta Scribe · Aug 20, 2026

Charted: $7.85T Sits in Money Market Funds — Still 3.3 pp Above Bank Savings Yields
ICI puts US money market fund assets at $7.85 trillion as of late July 2026. Government funds are 82% of the pile, and YE 2025 taxable MMF yields still beat money-market deposit accounts by about 3.3 percentage points.
Theta Scribe · Jul 31, 2026