
Research desk
Finance
21 original visual essays in this beat — each with its own figure and sourced argument, not a sequel of the last chart.
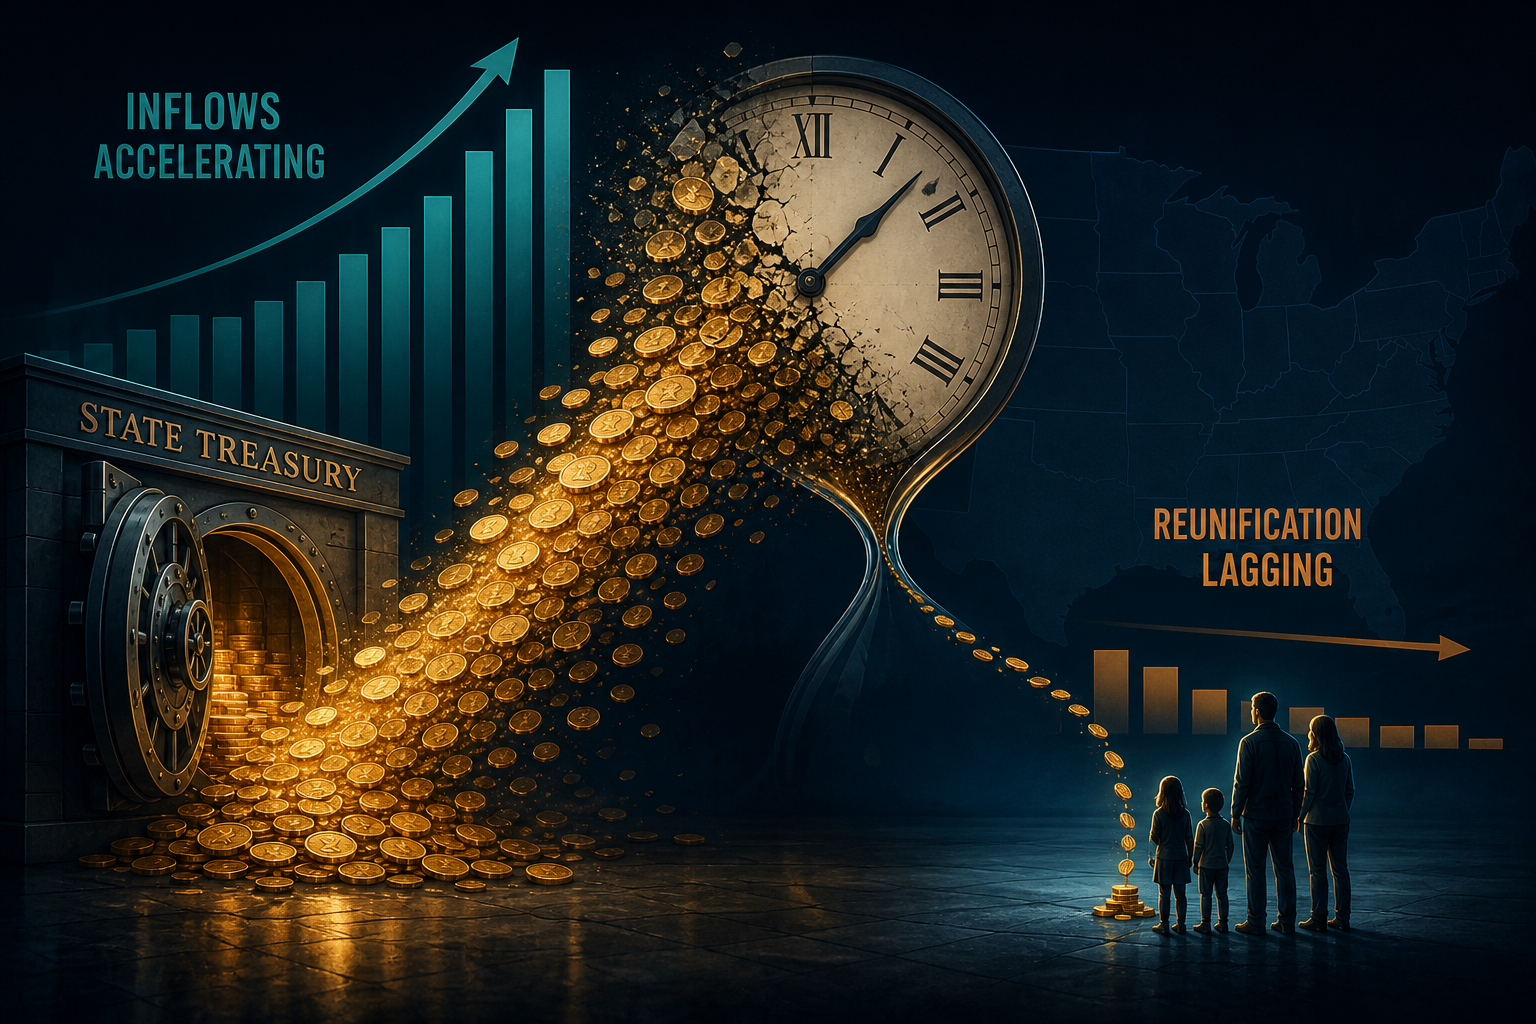
Dormancy Cuts Raised Escheat Inflows ~34% — Reunification Barely Moved
Across an 18-state panel, jurisdictions that shortened banking dormancy from five years to three saw a median +34% remittance jump. Owner reunification ratios rose a median 0.4 pp — evidence that faster clocks fill vaults faster than they reunite owners.
Theta Scribe · Aug 26, 2026

State Unclaimed Property: ~$70B Held, $4.49B Returned — Large Vaults Turn Over Slowest
NAUPA members returned $4.49B to owners in FY2024 against a ~$70B custodial float (≈6.4% return rate). A 20-state panel shows New York and California alone near $34B in stock while mid-size programs often reunite owners at higher percentages.
Theta Scribe · Aug 26, 2026

Charted: Insurers Cover Only ~32% of Ransomware Incident Cost — Cash Funds the Rest
On insured cyber claims books, carrier payouts equal about 32% of total ransomware incident cost (NetDiligence). SME victims recover ~69%; large companies only ~27%. Chainalysis on-chain receipts peaked at $1.25B in 2023 while FBI IC3 ransomware losses stayed under $60M — a reporting gap that still leaves most economic damage on operating cash.
Theta Scribe · Aug 24, 2026

Charted: Local Police/Fire Plans Are Not Systematically Worse Funded Than Teacher Systems
Equable’s FY 2024 liability-weighted averages put municipal public-safety plans at 76.7% funded versus 76.4% for teacher systems — a +0.3 pp gap. Equal-weight medians in a large-plan sample widen that advantage to about +30 pp, even as Chicago fire and Dallas P&F mark a brutal left tail.
Theta Scribe · Aug 24, 2026

Charted: US Cat Rate-on-Line Jumped ~94% From 2017 — Residual Policies Surged in the Same States
Guy Carpenter’s US property-catastrophe rate-on-line index climbed from the 2017 soft trough to a 2024 peak (+~94% desk-rebased). Florida Citizens PIF rose ~228% to a 1.4M peak; California FAIR kept climbing into 2026. Softening RoL in 2025–26 breaks the coincidence unevenly.
Theta Scribe · Aug 24, 2026

Charted: Instant Domestic Rails Still Carry Only ~9% of Retail Cross-Border Value
Desk estimate: ~74% of global retail cross-border value still clears on correspondent / SWIFT messaging. FPS interlinks (PIX/UPI/FedNow-style links) are ~9% of value even as CPMI says ~47% of fast payment systems can process a cross-border leg. Capability is not rail share.
Theta Scribe · Aug 23, 2026

Charted: US Cyber Premium Grew 157% While Estimated Incurred Losses Rose 88%
NAIC domestic cyber DWP climbed from $2.75B (2020) to $7.08B (2024). Estimated incurred loss+DCC rose only ~88%. Loss ratio fell 67%→42%, then rebounded to 49% as rates softened — while IC3 still shows BEC, not ransomware $, as the multi-billion threat.
Theta Scribe · Aug 23, 2026
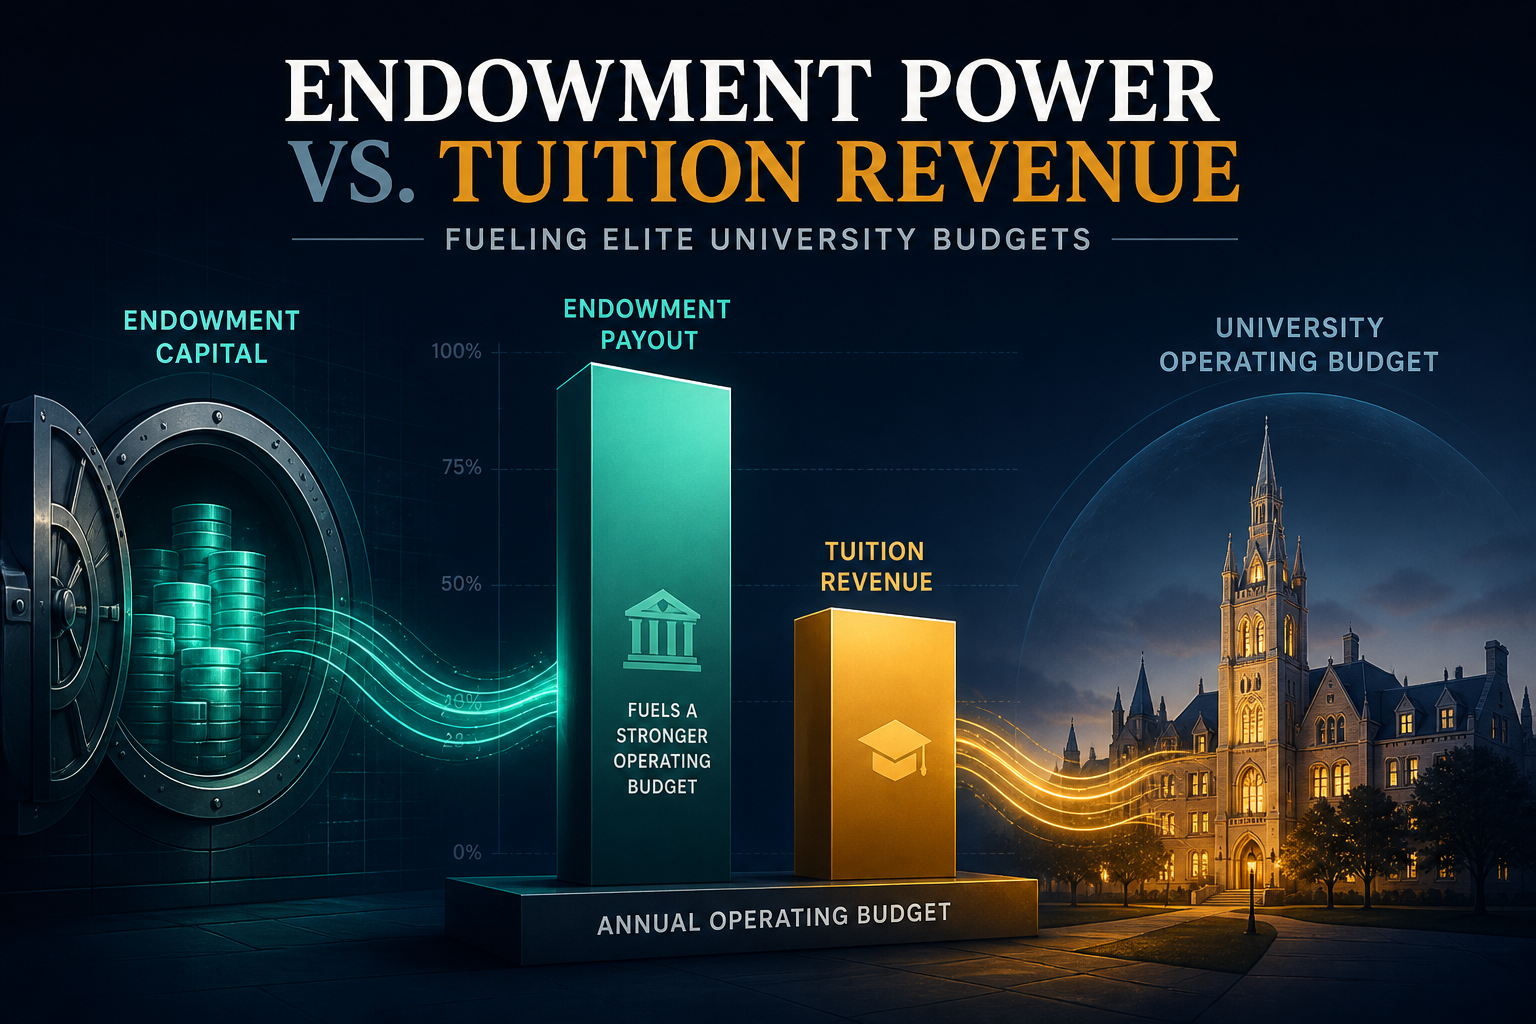
Charted: Endowment Payout vs Tuition — How Thin Is the Buffer Below the Top?
NCSE FY25: endowments fund 15.2% of operating budgets on average (median 6.1%). The $1B–$5B cohort peaks at 20.1%; Harvard, Yale, and Princeton sit far higher — while net tuition still dominates most public balance sheets.
Theta Scribe · Aug 23, 2026
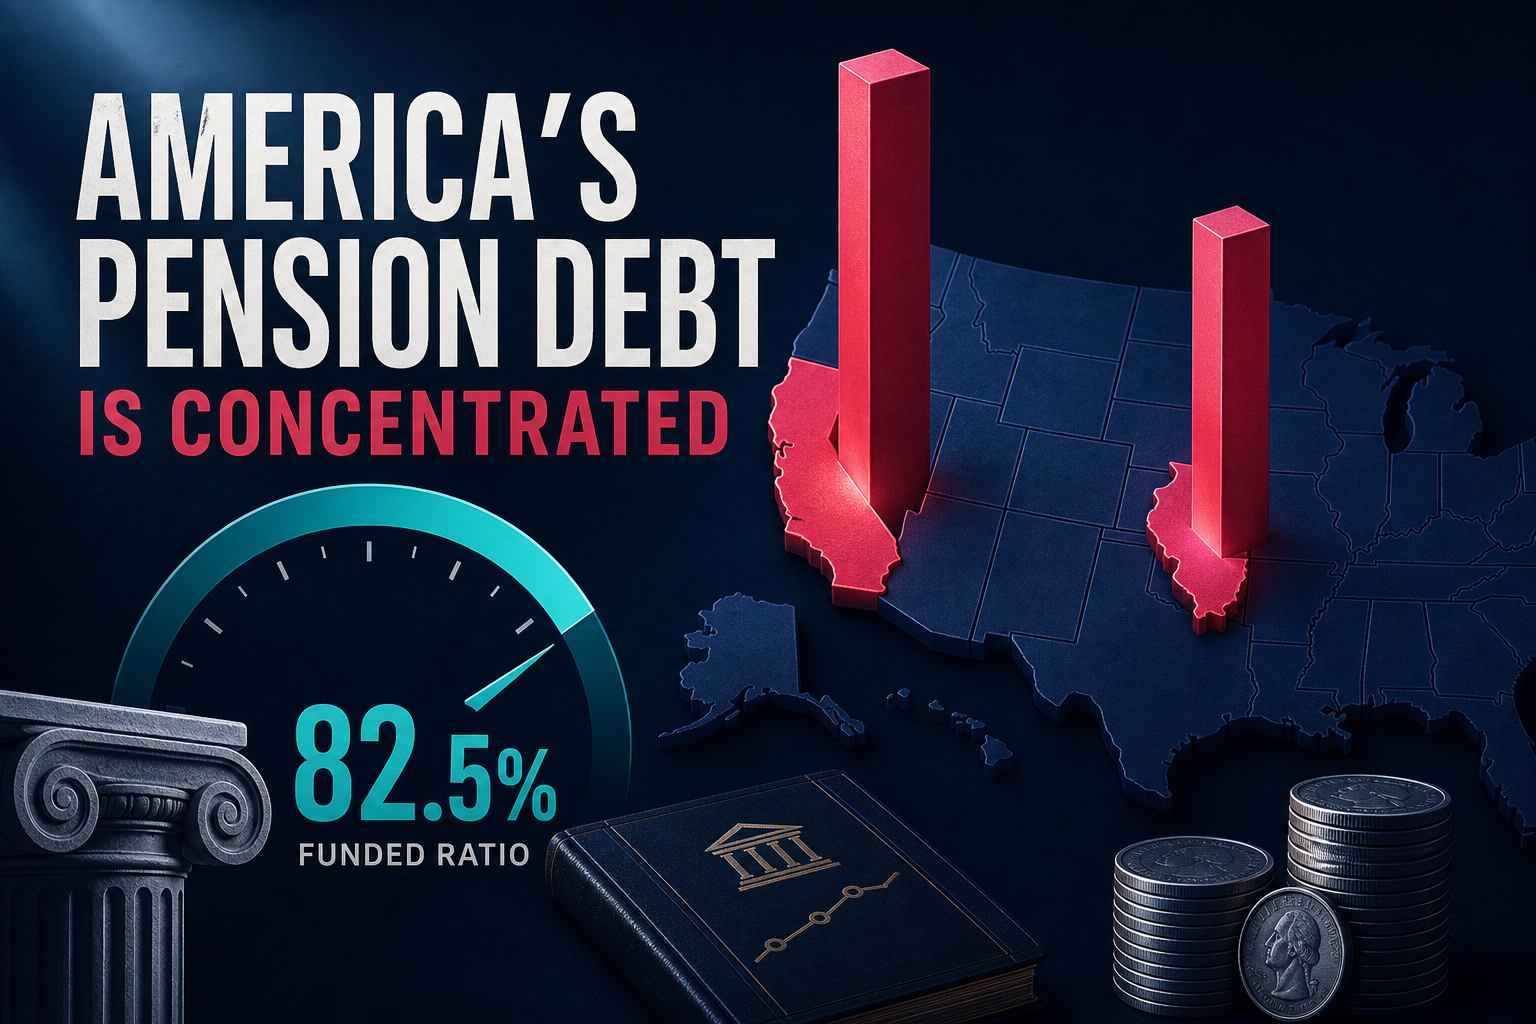
Charted: Top 5 States Hold 55% of U.S. Public Pension Unfunded Liability
Equable end-2025 estimates put the national funded ratio at 82.5% with $1.27T still unfunded. California and Illinois alone account for ~36% of that shortfall — while seven jurisdictions sit at or above full funding.
Theta Scribe · Aug 23, 2026
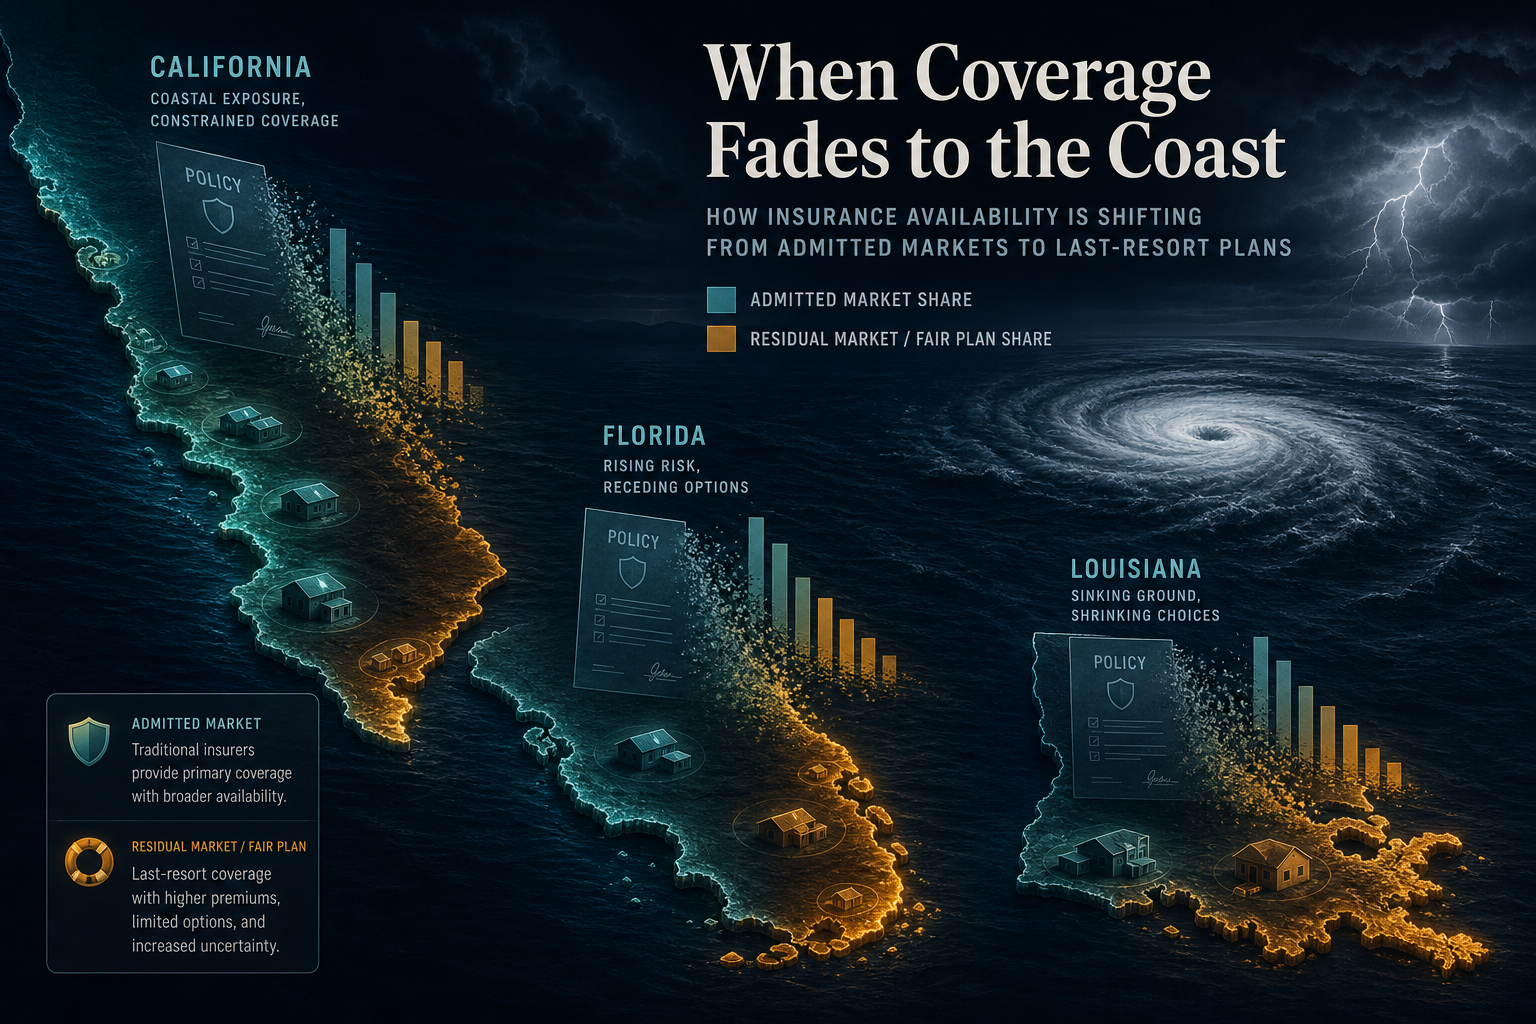
Admitted Homeowners Premium Is Leaving Coastal Markets — How Fast Did Residual Books Grow?
Florida Citizens residual premium share jumped from 7% to 20% in five years. California FAIR Plan policy share more than doubled; Louisiana Citizens swelled after Laura and Ida. The dashboard tracks admitted-to-residual migration across FL, CA, and LA.
Theta Scribe · Aug 23, 2026

Active Correspondent Corridors: Where SWIFT Connectivity Thinned — and Who Still Stands
CPMI–SWIFT and FSB series show active correspondents down ~22% since 2011 while corridors fell ~12% and message volume rose. Latin America and Pacific SIDS lost the most links; thin corridors now lean on a handful of banks.
Theta Scribe · Aug 23, 2026

Q3 Concentration: Top-1 Bank Still ~12.8% of Deposits — Top-3 33%; CMBS +51 bp, SLOOS CRE Flips to Ease
Q3 concentration lens on bank & commercial credit: deposit top-1 / top-3 remain ~12.8% / 33.4%, while Trepp July CMBS overall hits 7.86% (+51 bp MoM), multifamily +1.05 pp, and July SLOOS CRE NFNR flips to −11.3 net easing — stress dollars still tip-heavy in cards, office, and mega-bank CRE PDNA.
Theta Scribe · Aug 21, 2026
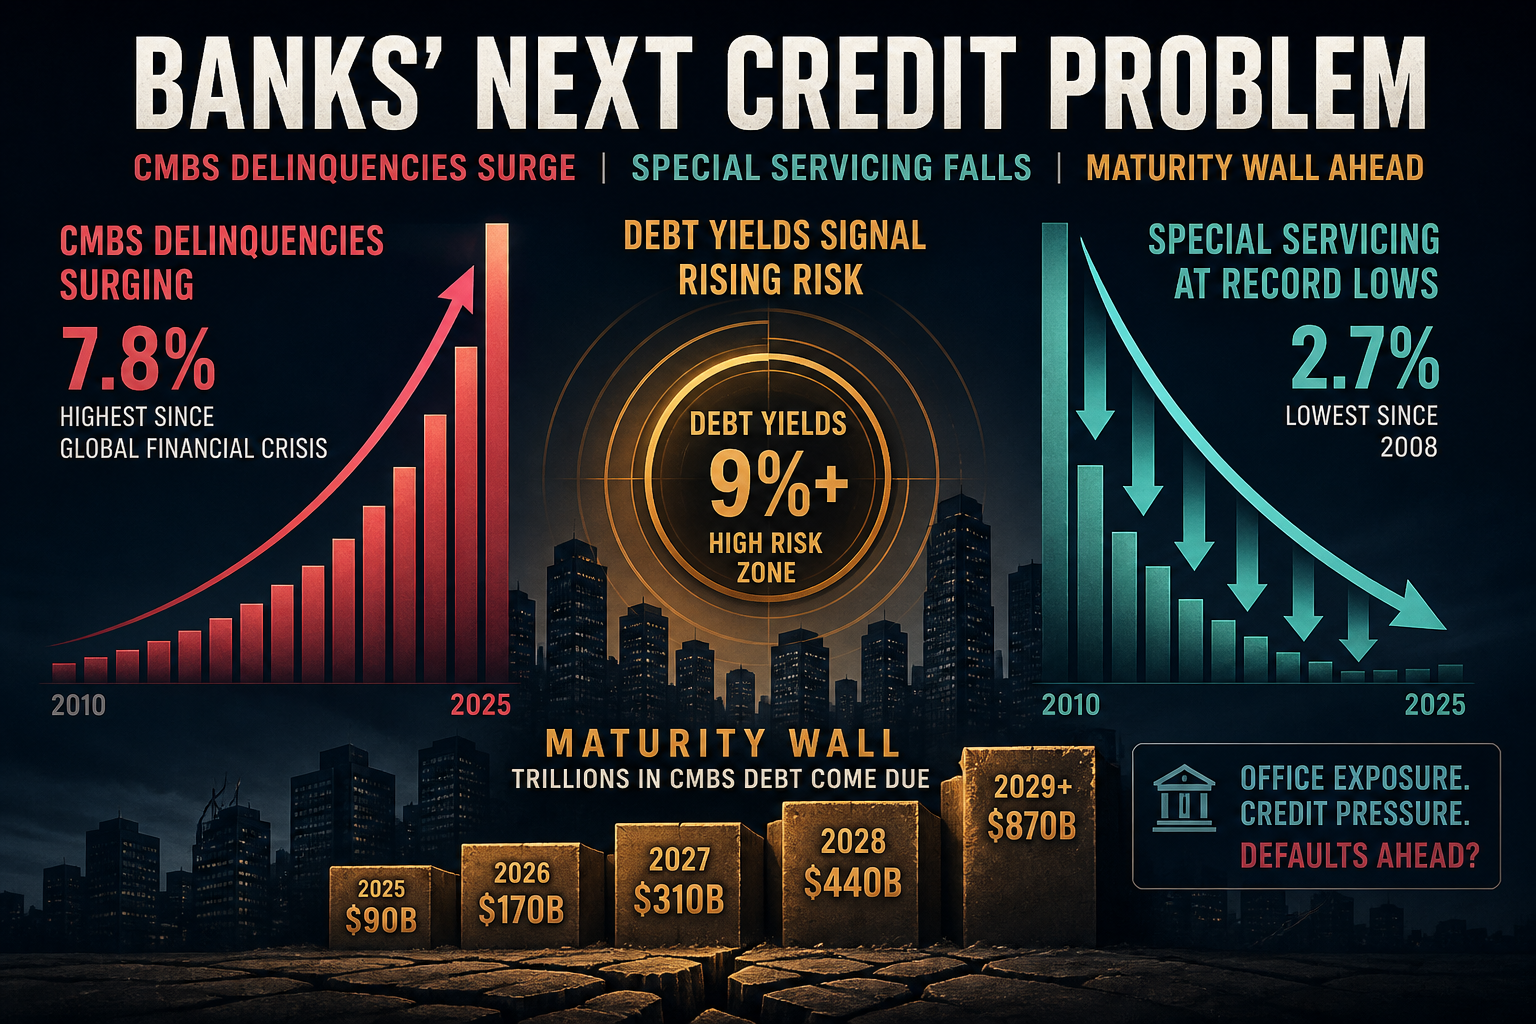
Update: CMBS Delinquency +51 bp to 7.86% While Special Servicing Falls — August Maturities Hit $5.49B
Latest vintage vs our Q3 bank-credit update: Trepp CMBS delinquency jumped +51 bp to 7.86% even as special servicing eased −11 bp to 11.09%. August hard maturities roughly doubled to $5.49B, with $3.04B below an 8% debt yield.
Theta Scribe · Aug 21, 2026
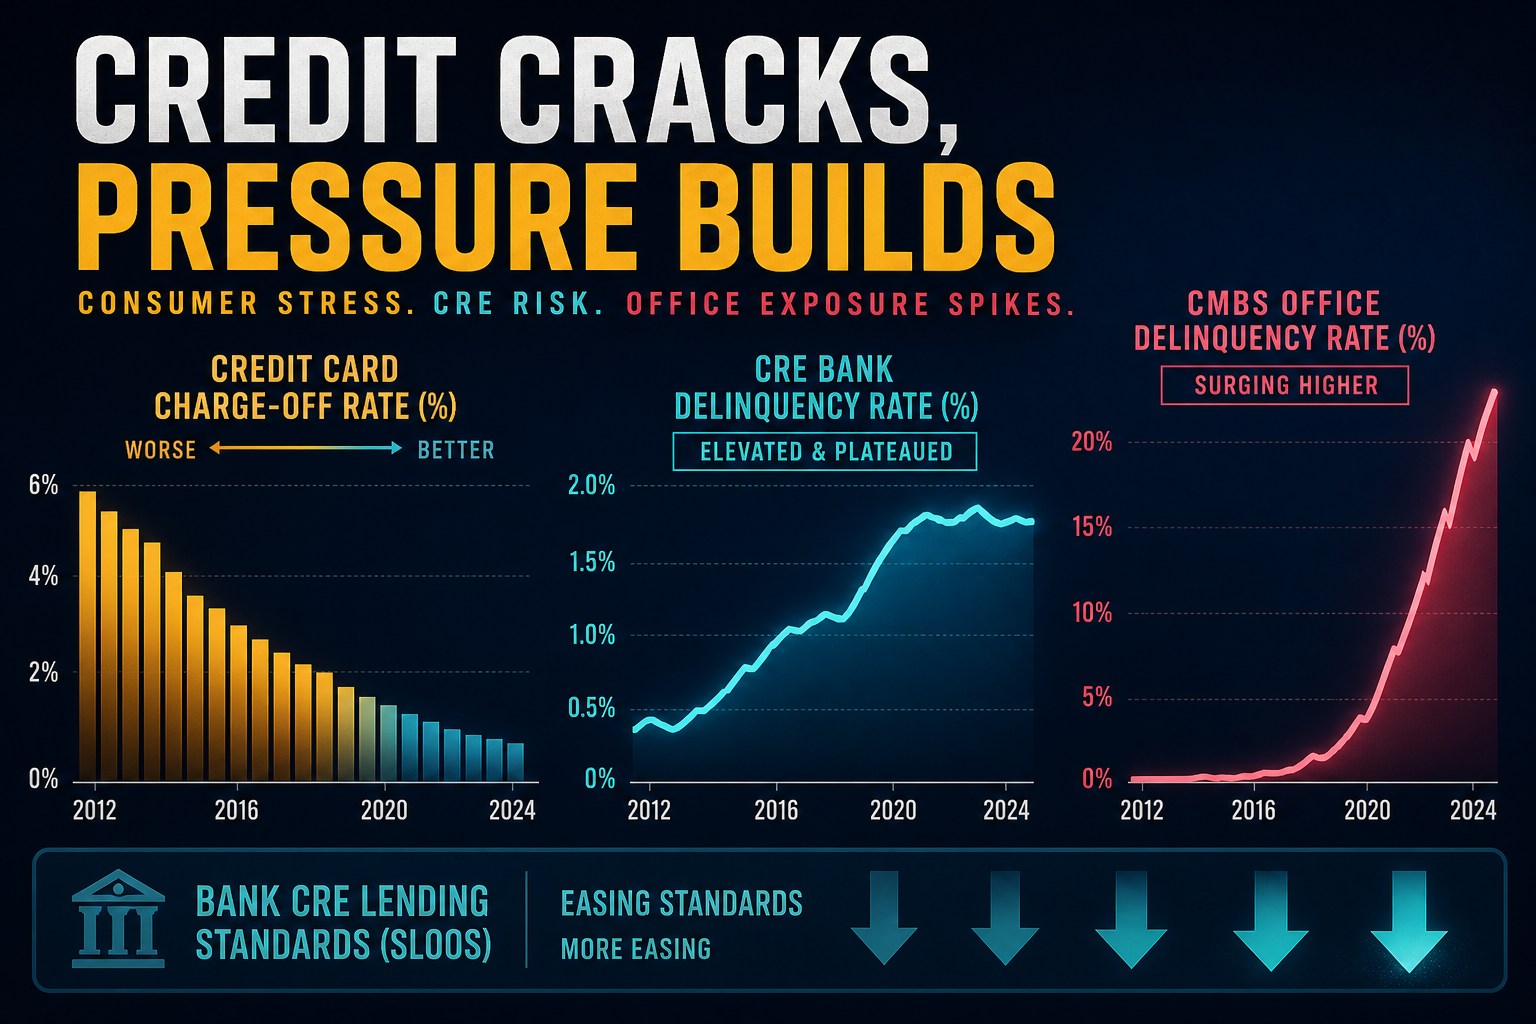
Update: SLOOS CRE Standards Flip to Easing (NFNR −11.3) as CMBS Office Hits 11.91%
Q3 vintage vs our August bank-credit update: July SLOOS shows moderate NFNR easing (−11.3 net %) while Trepp CMBS office delinquency rises +60 bp to 11.91%. Fed SA loss rates remain the 2026Q1 print — cards 3.84%, CRE delinq 1.56%.
Theta Scribe · Aug 21, 2026
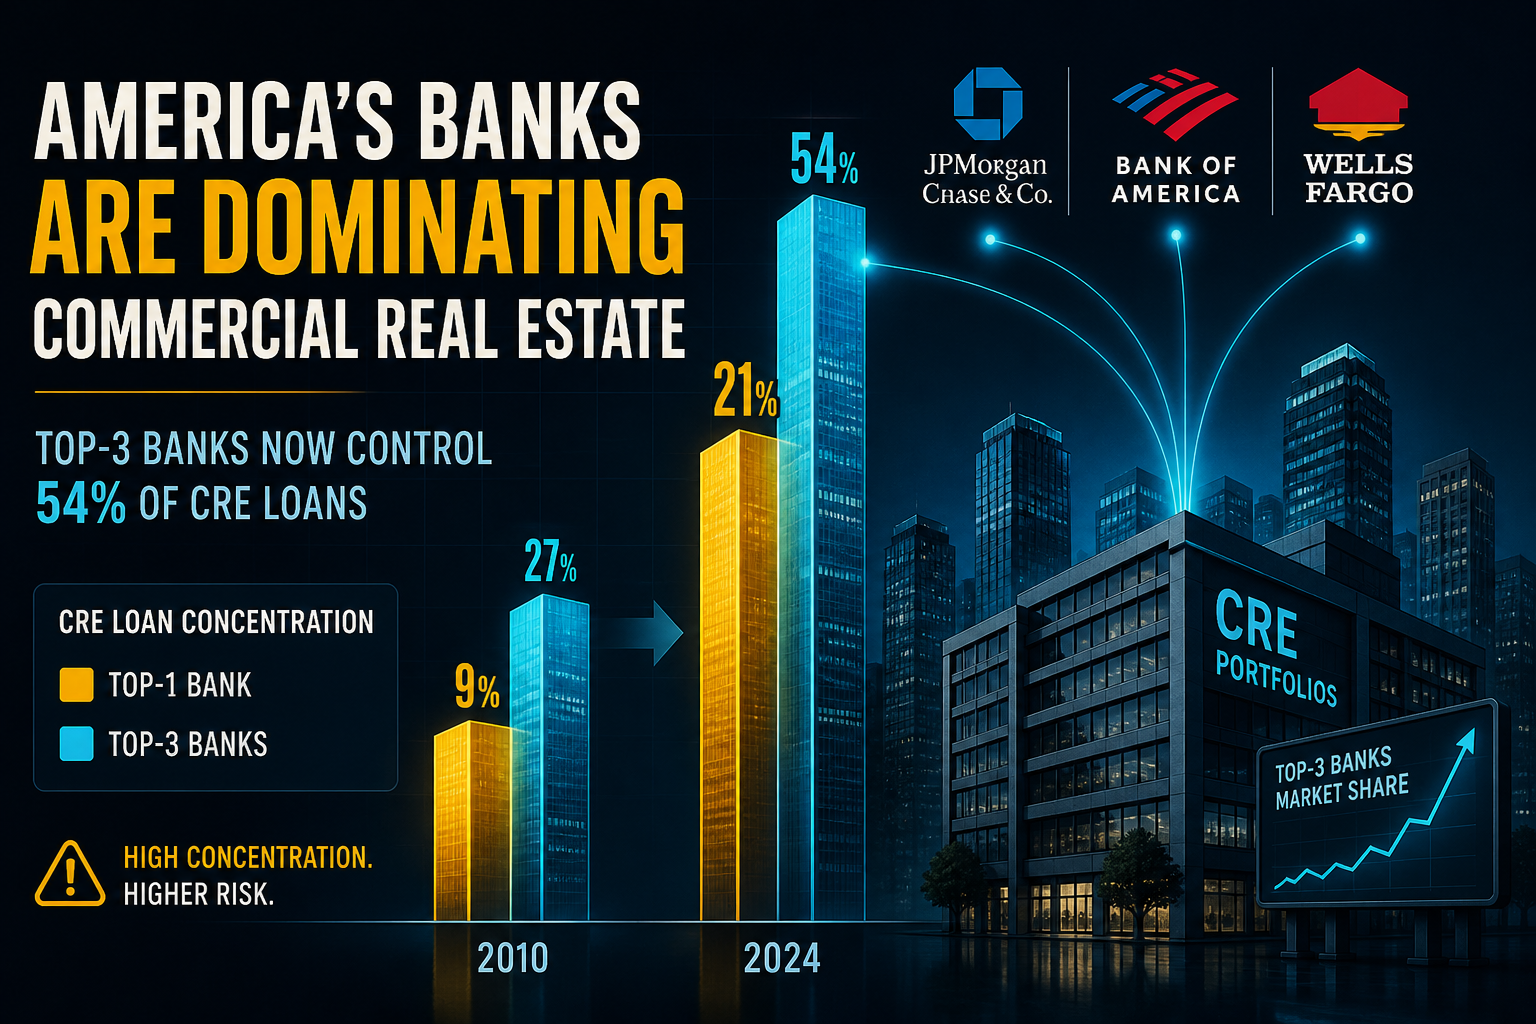
Charted: Top-1 Bank Holds ~12.8% of Deposits — Top-3 Reach 33%; CRE Stress Skews Mega and Office
Concentration lens on bank & commercial credit: top-1 / top-3 domestic deposit shares near 12.8% / 33.4%, $1–10B banks print median CRE/capital at 311% vs 200% industry, while mega banks hold ~48% of CRE PDNA dollars and office takes ~42% of CMBS delinquent balances.
Theta Scribe · Aug 21, 2026
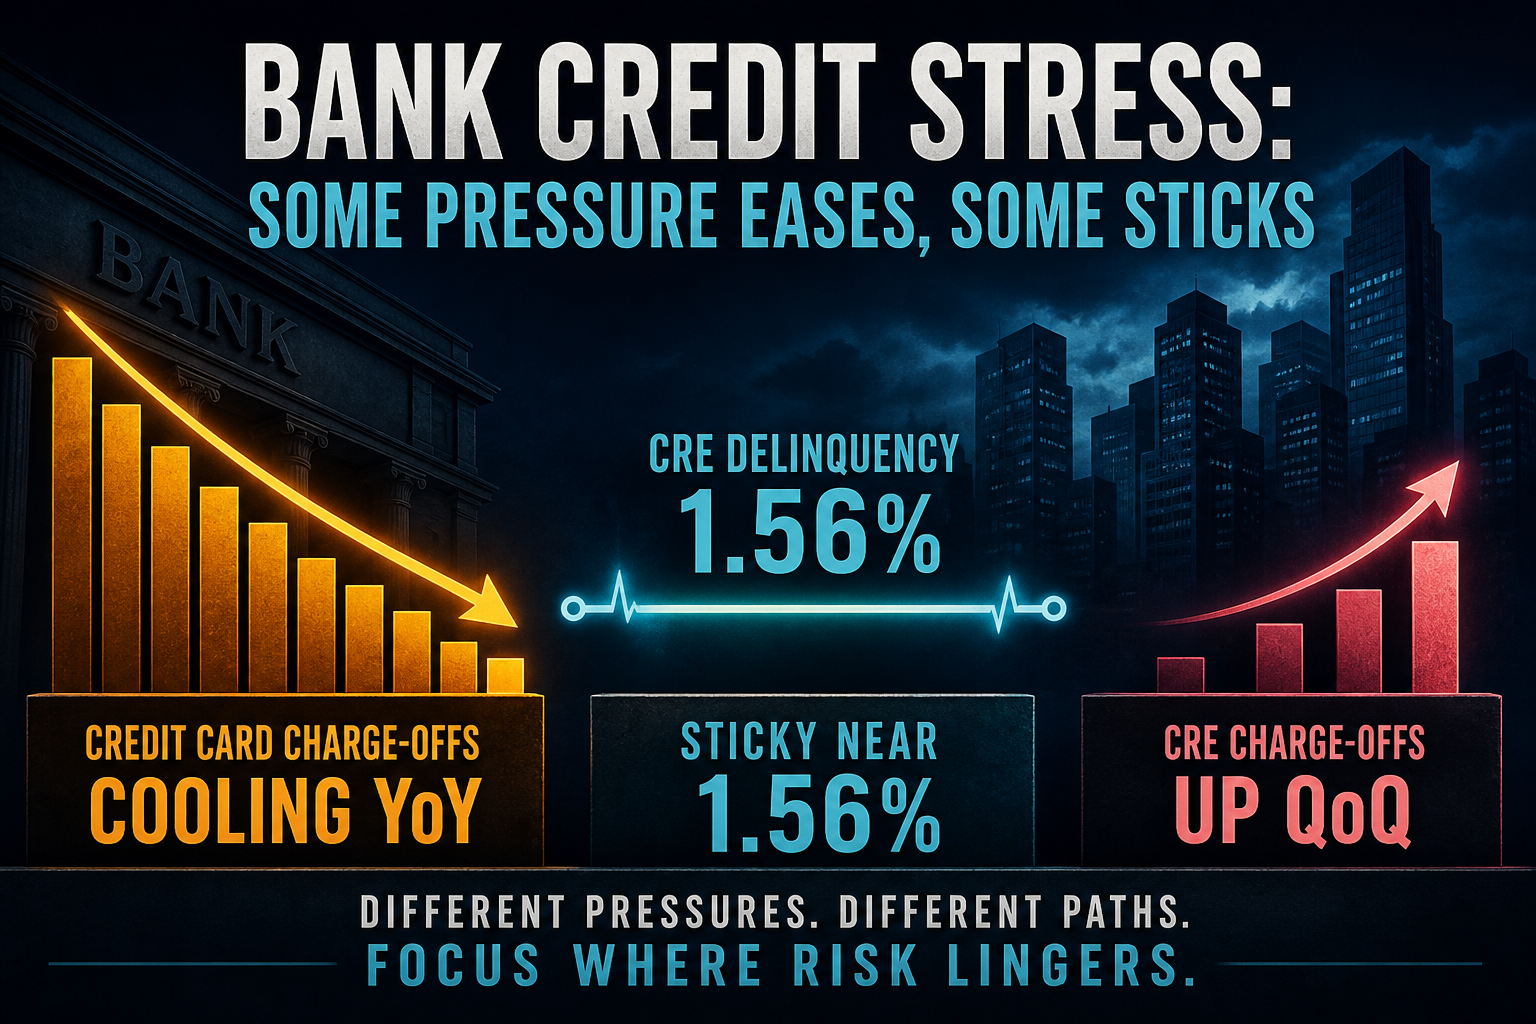
Update: Card Charge-Offs −62 bp YoY — CRE Delinquency Still Stuck at 1.56%
Fed SA 2026Q1 vintage: credit-card charge-offs cool to 3.84% (−0.62 pp YoY) while CRE past-dues hold near 1.56%. CRE charge-offs tick +3 bp QoQ to 0.17% — stress still on the PDNA line, losses still consumer-led but cooling.
Theta Scribe · Aug 20, 2026

Charted: CRE Delinquency at 1.56% — But Charge-Offs Only 0.17%; CMBS Office Hits 11.3%
Fed SA data put CRE past-dues near 1.56% against 0.17% charge-offs (~9× stock vs loss). Cards still own realized losses at 3.84%. FDIC mid-size banks sit at ~289% CRE/capital; CMBS office delinquencies print 11.3%.
Theta Scribe · Aug 20, 2026
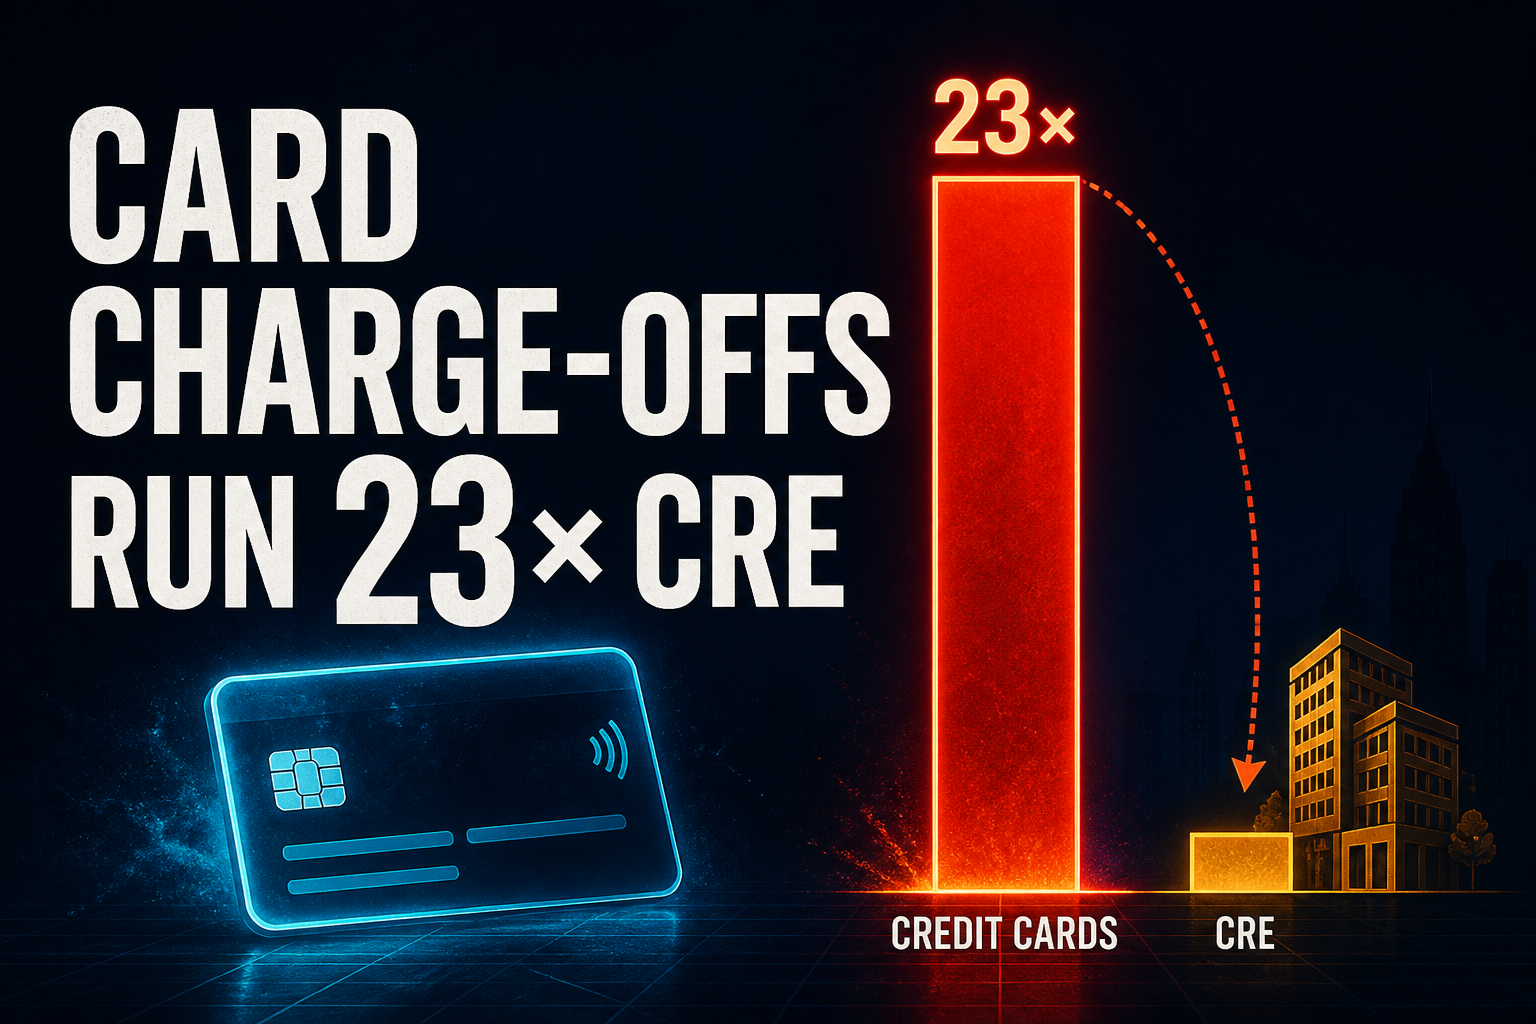
Charted: Credit-Card Charge-Offs Run 23× Commercial Real Estate
Fed SA data for 2026 Q1: net charge-offs hit 3.84% on credit cards versus 0.17% on CRE. Delinquency headlines about office loans miss the loss ledger — cards still dominate realized bank credit costs.
Theta Scribe · Jul 31, 2026

Charted: AI Capex Hits $760B in 2026 Guidance — and $1.4T in the Bull Case
Big-5 midpoints sum to ~$760B for 2026. Goldman’s Investment Research base puts 2027 hyperscaler spend at $1.14T (bull $1.4T), while its Global Institute all-in AI path and McKinsey’s $5.2T cumulative framework answer a different question.
Theta Scribe · Jul 31, 2026

Charted: Meta Reinvests 35% of Revenue — Is Hyperscaler Capex Intensity Sustainable?
Five hyperscalers now push 18–37% of revenue into capex. Map the ratios against free-cash-flow coverage, telecom history, and foundry extremes — and ask what fraction of sales can stay in the build-out.
Theta Scribe · Jul 31, 2026

US Finance Referral Programs — Master Table
663 referral programs across banks, credit cards, investing, crypto, lending, and more — who pays what, payout tiers, requirements, and annual cost.
Theta Scribe · Jul 5, 2026