
Research desk
Food & Agriculture
10 original visual essays in this beat — each with its own figure and sourced argument, not a sequel of the last chart.
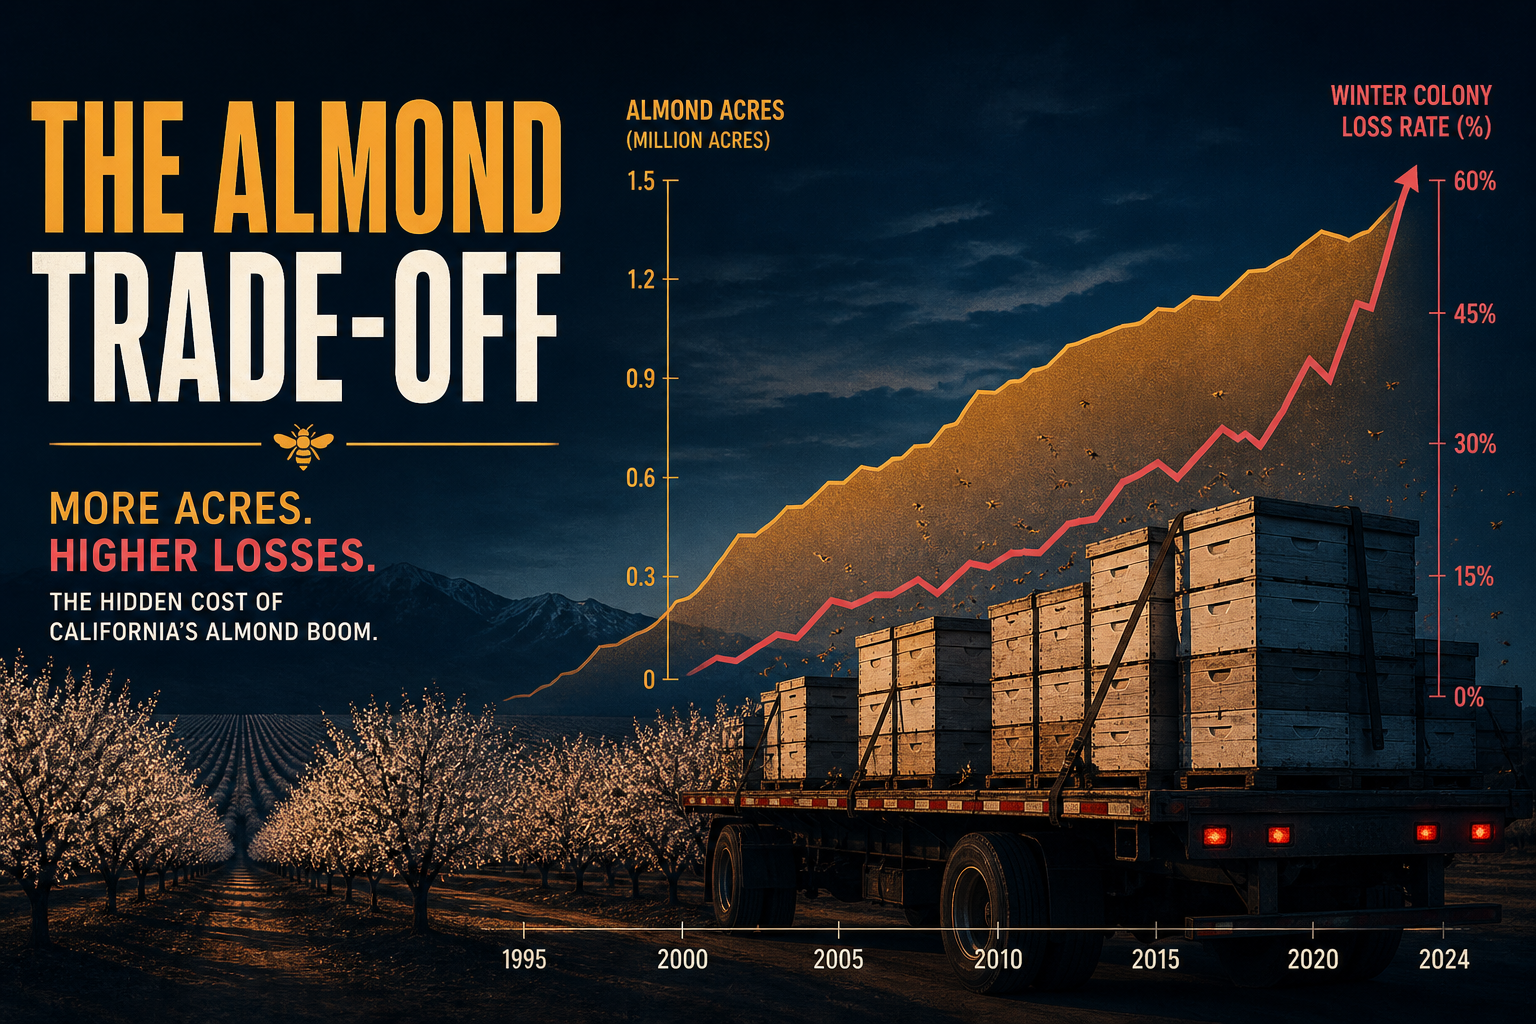
Winter Colony Loss Hit 40% as Almond Acres Still Need ~2.8M Rented Hives
BIP/AIA winter loss reached 40.2% in 2024–25 while California almond bearing acres held near 1.39 million. At a conventional 2 colonies per acre, implied hive demand (~2.78M) now exceeds the USDA Jan-1 U.S. stock (~2.63M).
Theta Scribe · Aug 30, 2026
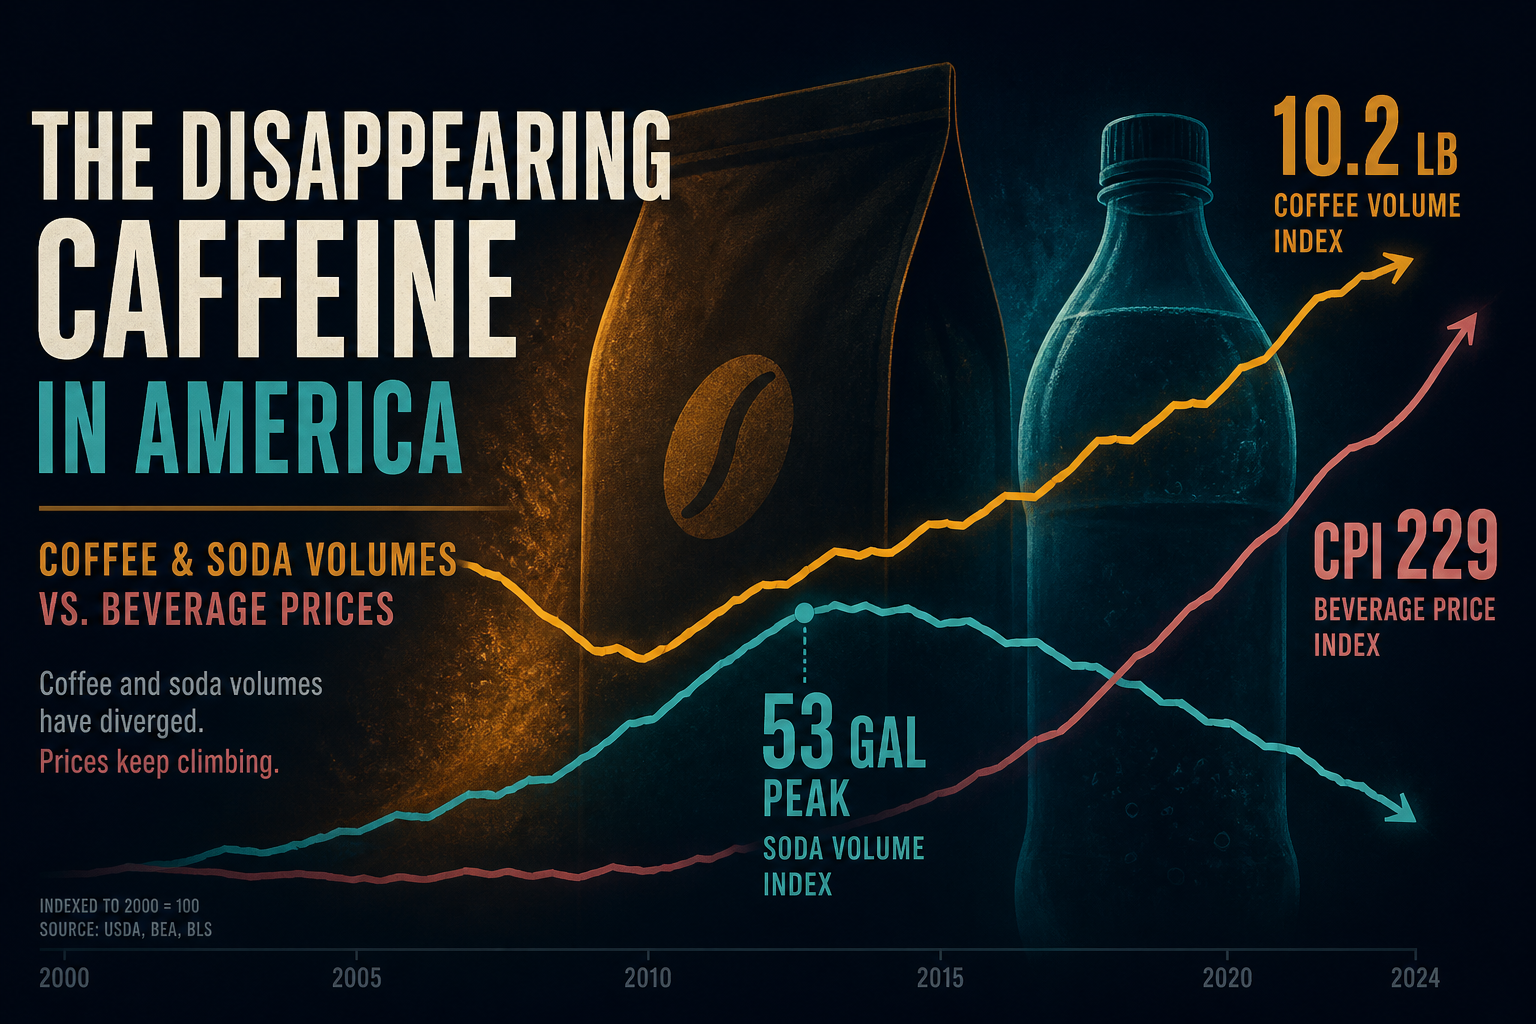
Coffee Disappearance Recovered After 1995 — Soft Drinks Peaked, Then Prices Outran Both
USDA coffee green-bean per capita rose ~30% from its 1995 trough to 2015, still below 1970. Soft-drink gallons peaked at 53 in 1997. Beverage CPI indexed to 1990 hit 229 by 2025.
Theta Scribe · Aug 26, 2026
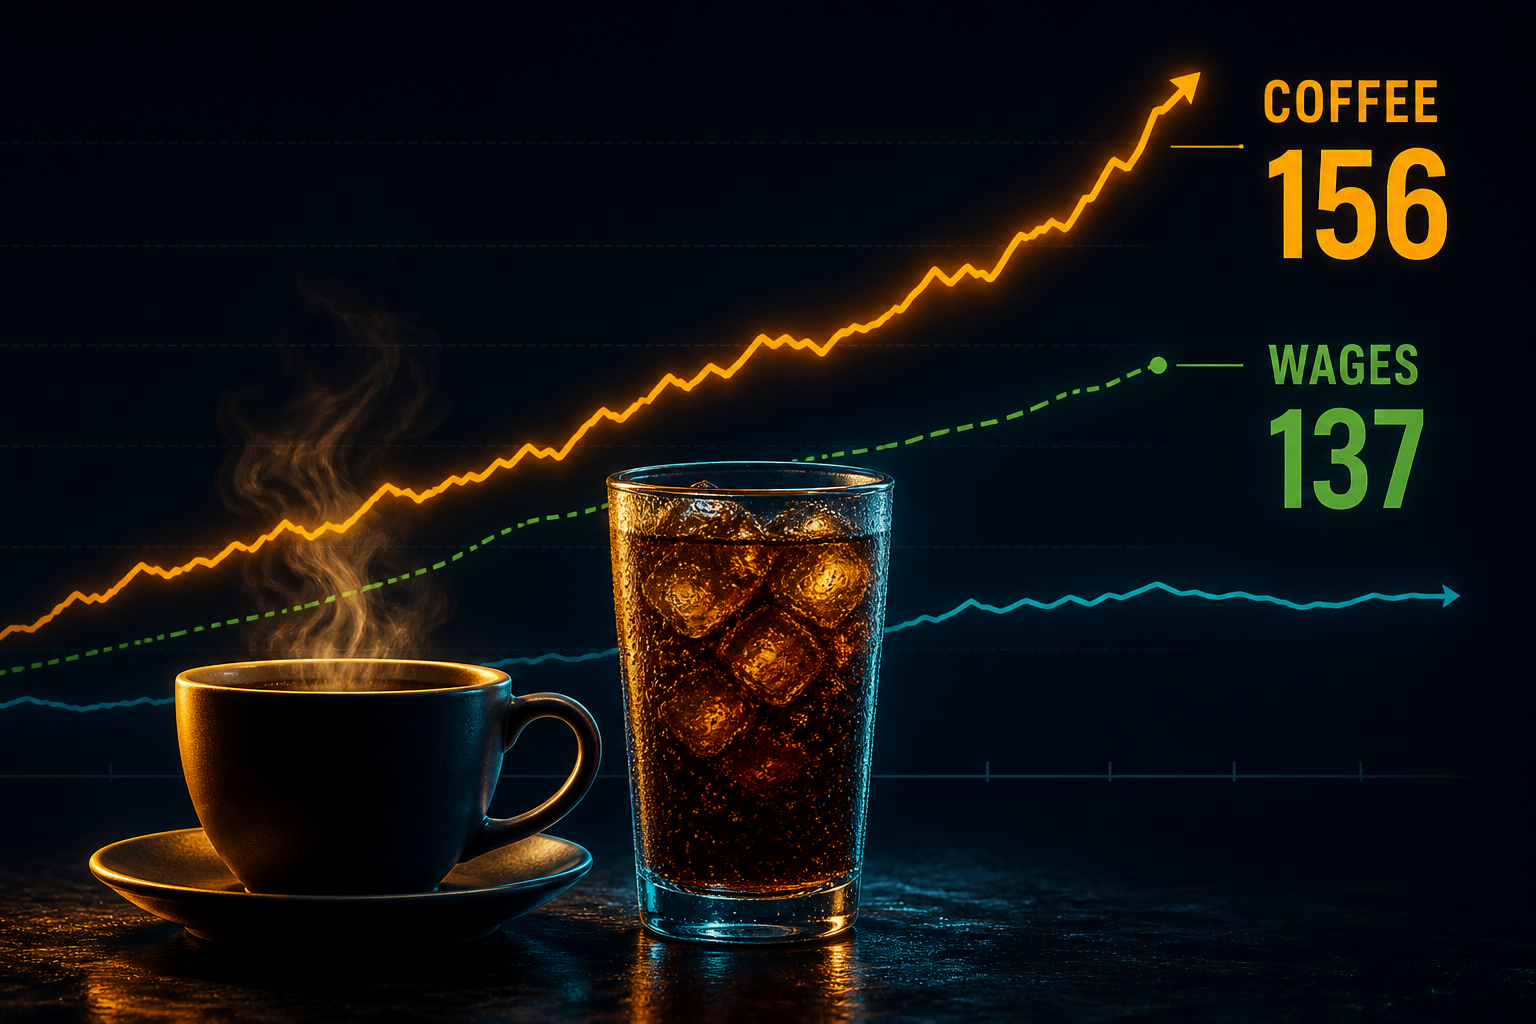
Coffee Ran 19 Points Ahead of Median Wages — Soda Still Trails Them
Since 2019, BLS coffee CPI has climbed to 156 on a wage index of 137 (2019=100). Carbonated drinks sit at 124 — cheaper relative to paychecks even after the inflation spike.
Theta Scribe · Aug 26, 2026

Charted: Northern Plains Pasture Rose 7.6% as Lake States Cropland Led at +7.3%
USDA NASS priced U.S. cropland at $5,830/acre (+4.7%) and pasture at $1,920 (+4.9%) in 2025. Northern Plains pasture and Lake States cropland led regional gains, while farm loan rates near 8% and a soft income trough tested how tightly values still track the farm economy.
Theta Scribe · Aug 25, 2026
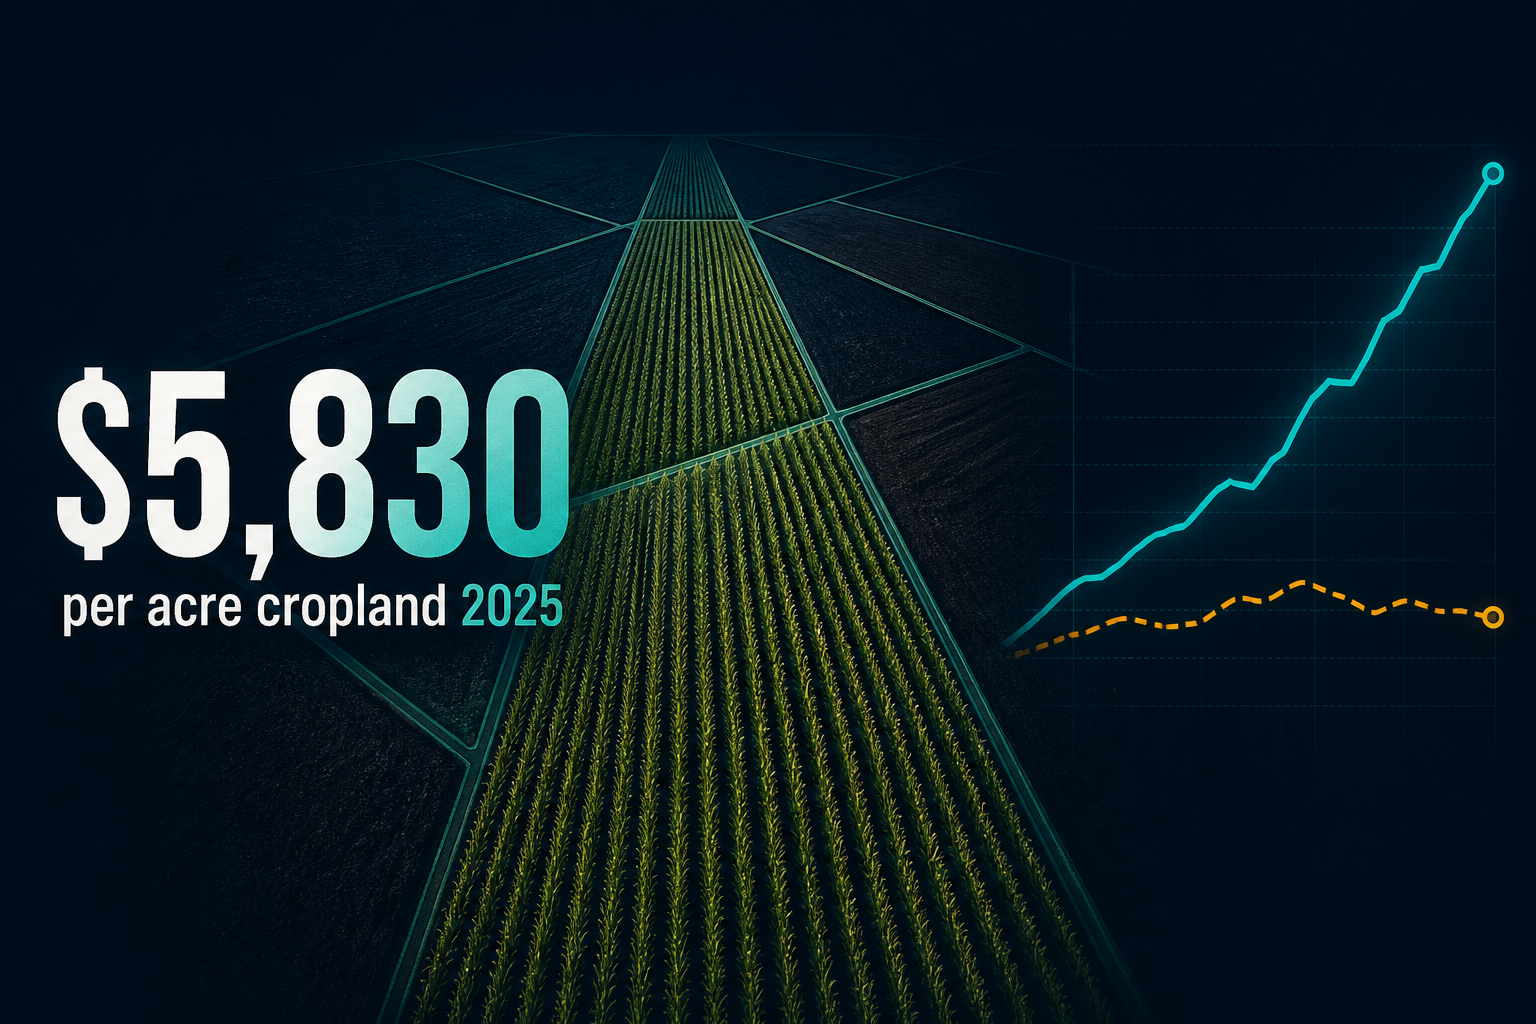
Charted: Cropland Hit $5,830/Acre While Net Farm Income Stays ~19% Below Its 2022 Peak
USDA NASS put 2025 U.S. cropland at $5,830 per acre (+4.7%). Lake States led regional gains; Northern Plains and the Corn Belt show the widest estimated gaps between land appreciation and farm-income pressure — and a +100 bp yield shift implies roughly a 26% haircut to the national average.
Theta Scribe · Aug 25, 2026
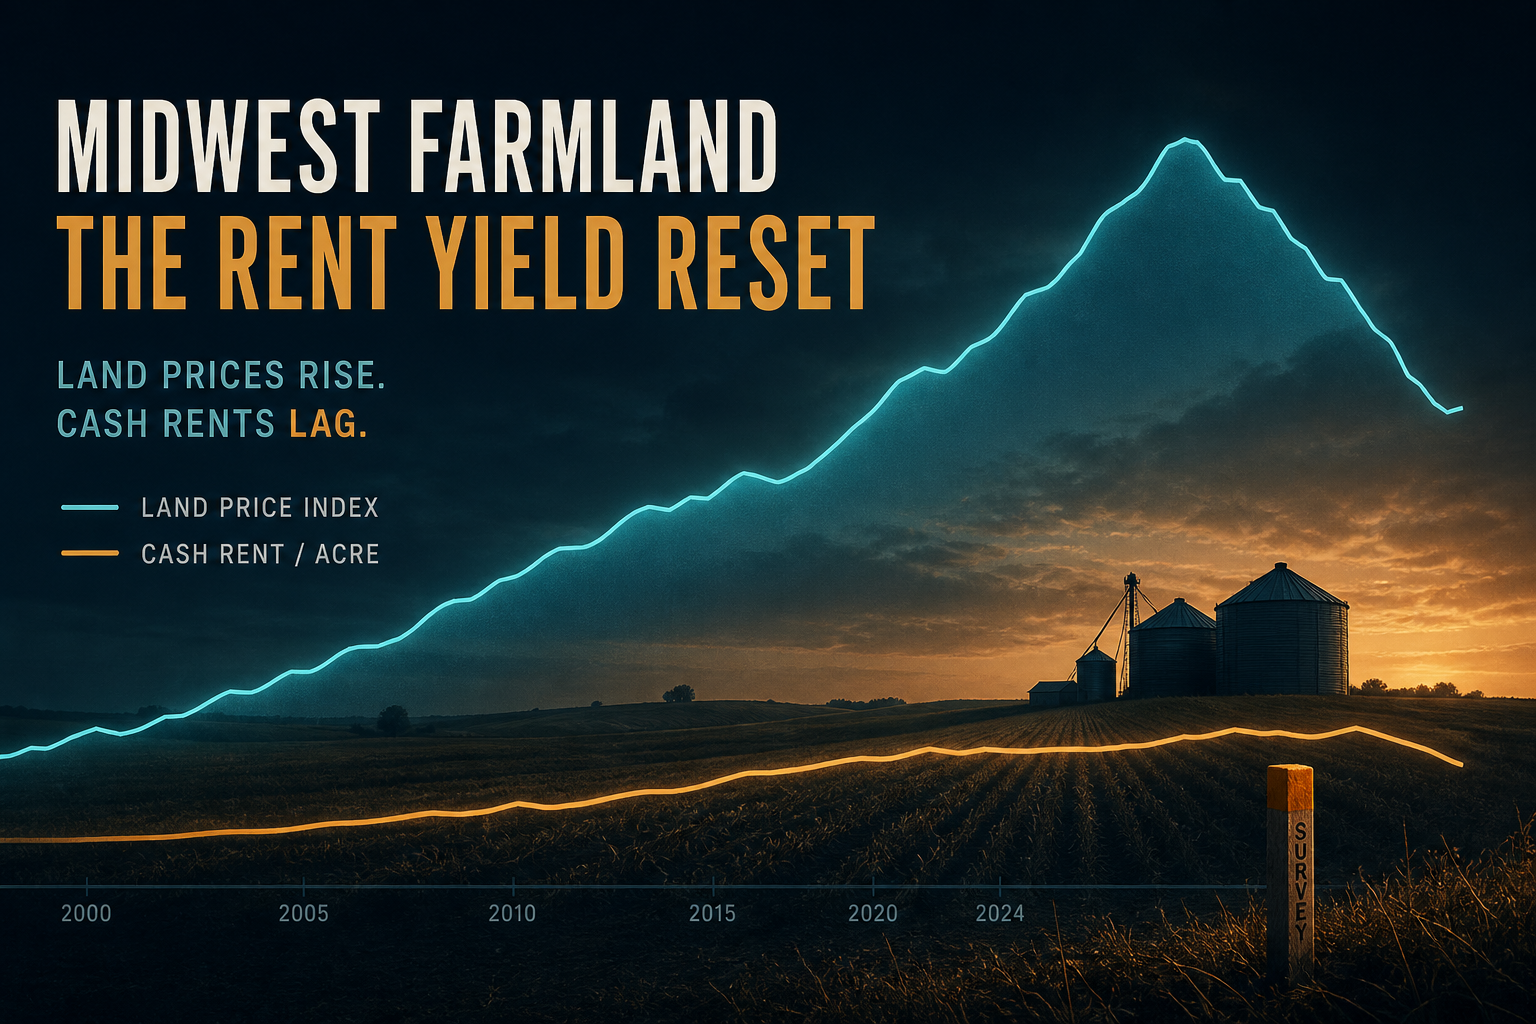
Charted: U.S. Cropland Rent Yields Compressed 0.48 pp as Land Prices Outran Cash Rents
USDA NASS cash rents rose 14% from 2021 to 2025 while cropland values jumped 34%. The implied rent yield fell from 3.24% to 2.76%. Nebraska’s −0.91 pp compression led a Northern Plains / Lake States pack where appreciation demand outpaced farming returns.
Theta Scribe · Aug 25, 2026
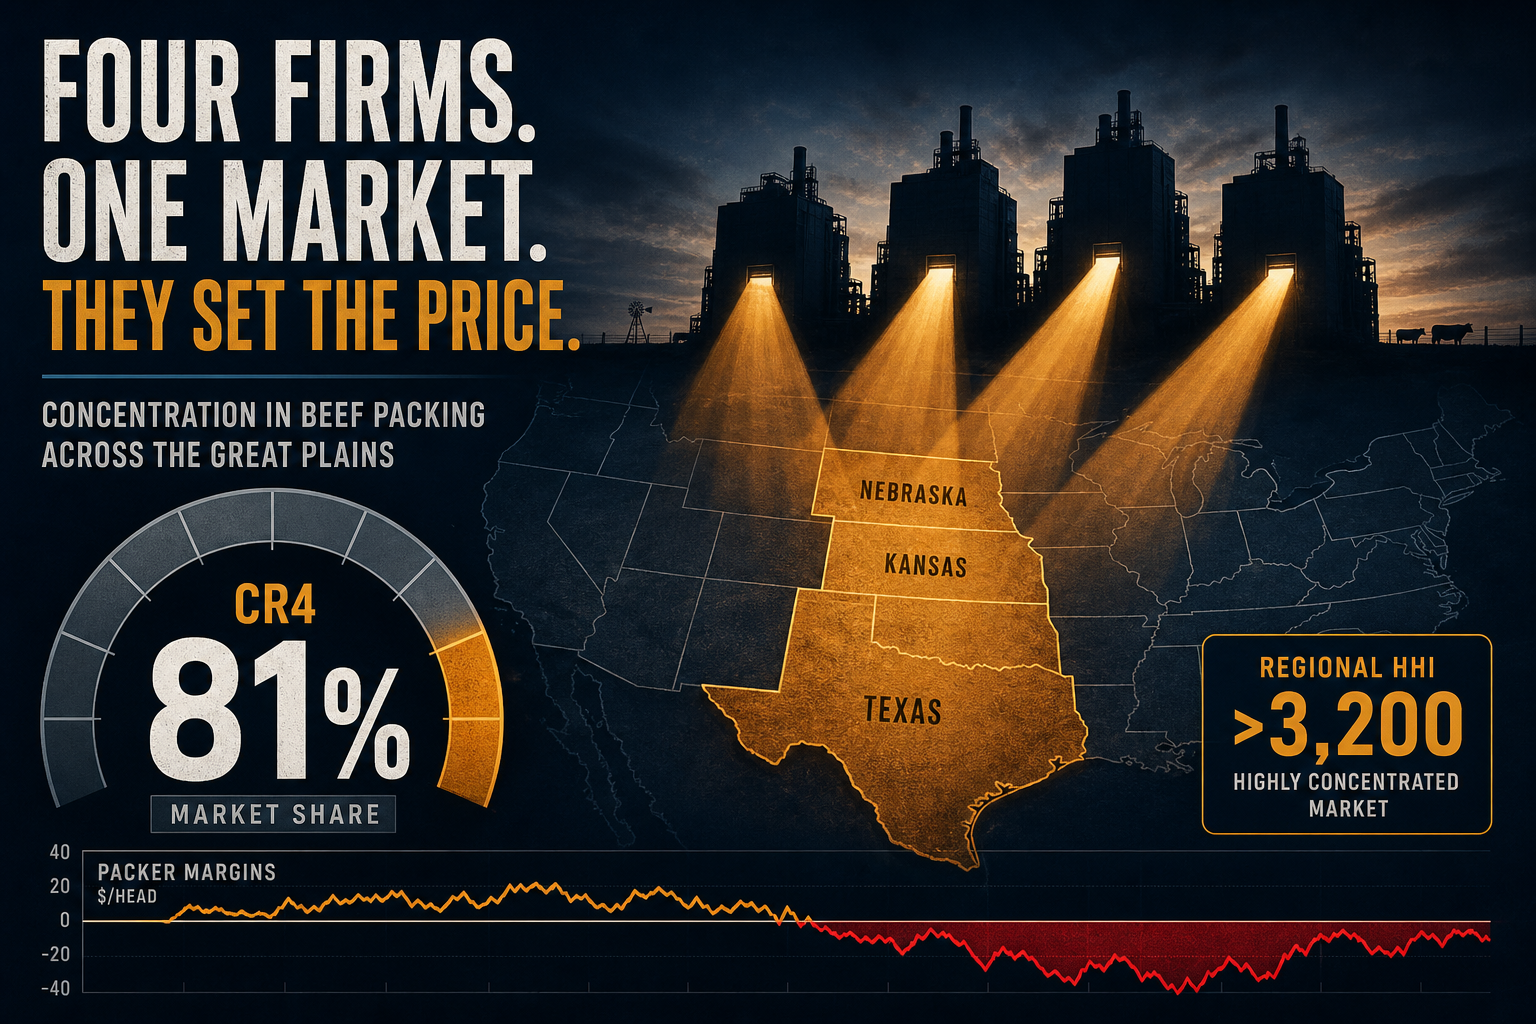
Charted: Four Firms, 81% of Fed Cattle, and the Regions Where the Market Gets Even Tighter
Exhibit A: national steer-and-heifer CR4 near 81% per USDA PSD. Exhibit B: Texas–OK–NM procurement HHI above 3,200 in 2021. And the margin ledger flipped from +$114/head in 2023 to −$141 in 2025 while the herd contracted.
Theta Scribe · Aug 23, 2026
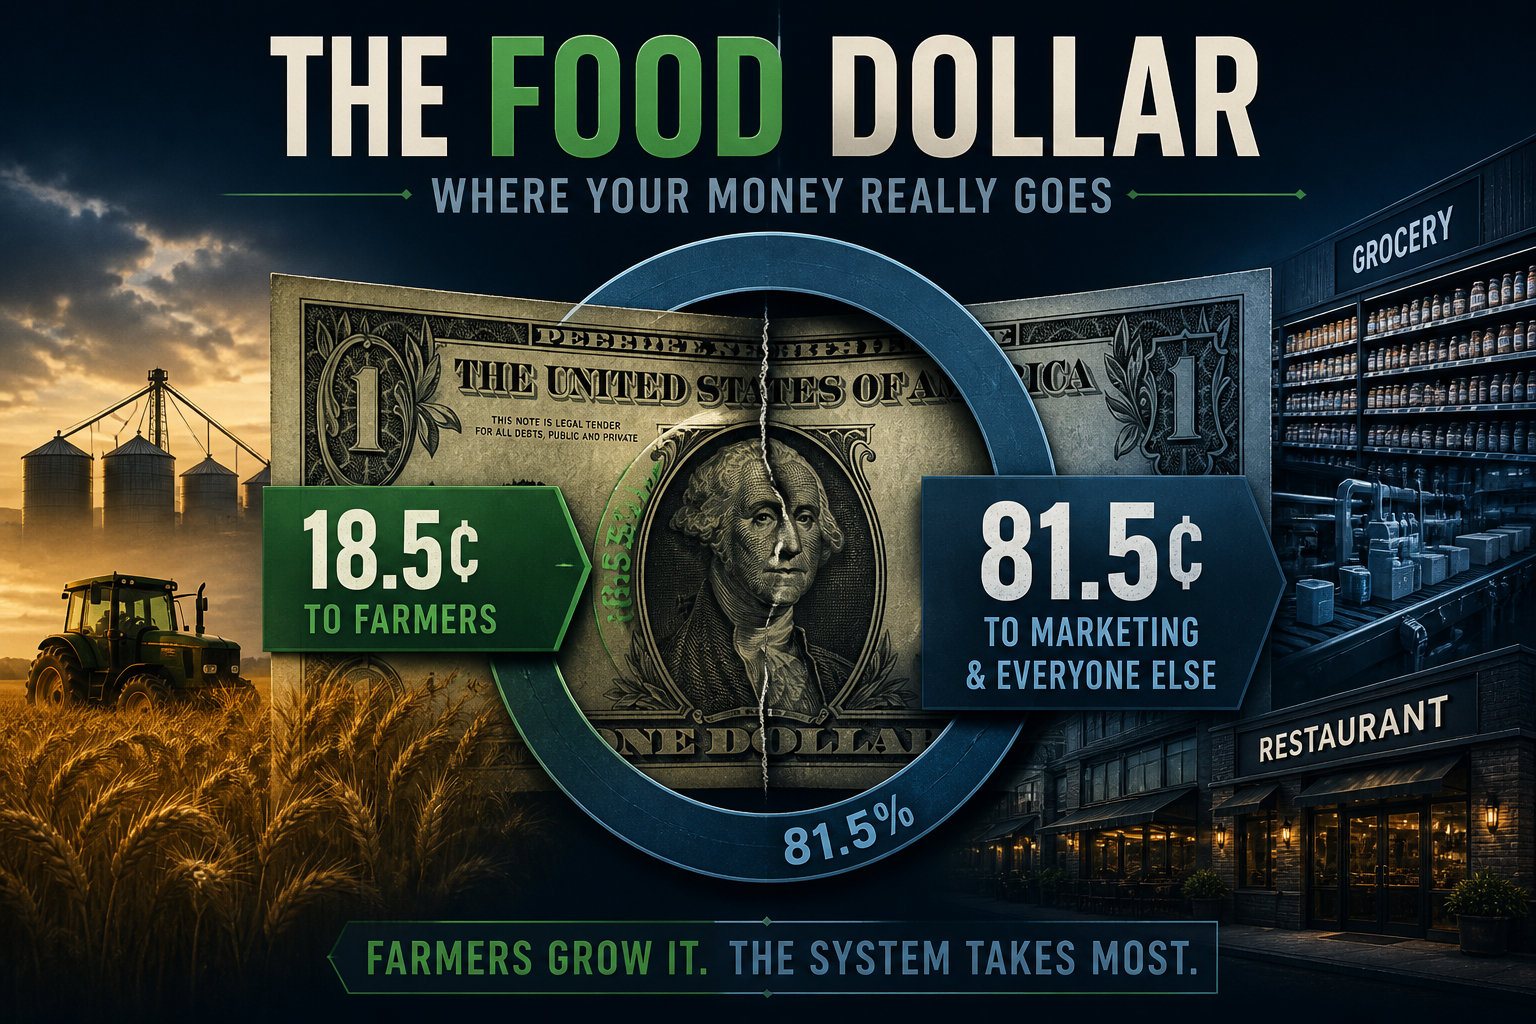
Charted: Only 18.5¢ of the Grocery Dollar Reaches the Farm — Marketing Still Takes the Rest
USDA ERS's revised Food Dollar puts the 2024 food-at-home farm share at 18.5¢ (up 0.1¢). The all-food farm share fell to 11.8¢ as dining-out grew — and farm-gate egg PPI still swings far harder than grocery CPI.
Theta Scribe · Aug 23, 2026
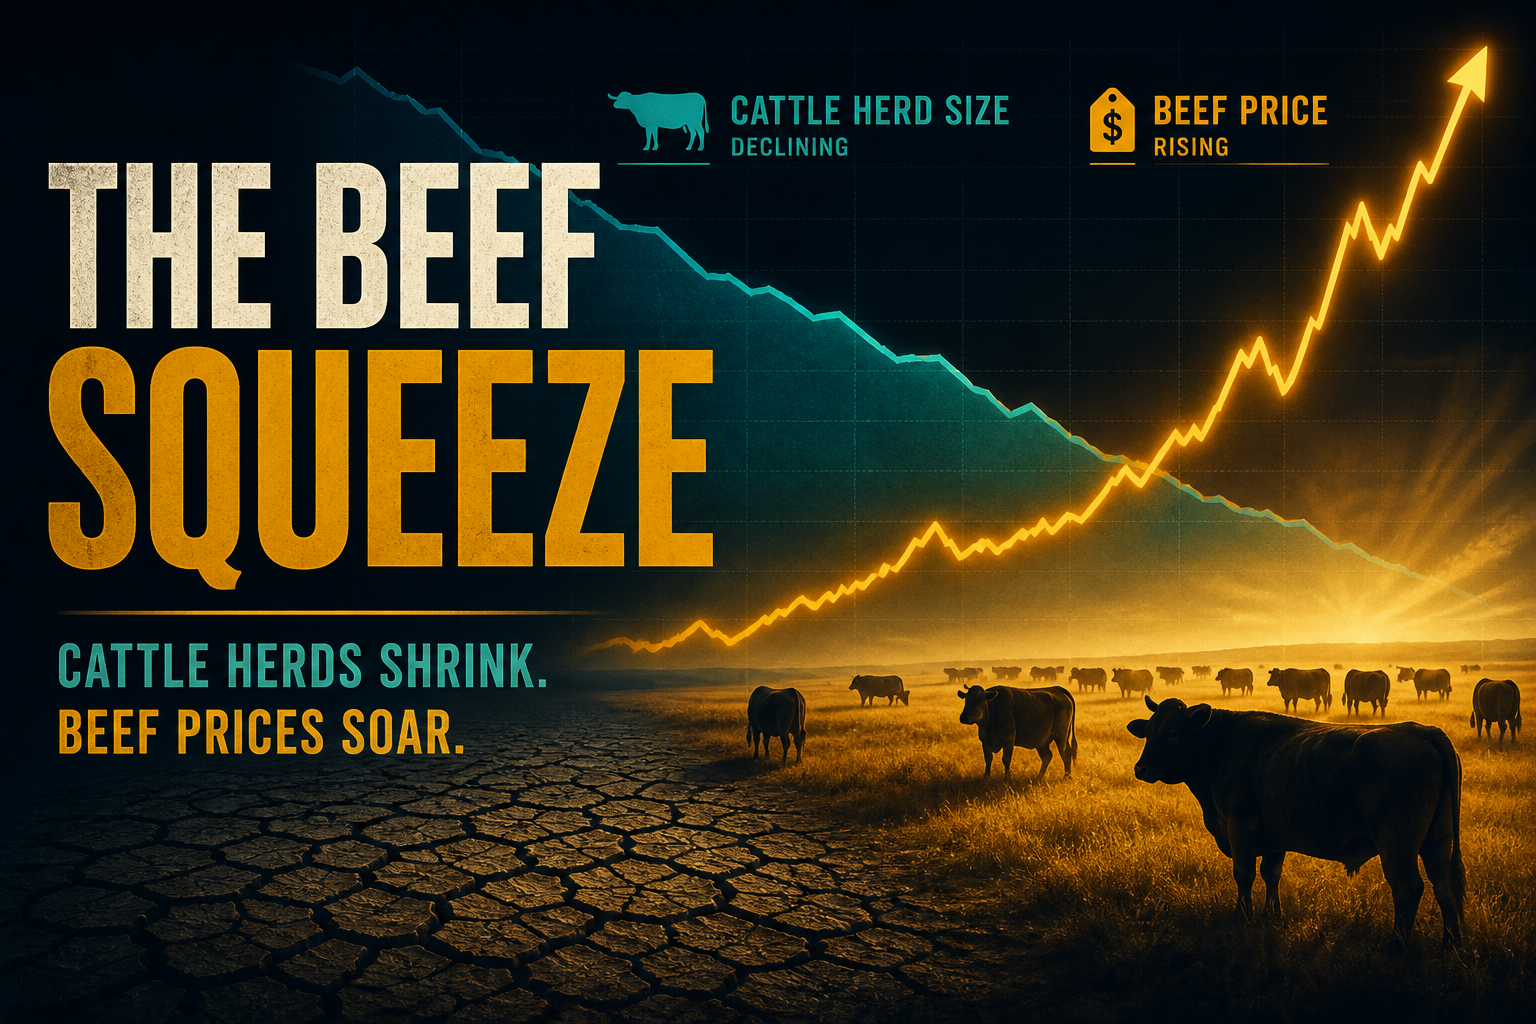
Charted: US Cattle Herd at a 75-Year Low — How Liquidation Maps Onto Beef Prices
NASS puts Jan 1, 2026 all-cattle inventory at 86.2 million head — the lowest since 1951. Beef cows sit at 27.6 million. Drought-driven liquidation still shows up in retail beef values near record territory while replacement heifers print a fragile +1% rebuild cue.
Theta Scribe · Aug 23, 2026
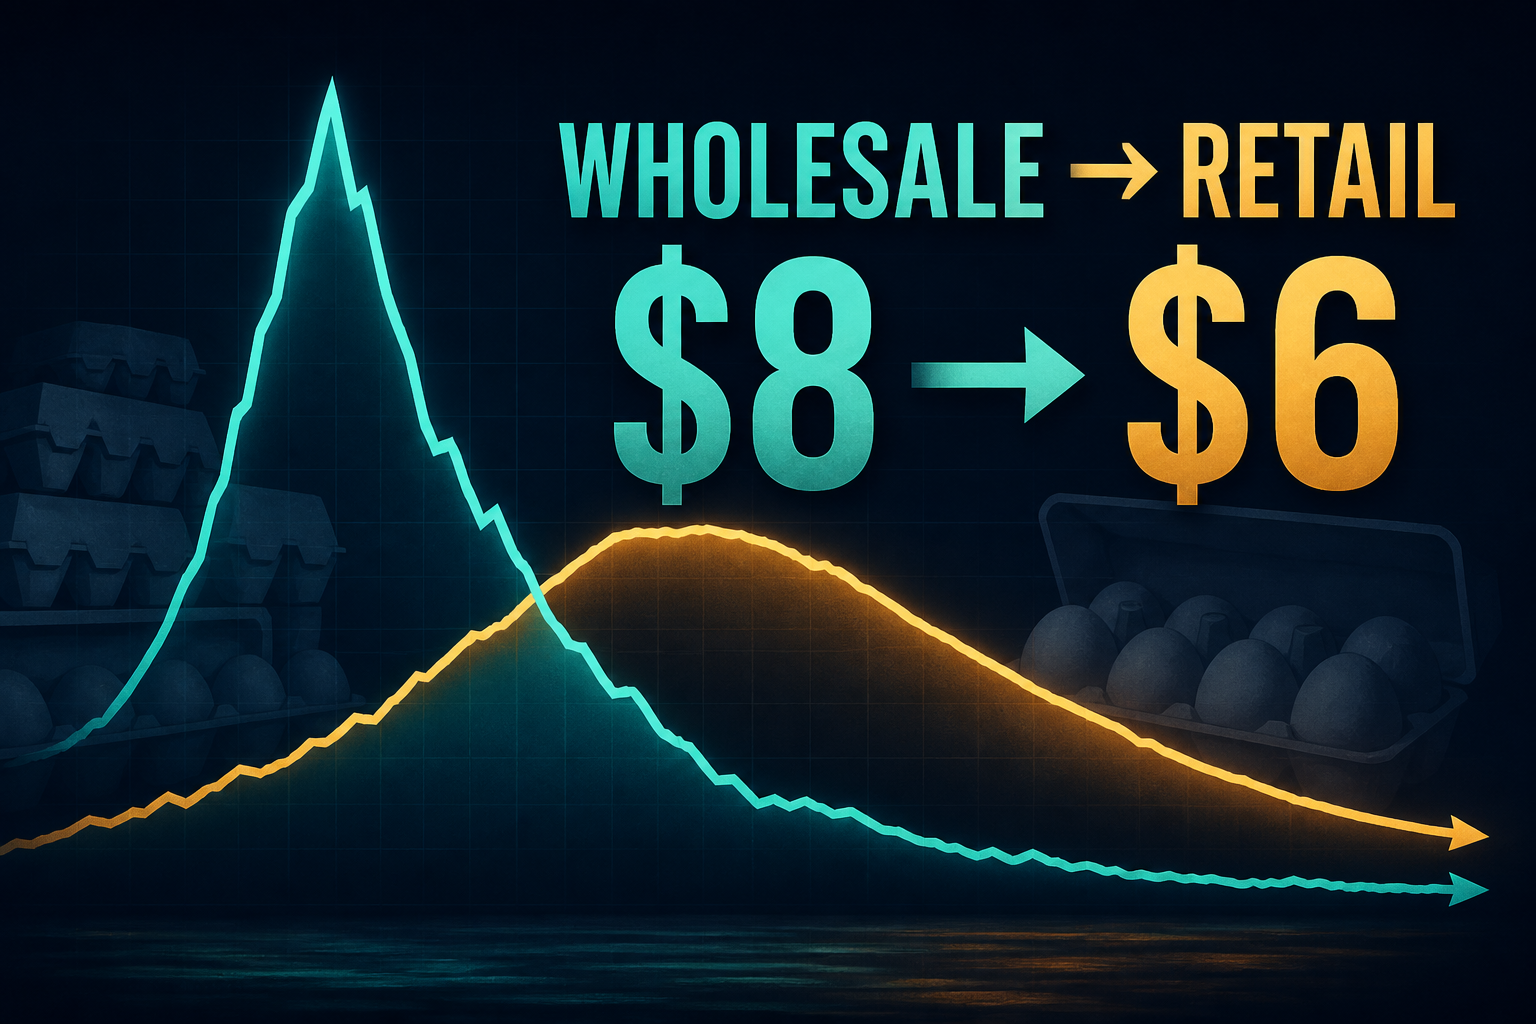
Charted: Egg Wholesale Spikes Hit Shelves Late — and Unwind Slower Still
In the 2025 HPAI crest, AMS national loose wholesale peaked near $8.05/doz while BLS retail hit $6.23 about four weeks later. Wholesale then fell ~30% Mar→Apr; retail dropped only ~18% in the first month of unwind.
Theta Scribe · Aug 23, 2026