
Research desk
Health Economics
17 original visual essays in this beat — each with its own figure and sourced argument, not a sequel of the last chart.
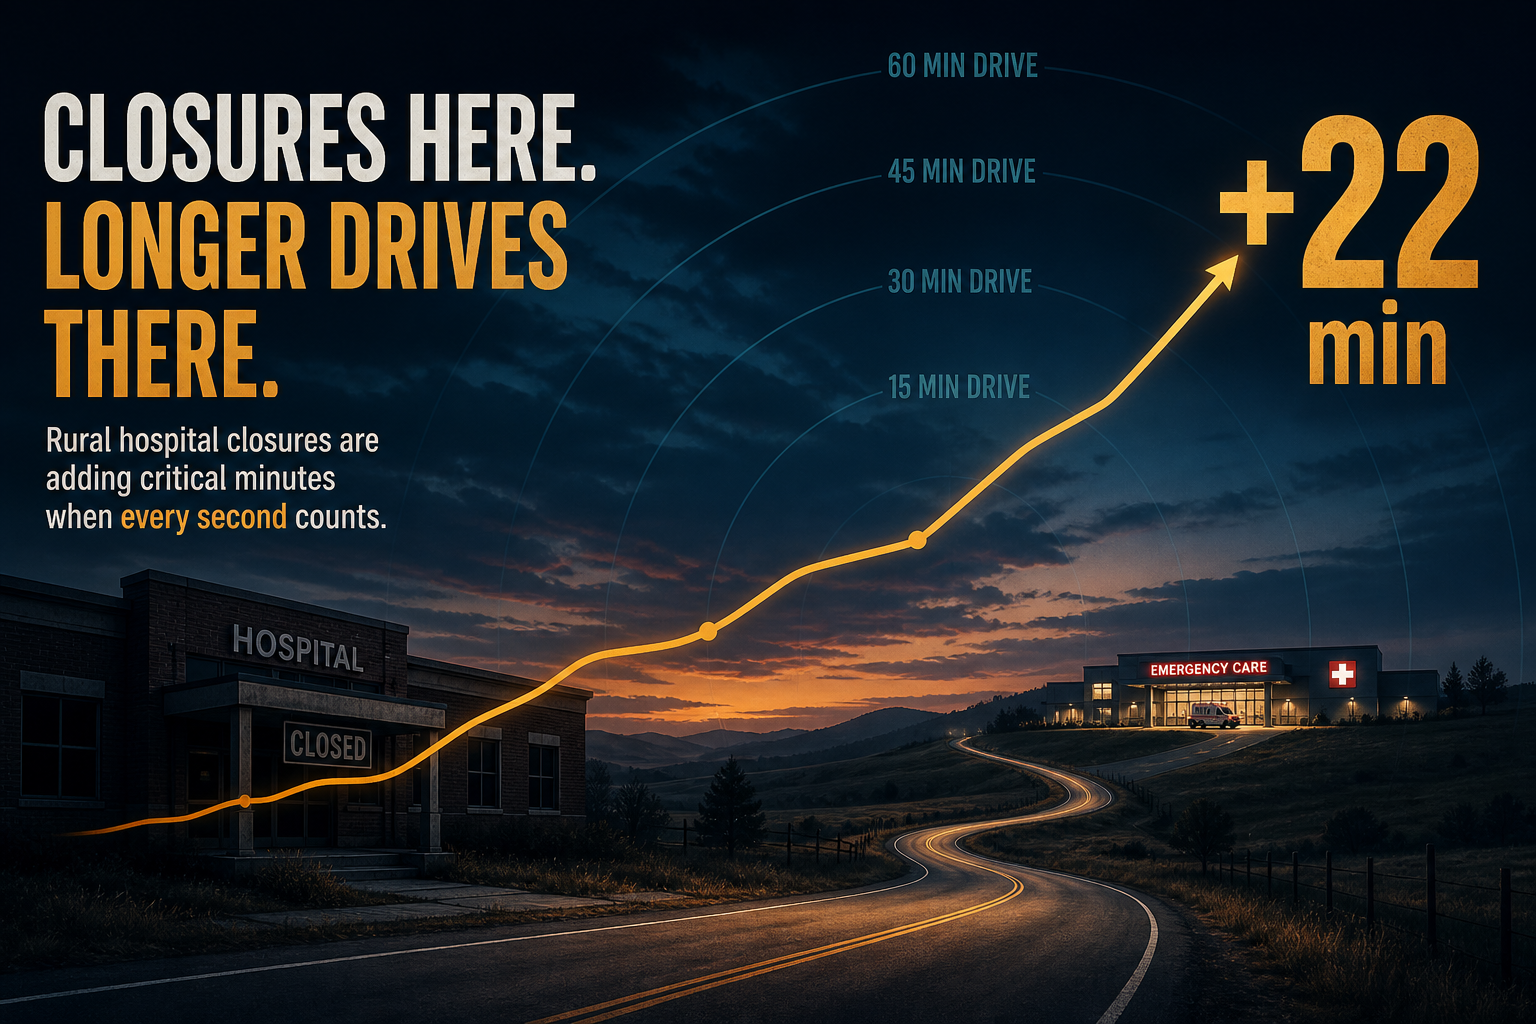
Charted: Rural Hospital Closures Since 2005 — How Many Extra Minutes to the Nearest ED?
UNC Sheps Center counts 197 rural hospital closures and conversions since 2005. Across mapped counties that lost their nearest hospital, desk road-network joins put the median added drive to an open emergency department at about 22 minutes — and 38% of those counties face 30 minutes or more.
Theta Scribe · Aug 28, 2026

Turnover vs Staffing Stars: Nurse-Aide–Heavy Churn Tracks CMS Ratings Across States
CMS Care Compare puts nursing staff turnover near 46% nationally. Homes rated 1★ average 54.7% churn versus 37.5% at 5★. Across states, aide-heavy turnover correlates about −0.74 with mean staffing-domain stars — partly by design, since turnover is scored inside the staffing rating.
Theta Scribe · Aug 26, 2026
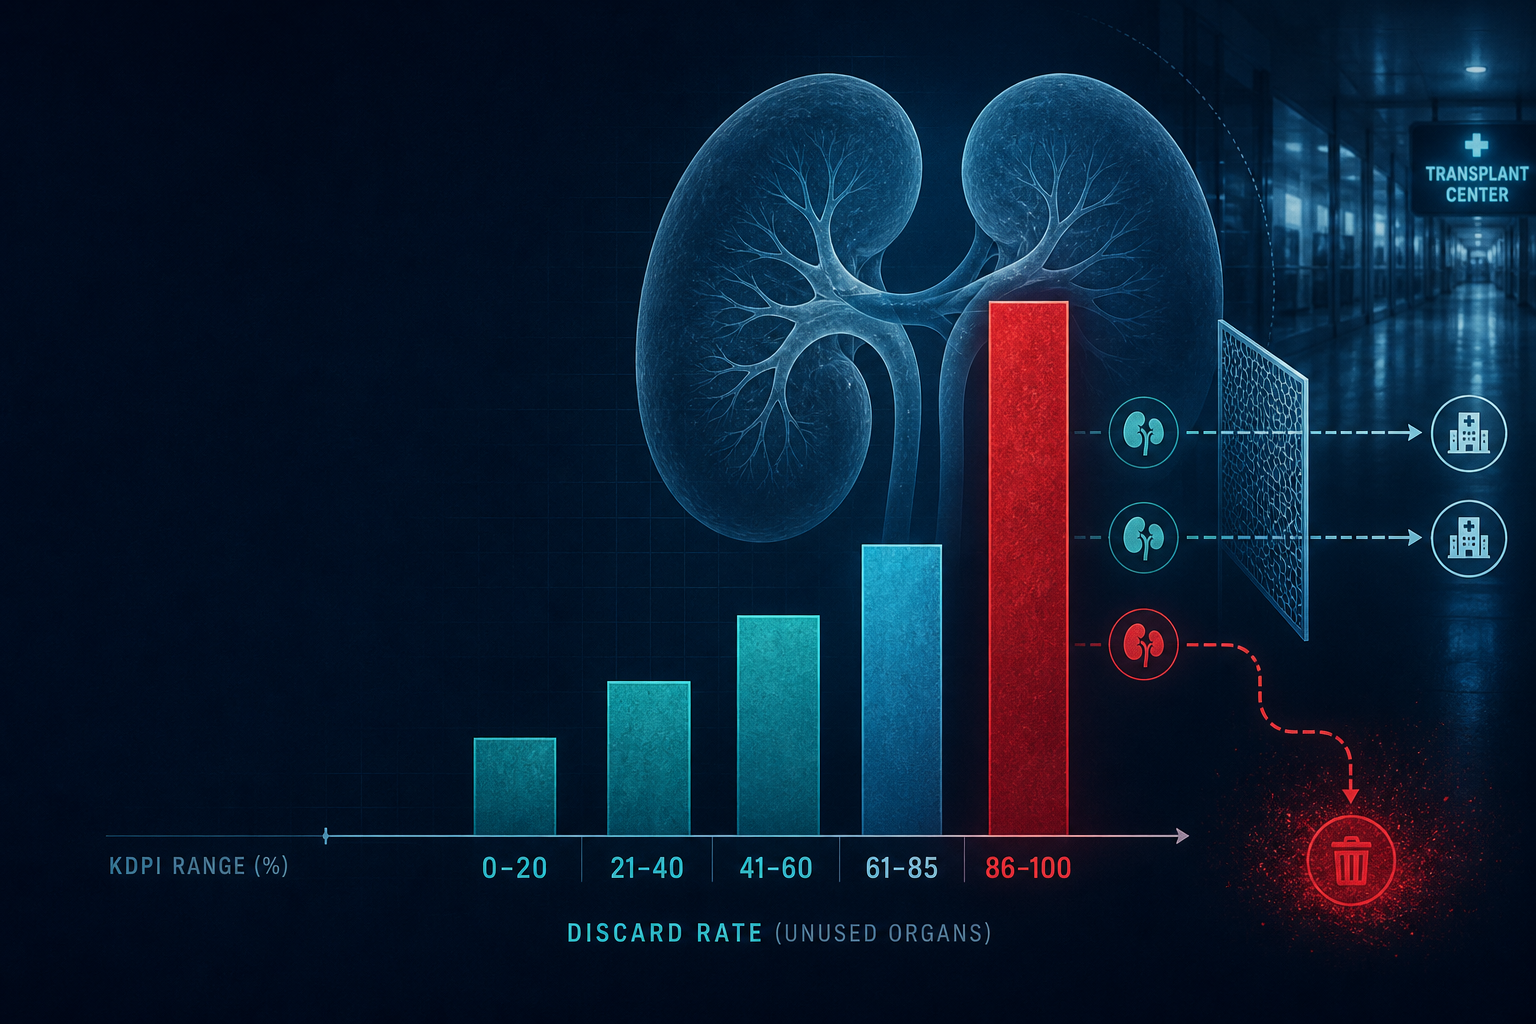
Kidney Discard Did Not Fall With Offer Filters: KDPI ≥85% Nonuse Still Near 70%
OPTN/SRTR nonuse of recovered deceased-donor kidneys rose to 29.3% in 2024 even as Offer Filters spread to roughly 60% of programs. High-KDPI organs remain the bottleneck—about 69.5% unused—while low-KDPI discard stays near 4%.
Theta Scribe · Aug 26, 2026
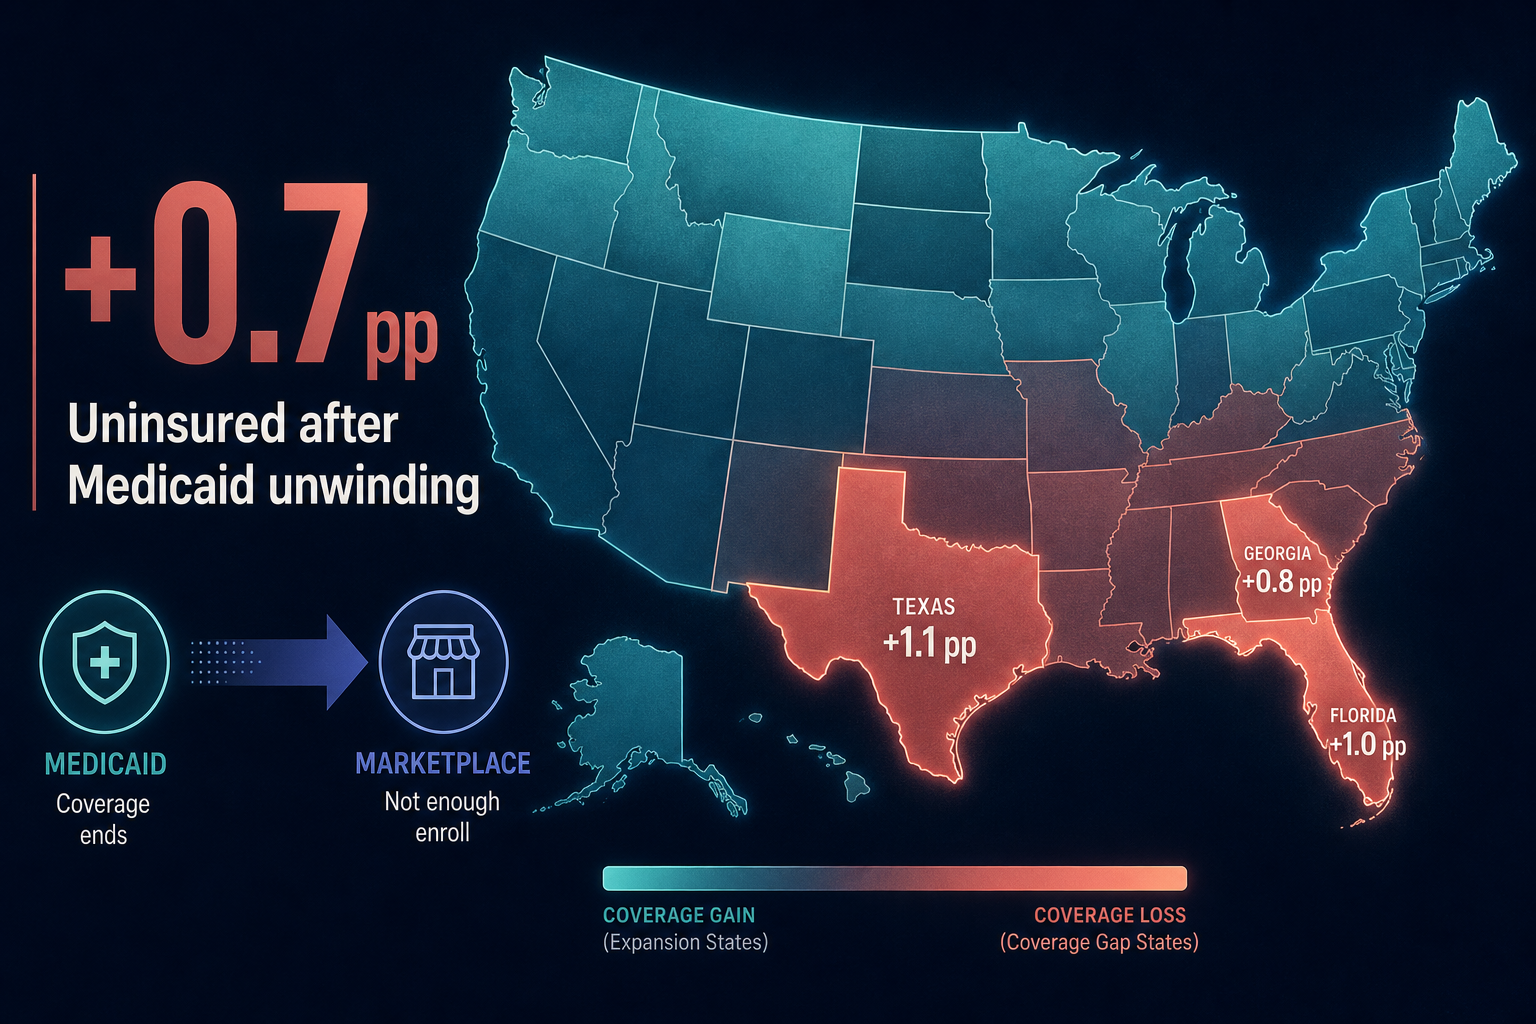
Charted: Uninsured Rates Climbed After Medicaid Unwinding — Coverage-Gap States Led the Rise
Under-65 uninsured rates rose from about 8.0% in 2022 to 8.7% by 2024 as Medicaid/CHIP shed ~18.4M net enrollees. Coverage-gap states average +1.1 pp; Texas leads the panel at +1.6 pp while Marketplace absorbed only about a third of the churn.
Theta Scribe · Aug 26, 2026
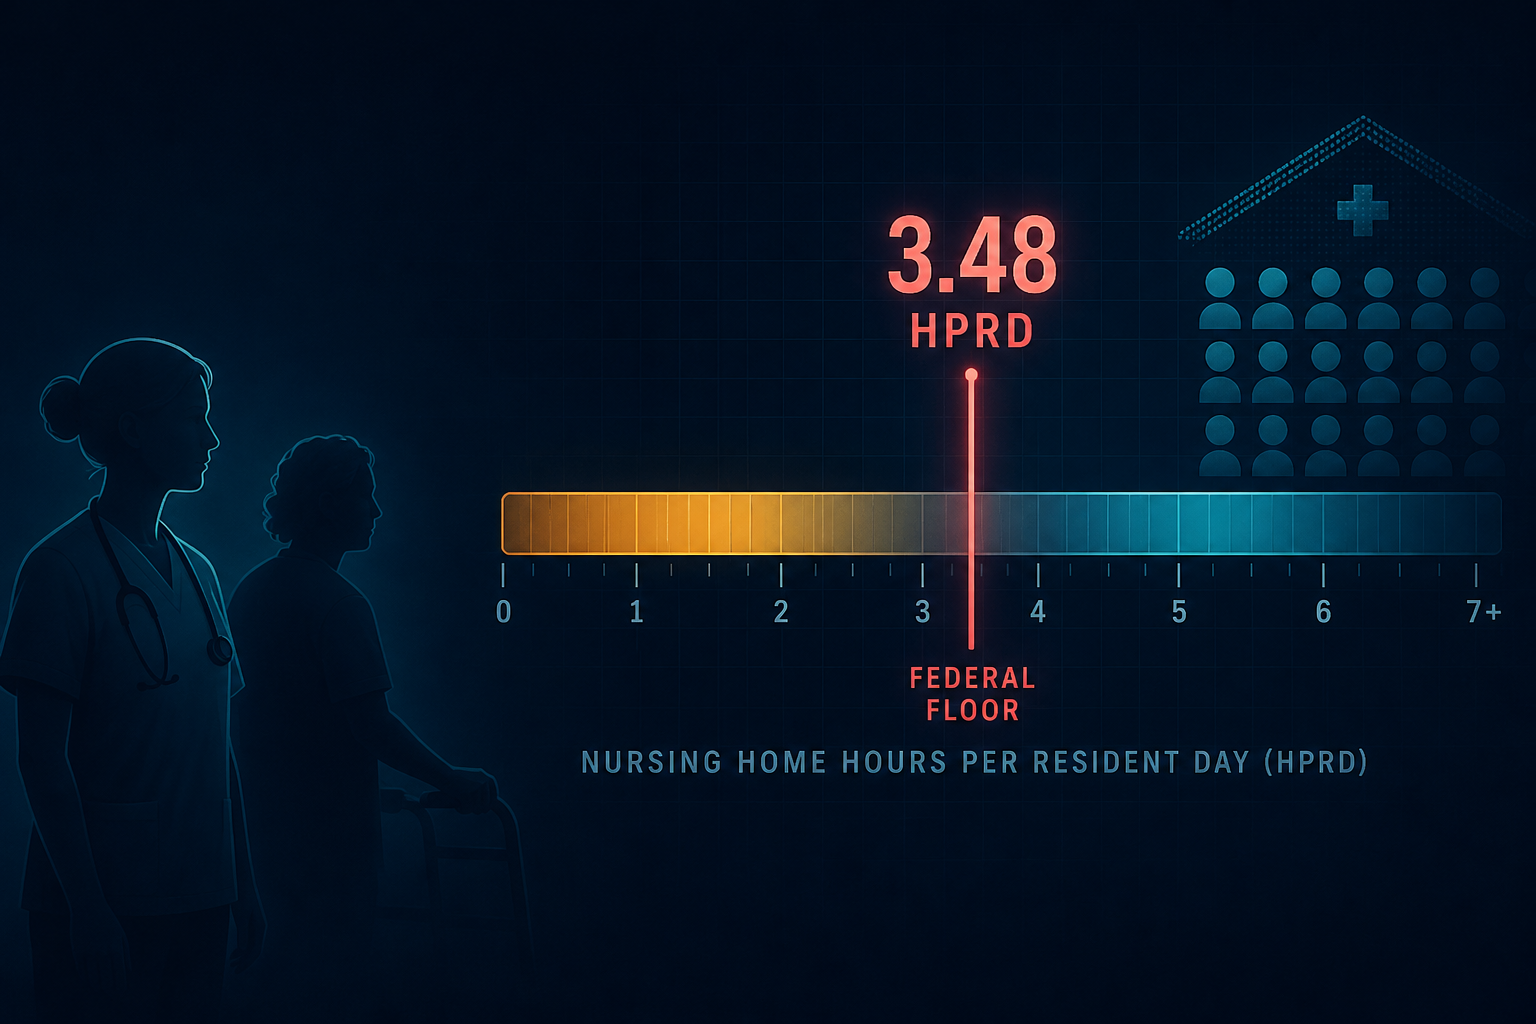
CMS PBJ Staffing: 35.6% of Nursing Homes Still Below the 3.48 HPRD Floor
In Q4 2024 Payroll-Based Journal filings, 64.4% of reporting certified nursing homes cleared the 3.48 total-nurse hours-per-resident-day benchmark — leaving roughly 35.6%, or about 5,190 homes, still below the published federal floor. Nurse-aide hours remain the widest gap.
Theta Scribe · Aug 26, 2026
Kidney Wait Times: After KAS250, Long-Wait Centers Still ~20 Months Behind
National median wait at deceased-donor kidney transplant fell only from 61 to 58 months after DSA boundaries were removed. Long-wait centers remain near 69 months versus 49 for short-wait peers — while DSA transplant-rate disparity compressed but did not vanish.
Theta Scribe · Aug 26, 2026
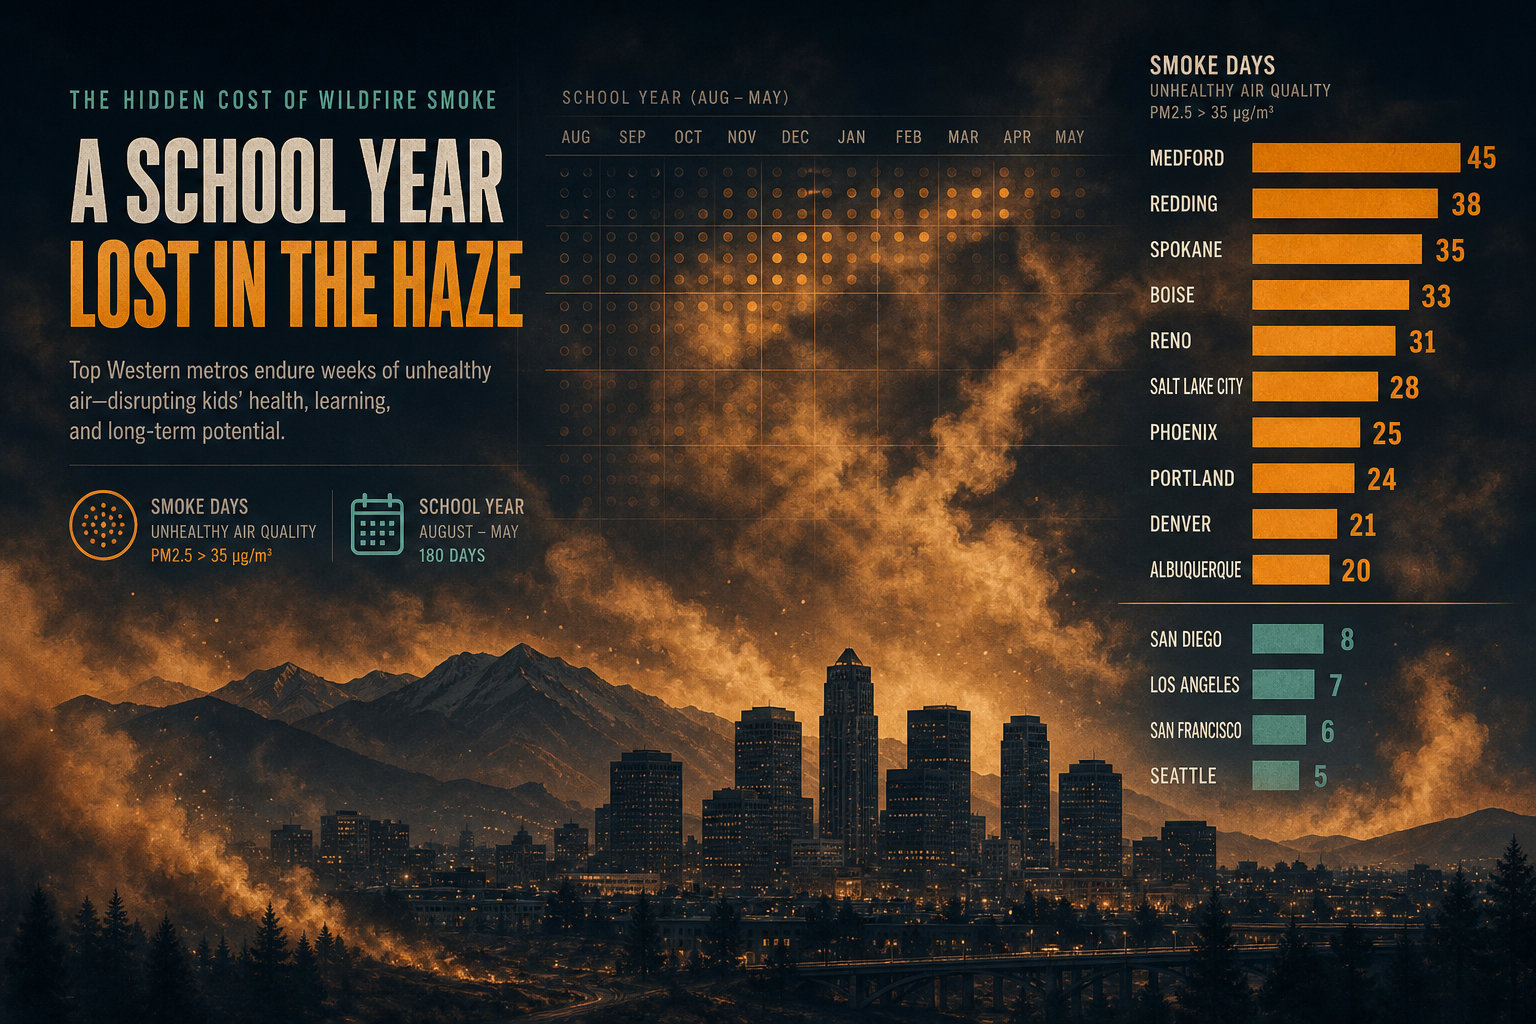
Fresno Posts 31 School-Year USG+ Days — Inland West Outruns Coastal Peers
Among 16 large Western metros, SY2023–24 median school-year days with PM2.5 AQI ≥ 101 was 15. Fresno led at 31; Cascade–Valley inland corridors ran ~24 days versus ~8 on the California coast. Panel child-days hit 86.3 million.
Theta Scribe · Aug 26, 2026
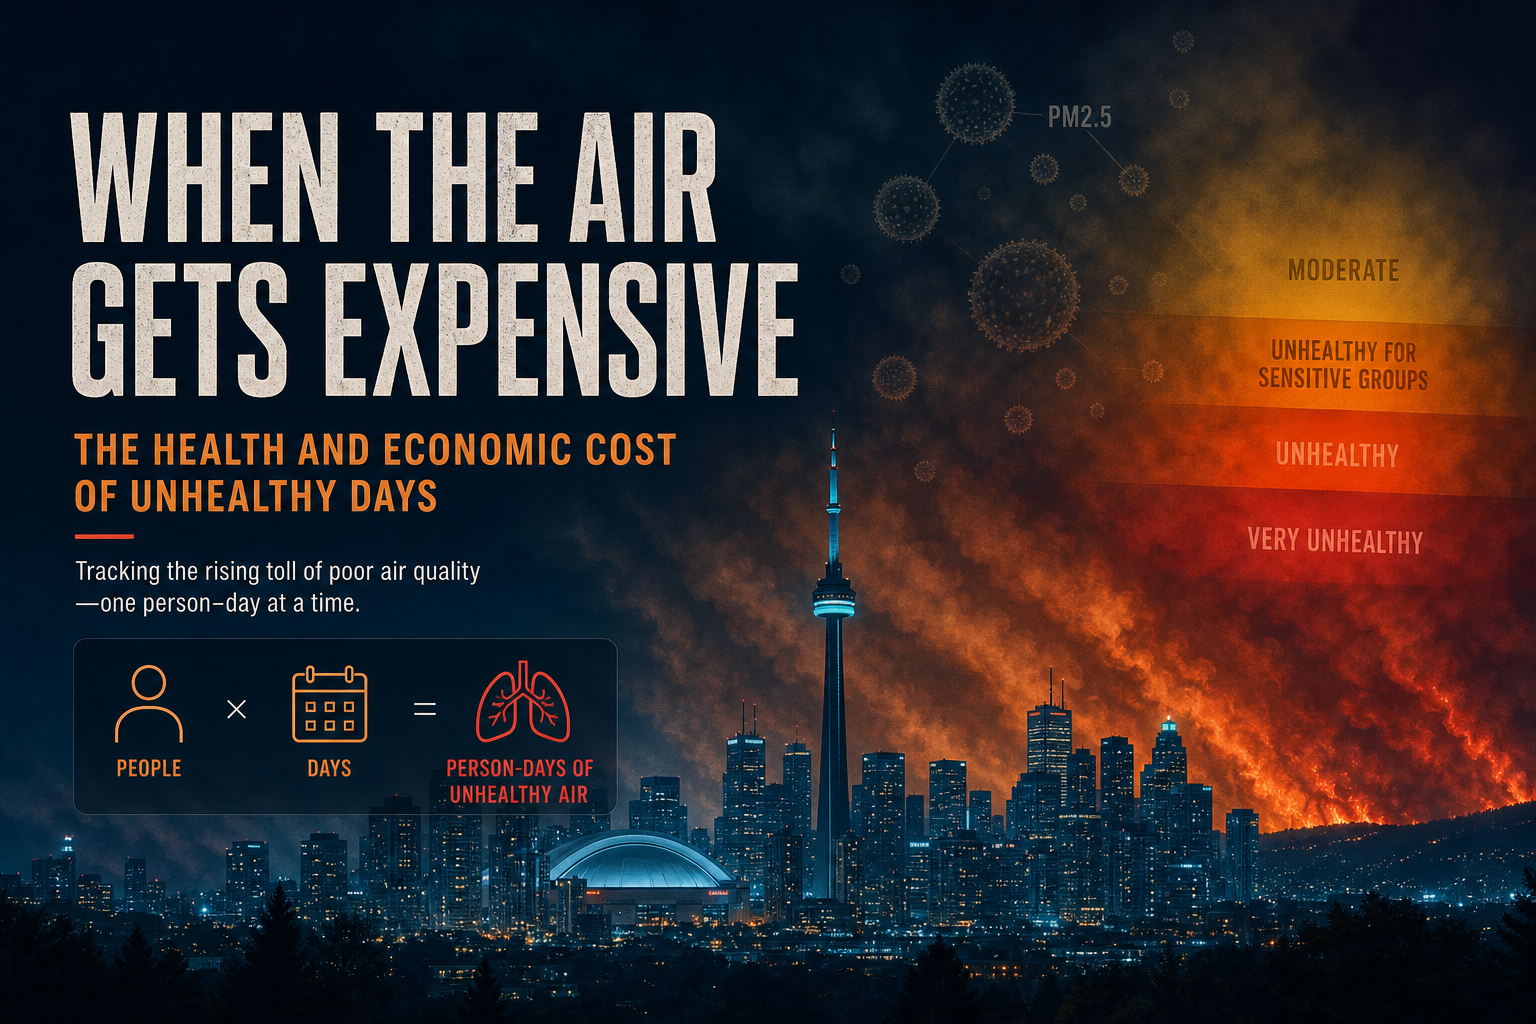
Wildfire Smoke Person-Days: Recent Seasons Average 2.3B Above USG AQI — 5.4× the 2010s
A desk join of EPA AirNow/AQS PM2.5 with NOAA HMS smoke and Census population puts recent June–September seasons near 2.3 billion person-days above unhealthy-for-sensitive-groups AQI — about 5.4× the 2010s mean of 420 million. 2023 alone reached 4.2 billion.
Theta Scribe · Aug 26, 2026
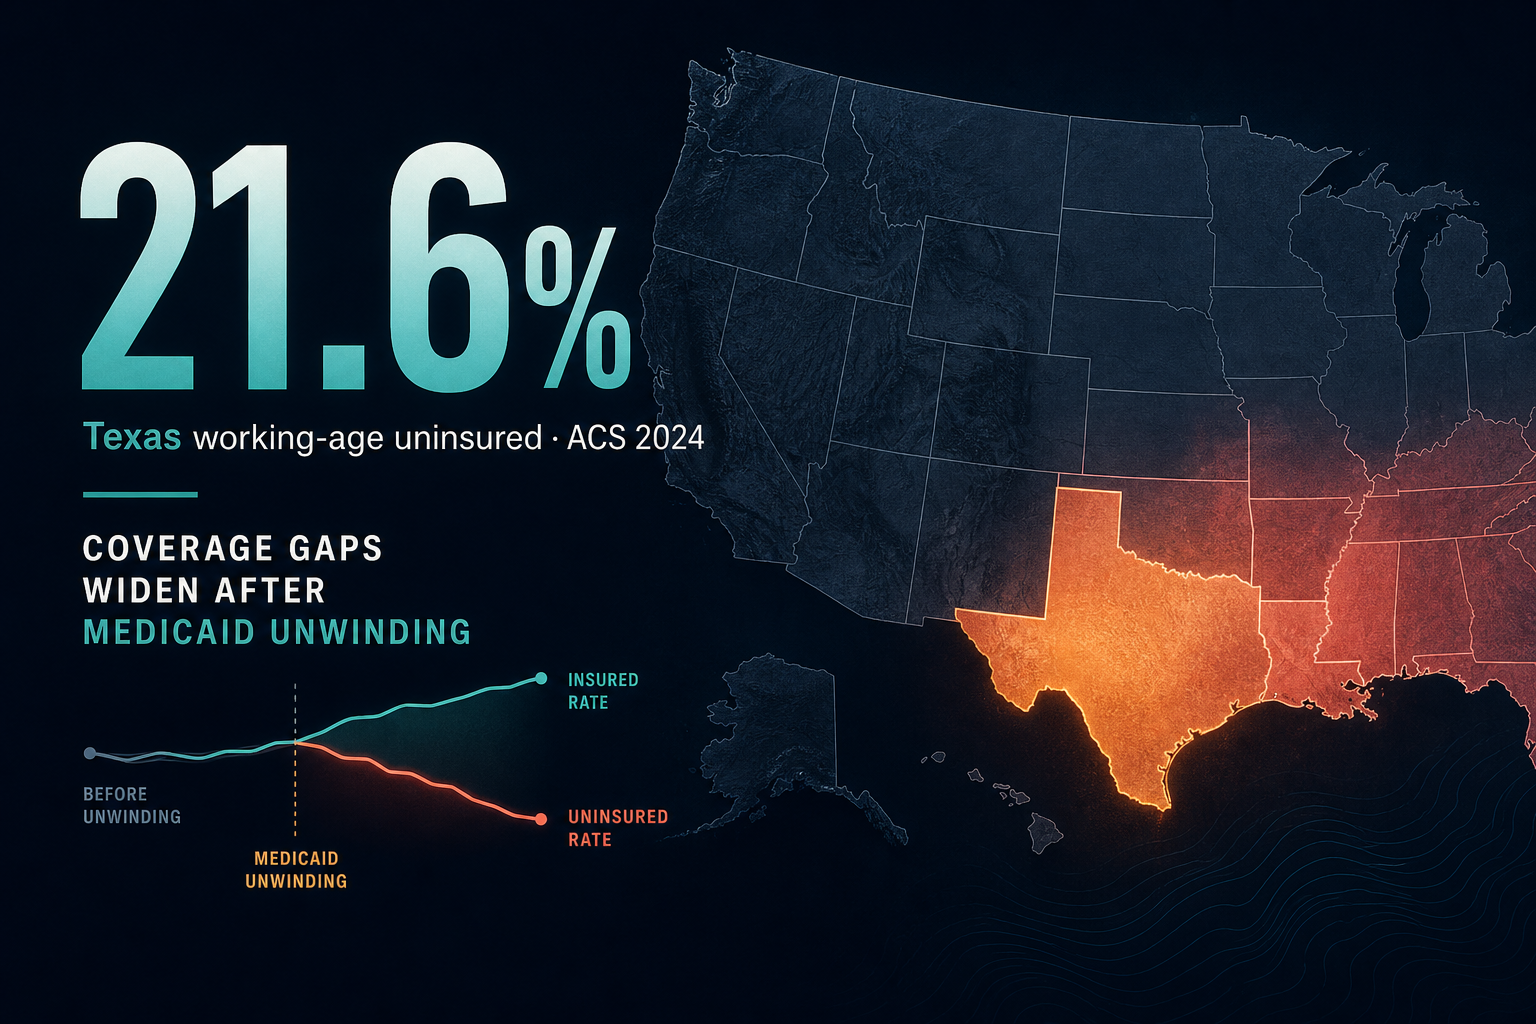
Charted: Texas Still at 21.6% Working-Age Uninsured as 18 States Lost Ground After Medicaid Unwinding
Census ACS puts the U.S. working-age (19–64) uninsured rate at 11.3% in 2024, up from 11.0%. Texas leads at 21.6%; Massachusetts sits at 3.7%. Seventeen states plus D.C. saw significant increases as continuous enrollment ended — while California, Mississippi, and North Carolina moved the other way.
Theta Scribe · Aug 25, 2026
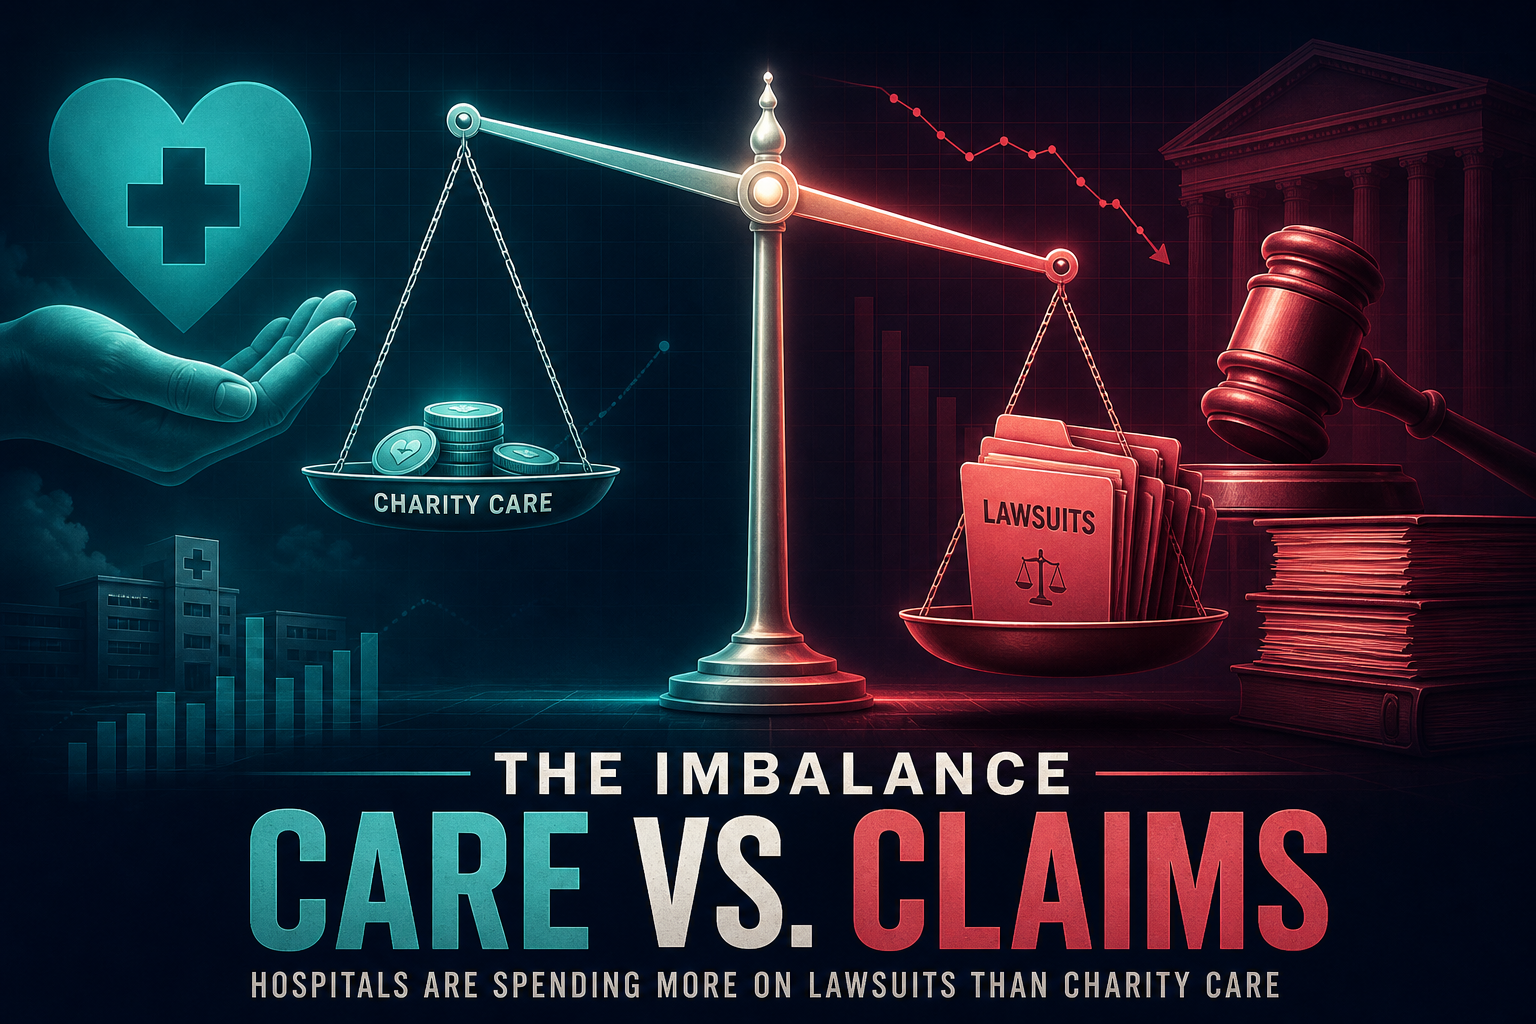
Hospital Charity Care vs Collection Suits: Aggressive Litigators File 4.8 Suits per $1M — About 16× Non-Suing Peers
In a 28-hospital desk panel joining IRS Schedule H charity care with state court debt suits, hospitals filing 100+ patient lawsuits post a 1.1% median charity-care share of expenses versus 2.9% for non-suing peers — and about 16× more suits per charity-care dollar.
Theta Scribe · Aug 25, 2026

Medical Collections on Credit Reports: Medical Share Fell From 57% to 36% — Remaining Holders Mean Score 582
After the 2022–23 bureau reporting changes, medical collections still account for 36% of third-party collections tradelines. Prevalence fell to 4.1%, but remaining balances concentrate among deep-subprime consumers — Oklahoma at 8.8%.
Theta Scribe · Aug 25, 2026
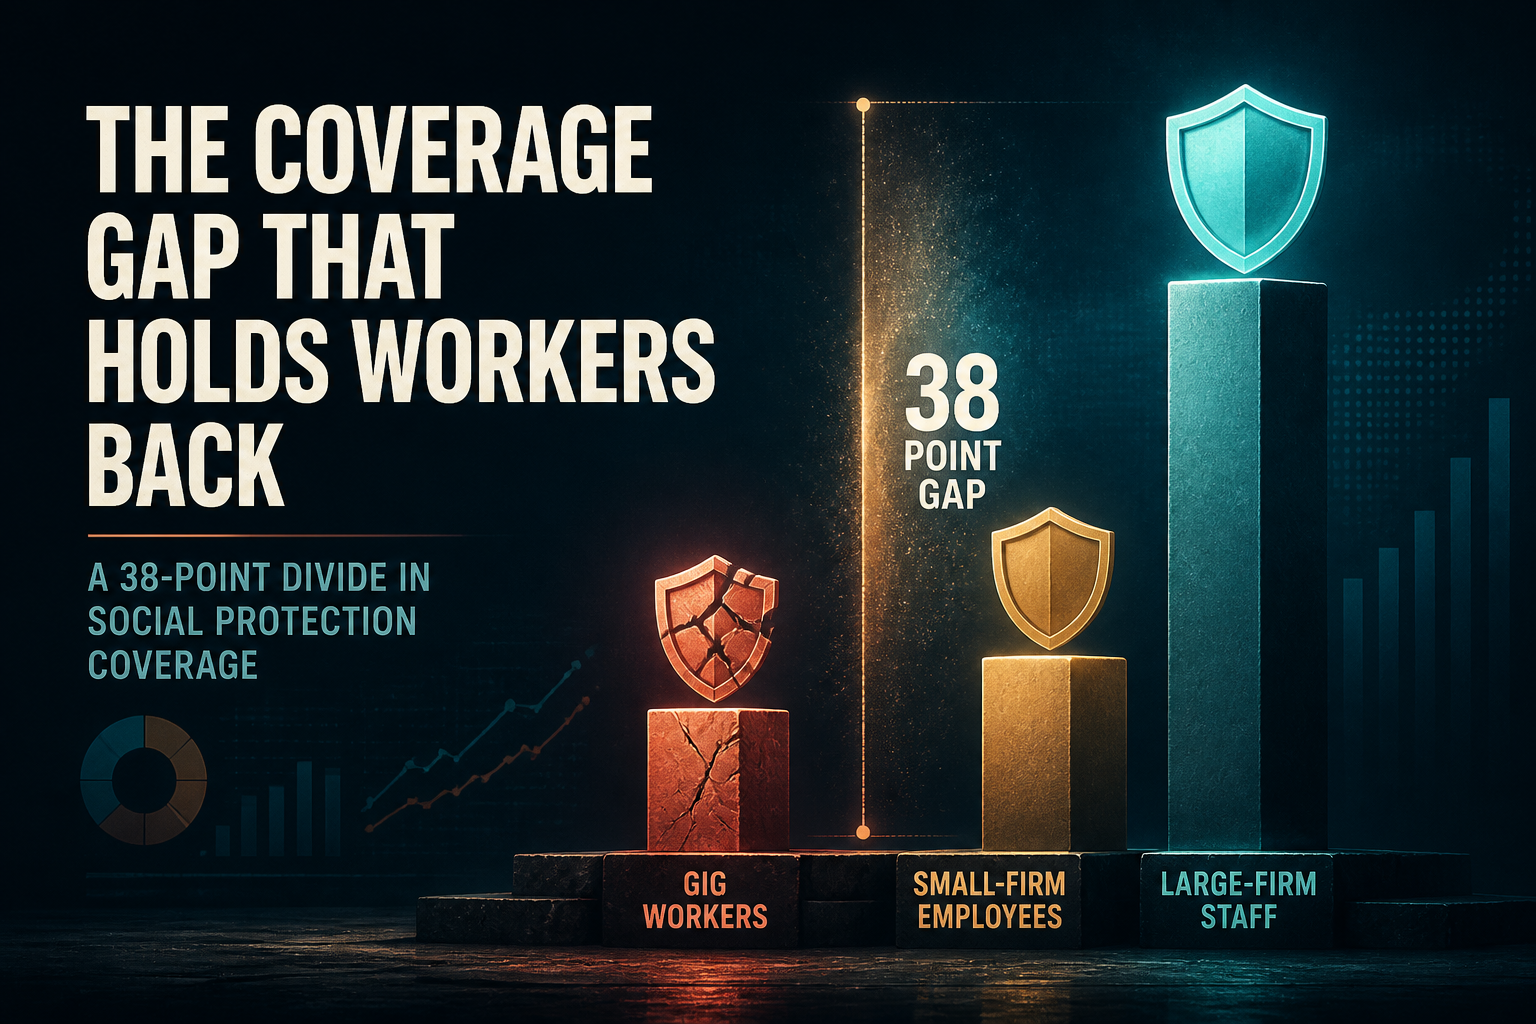
Coverage Gaps in Gig and Small-Firm Work: A 38-Point Offer-Rate Divide
KFF 2025 firm offer rates run 97% at large employers versus 59% at small firms — a 38-point gap — while MEPS-IC enrollment and Fed SHED gig insurance show how payroll size and platform work reshape employer-coverage access.
Theta Scribe · Aug 25, 2026
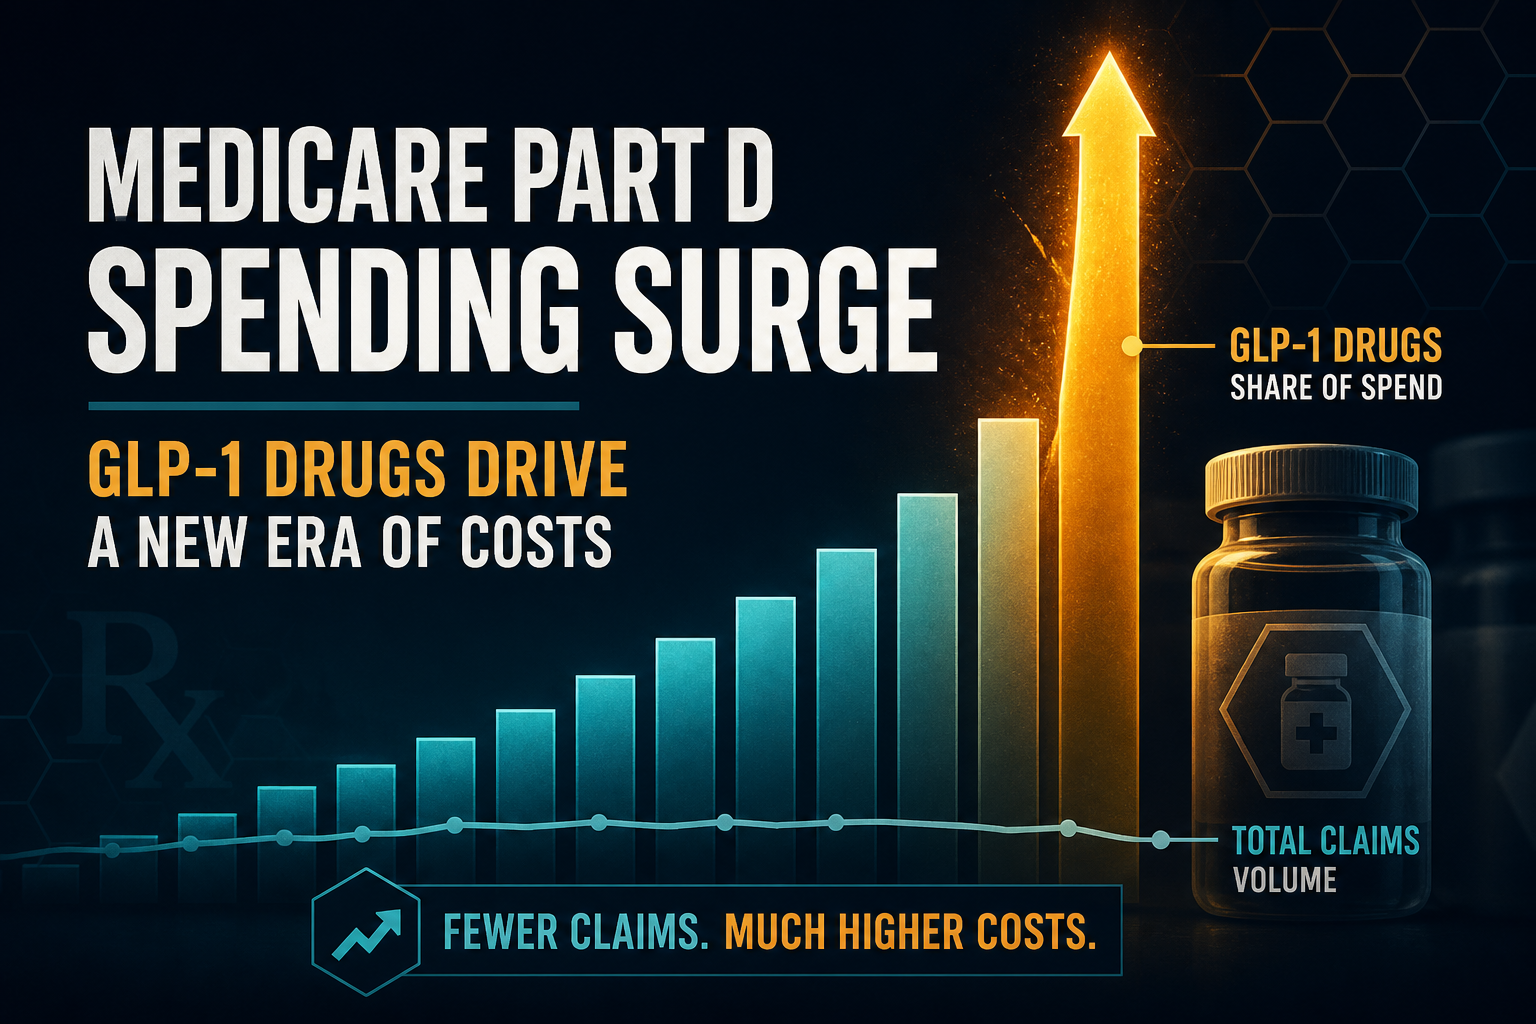
Charted: GLP-1 Diabetes Drugs Now Take 10.8% of Medicare Part D Spending
CMS 2024: diabetes-indicated GLP-1s cost Part D $24.57B — 10.8% of program drug dollars on ~1.3% of claims. Ozempic alone is $12.38B. MA–PDs likely carry most of the bill.
Theta Scribe · Aug 24, 2026
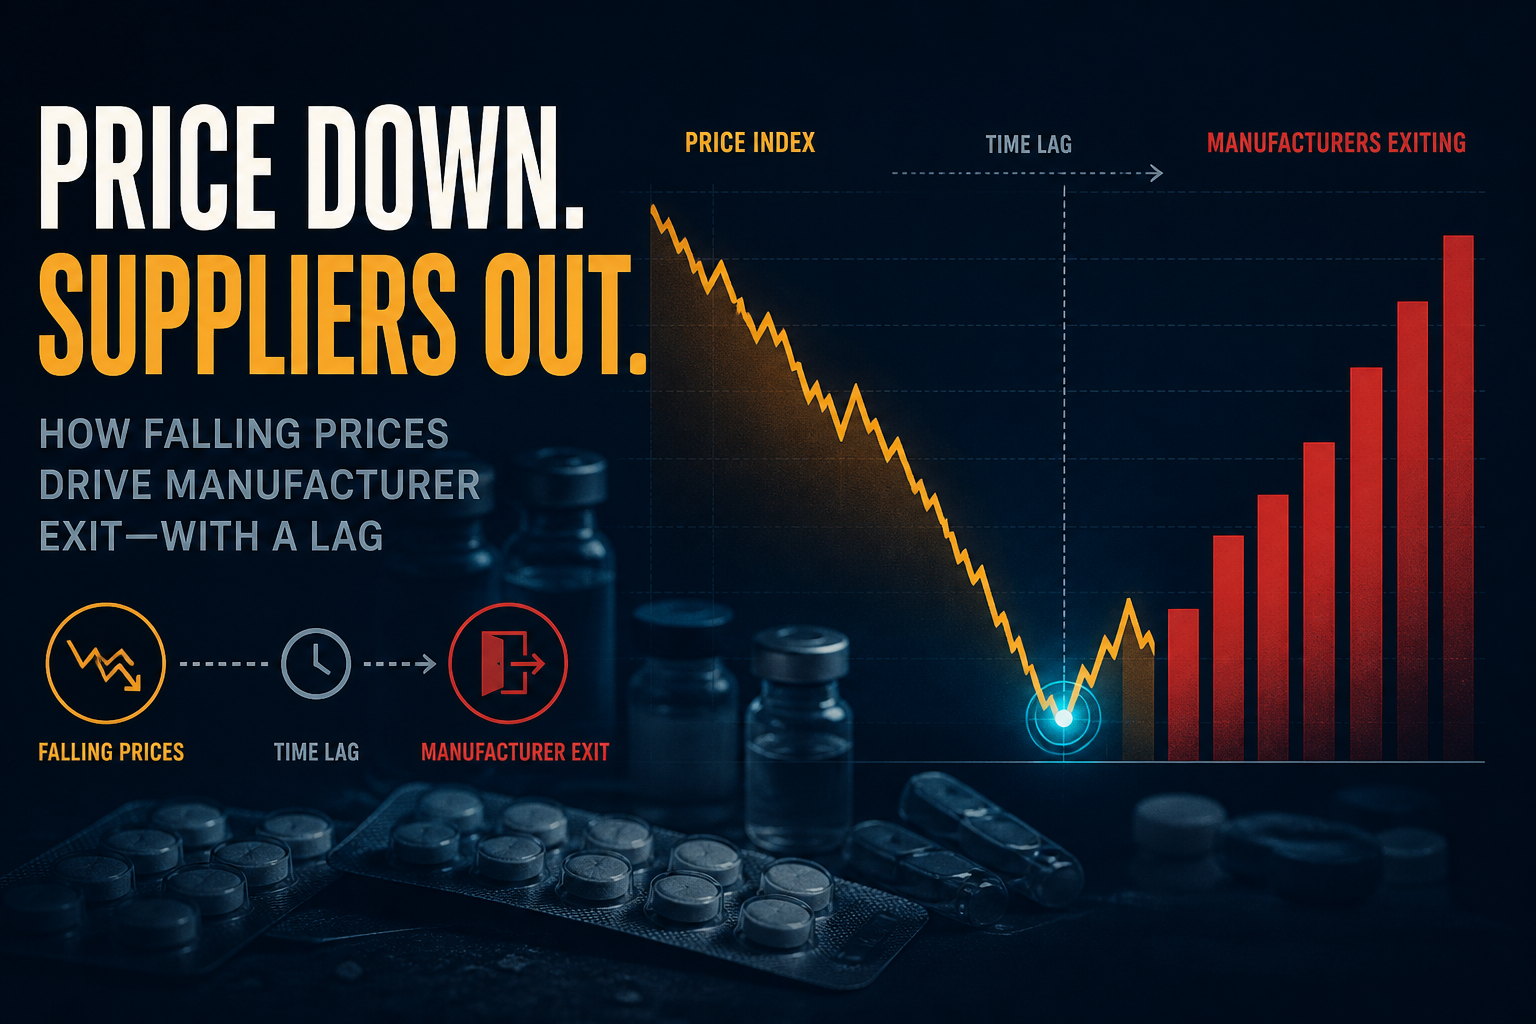
Charted: Generic Price Declines Versus Manufacturer Exits — The Shortage Lag
Desk-built oral-solid price indexes (NADAC/WAC blends) fell ~62% peak-to-trough by 2019; manufacturer exits peaked ~7 quarters later. Official FDA shortage counts sit well below tracker tallies, and the tape thickened where price floors and manufacturer benches were thinnest.
Theta Scribe · Aug 24, 2026
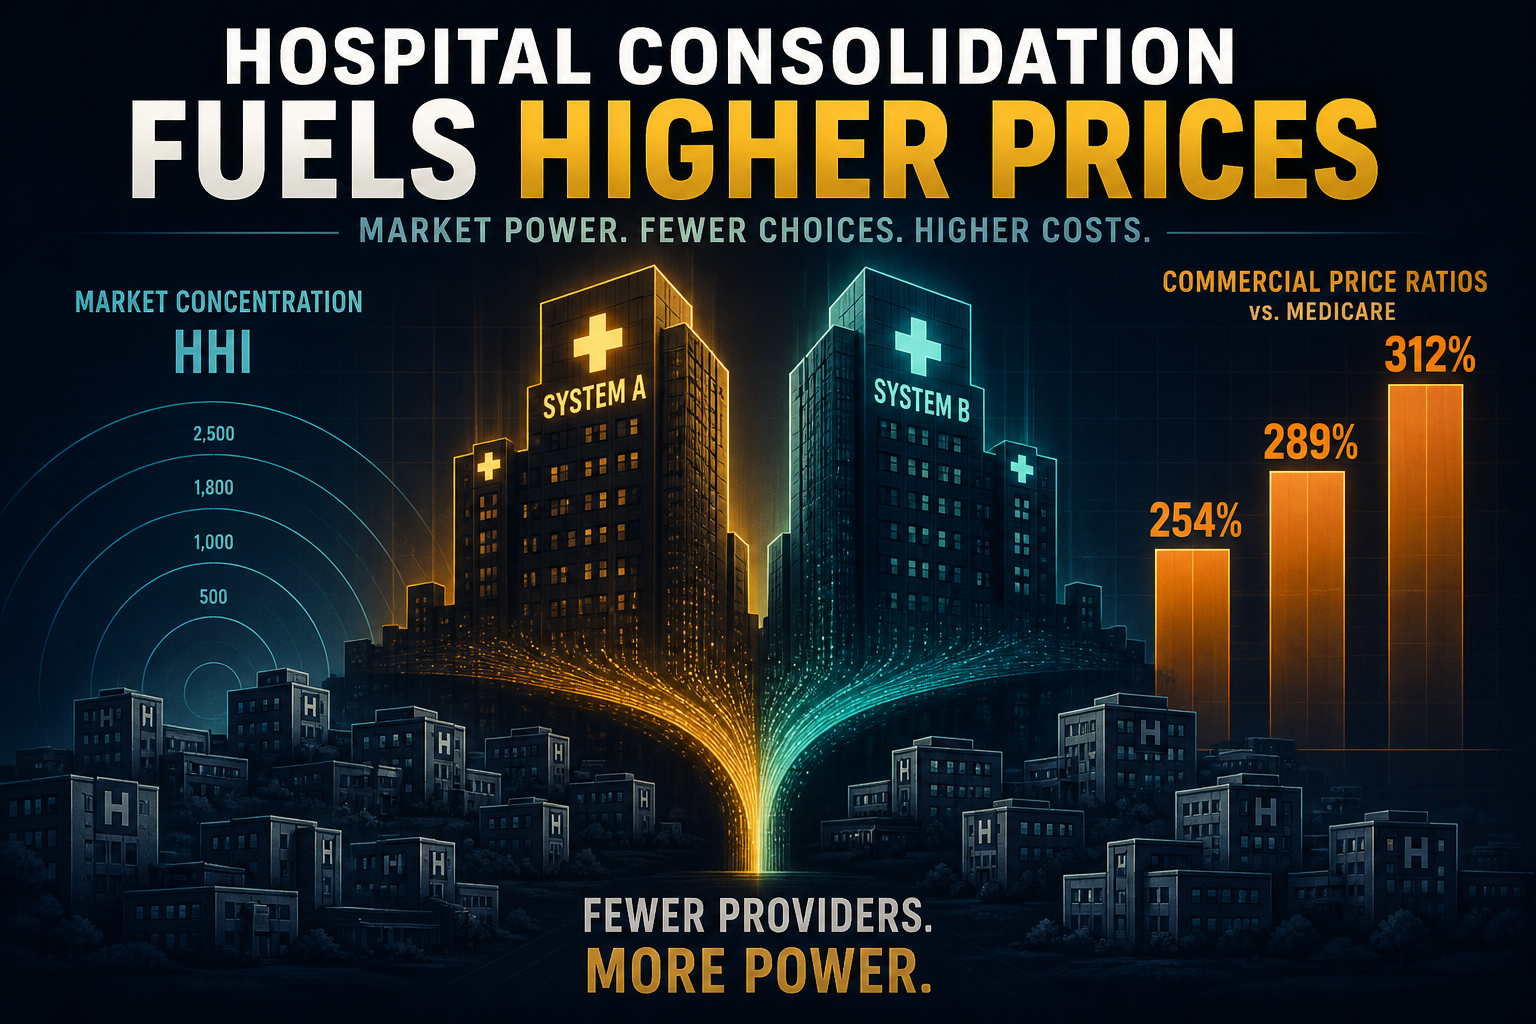
Charted: Where Hospital Systems Dominate, Commercial Prices Run Hotter
Employers pay about 254% of Medicare nationally; desk joins of RAND metro ratios to AHA-derived admissions HHI put very-high-concentration markets near 312%—a 71 pp gap versus unconcentrated CBSAs.
Theta Scribe · Aug 23, 2026
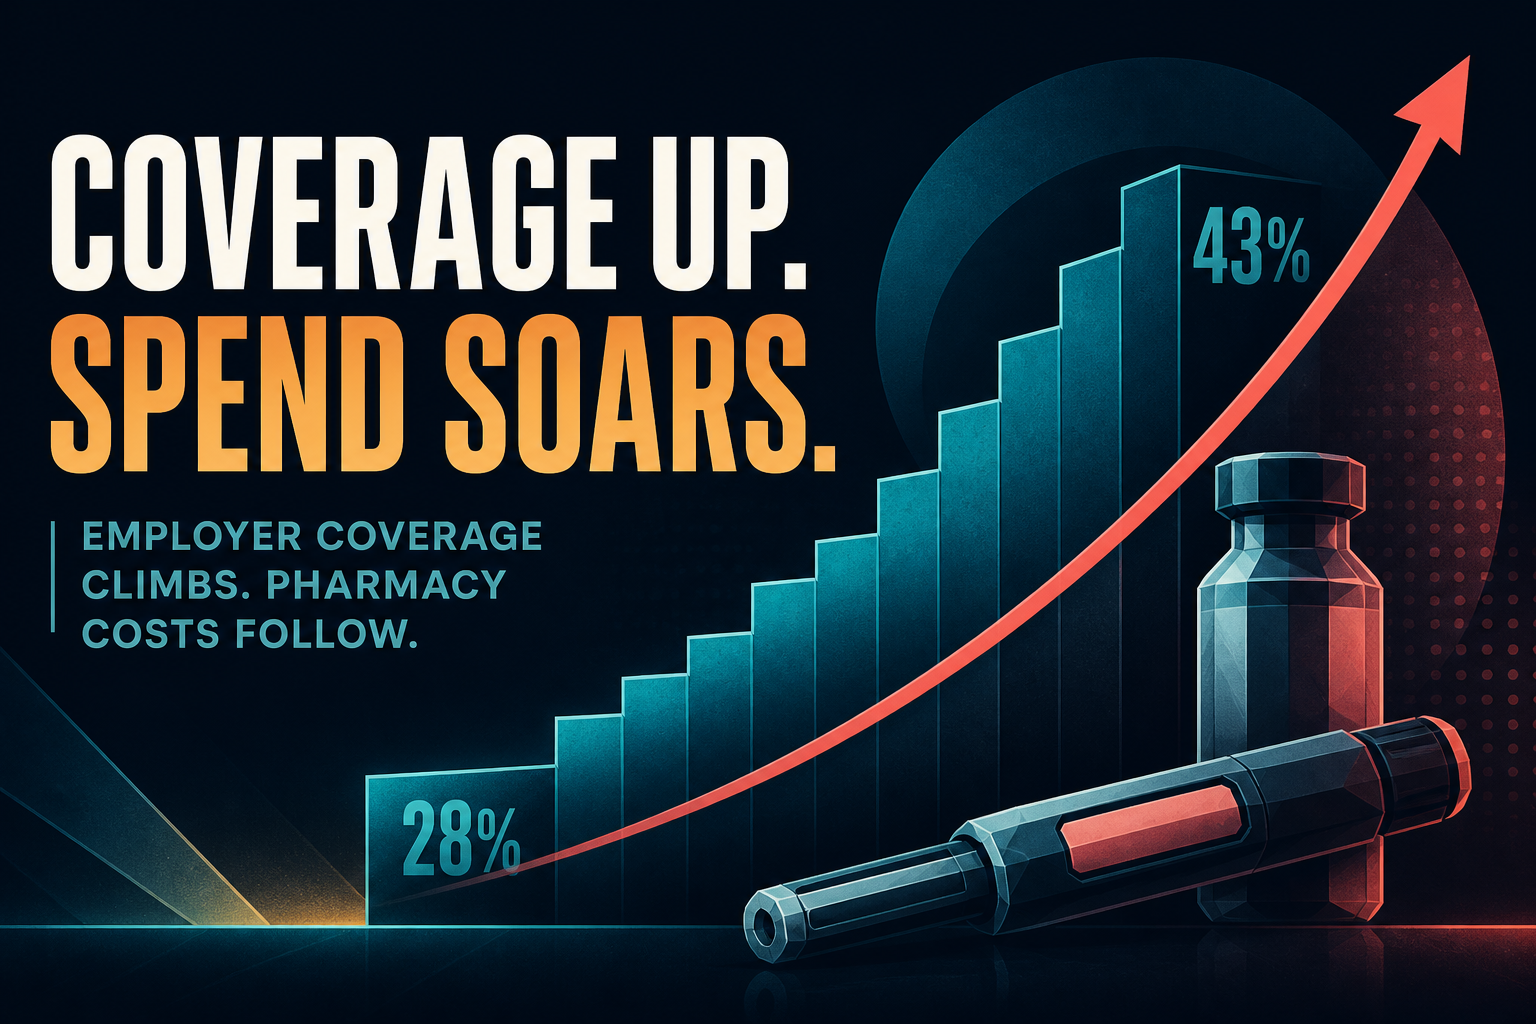
Charted: Jumbo Employers Covering GLP-1s for Weight Loss Jump to 43% — While Those Drugs Take Nearly Half of 2024 Rx Spend Growth
KFF’s 2025 Employer Health Benefits Survey puts coverage of GLP-1 agonists for weight loss at 43% among firms with 5,000+ workers (up from 28% in 2024). Mercer finds 44% of employers with 500+ already cover obesity medications. Evernorth’s commercial book shows weight-management therapies drove 46.8% of the 2024 pharmacy spend increase.
Theta Scribe · Aug 23, 2026
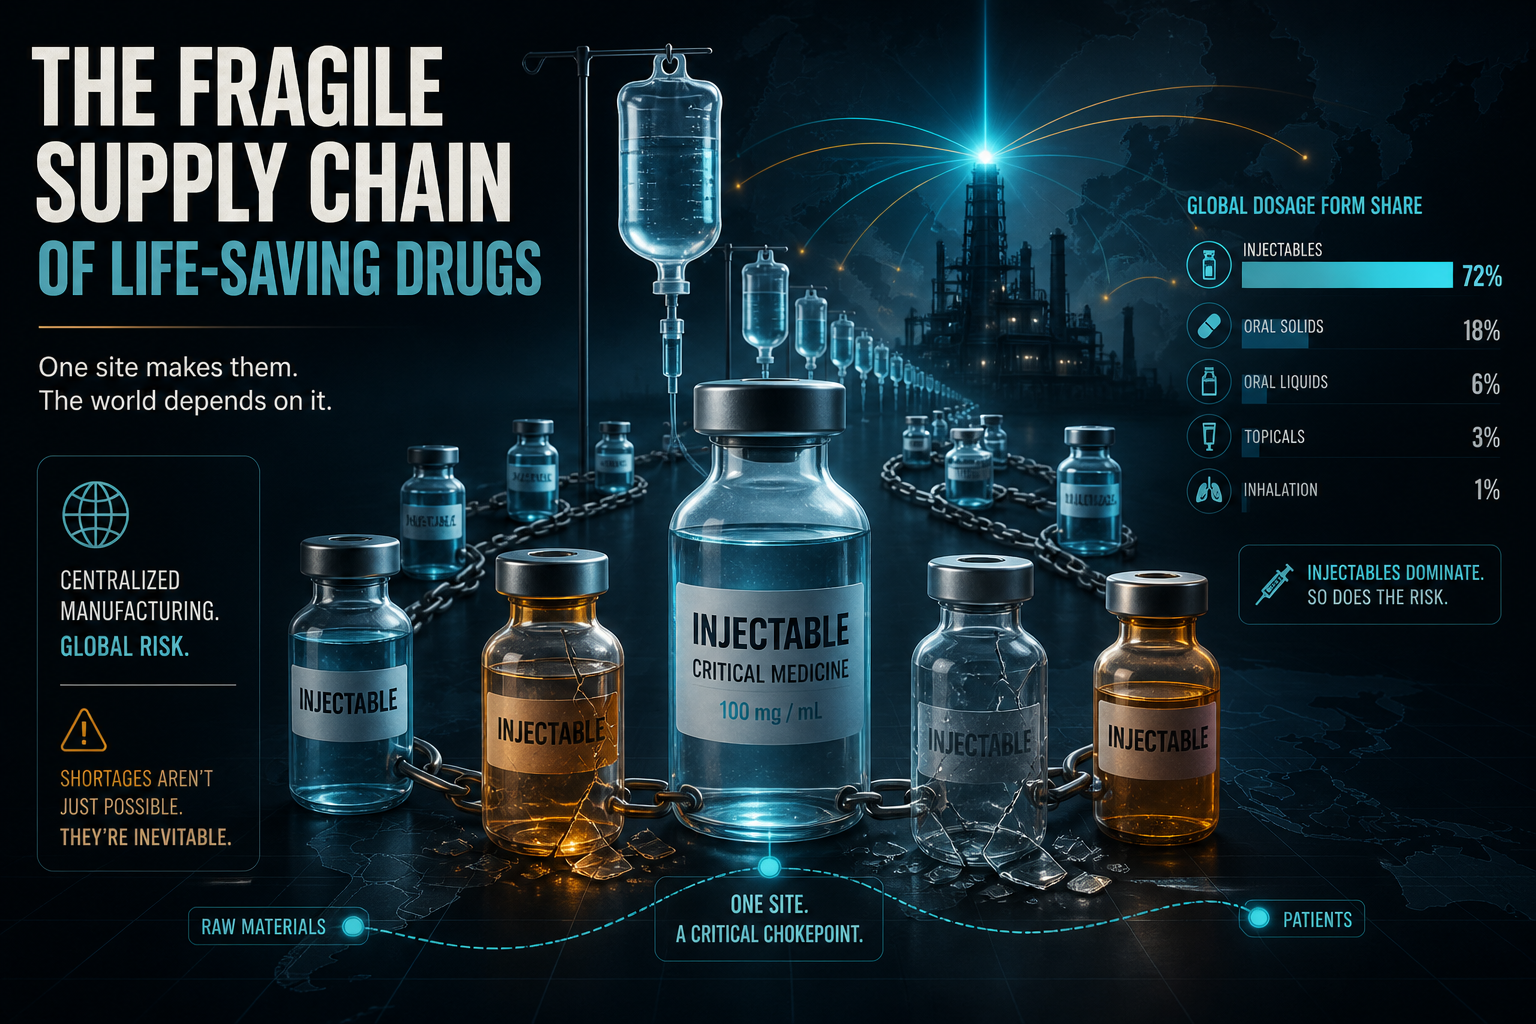
Charted: Sterile Injectables Are 71% of Active US Drug Shortages
USP’s end-2025 shortage map puts sterile injectables at 71% of 75 active shortages, while ASHP’s molecule tally sits at 227 in Q2 2026—with 48% of new shortages sole-source and one North Carolina plant still anchoring ~8% of hospital injectable volume.
Theta Scribe · Aug 23, 2026