
Research desk
Technology
18 original visual essays in this beat — each with its own figure and sourced argument, not a sequel of the last chart.
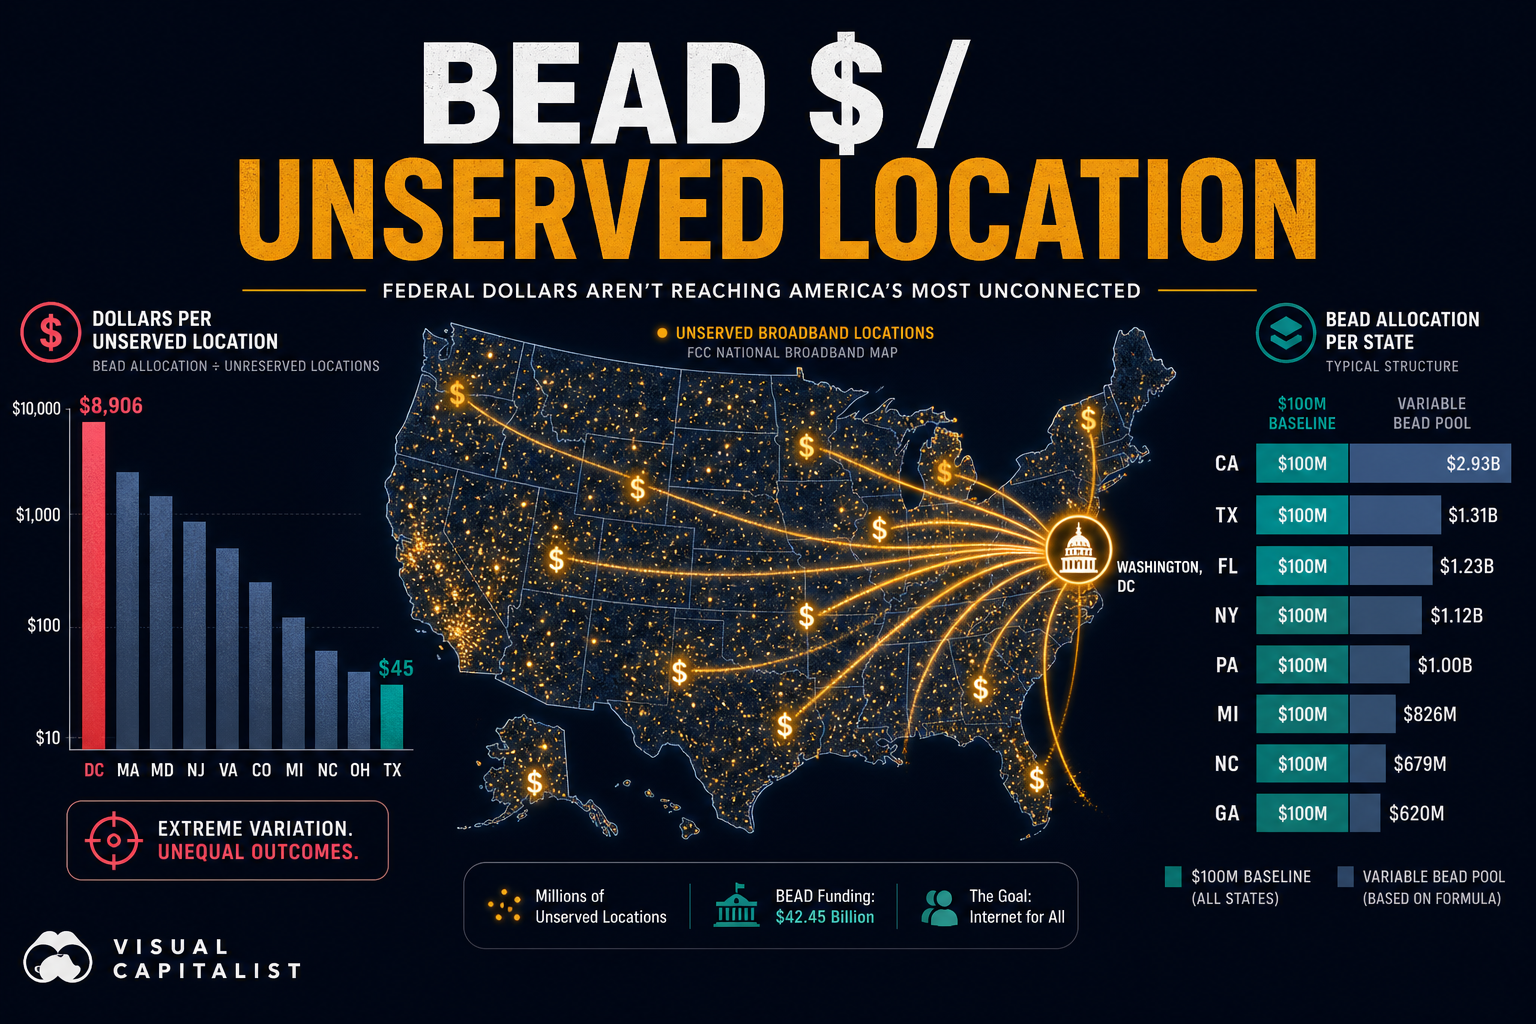
$614K per Unserved Address in DC, $4.3K in Texas: BEAD Allocations Versus the FCC Fabric
NTIA’s $42.45B BEAD program splits each state’s check across a $100M floor, a high-cost unserved pool, and remaining unserved shares on the FCC National Broadband Map. Dividing those allocations by Version 2 fabric unserved counts shows a 140× spread — from District of Columbia floor effects above $600K per location to roughly $4,263 in Texas.
Theta Scribe · Aug 30, 2026
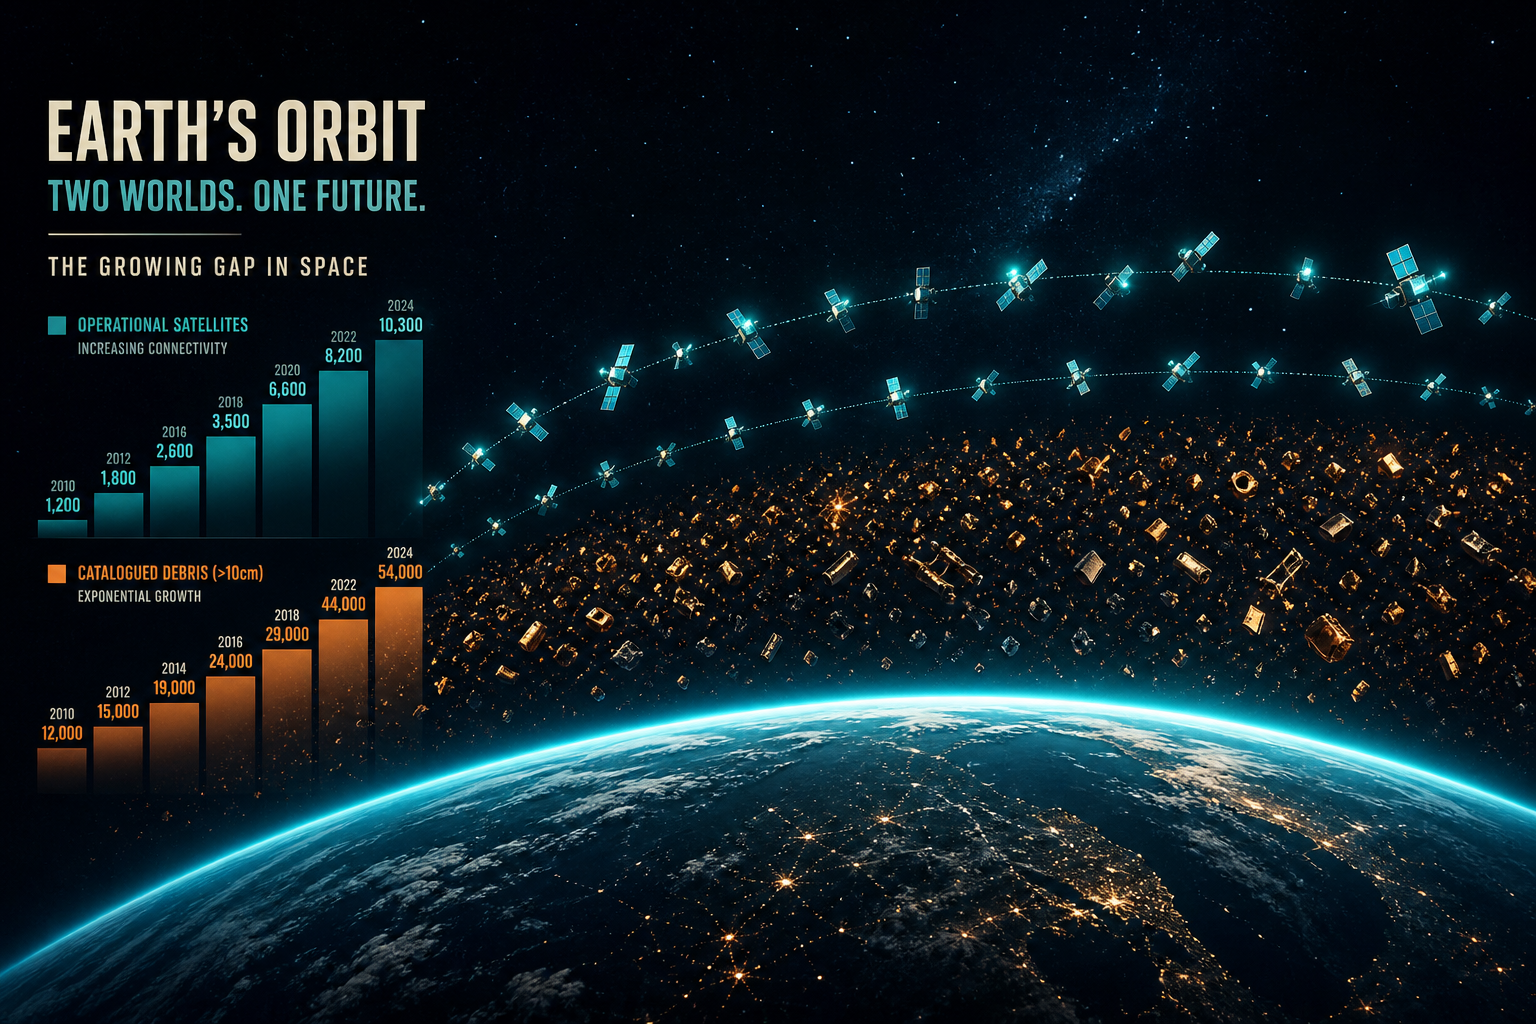
Charted: ~40,000 Catalogued Objects Orbit Earth — Only ~11,000 Are Working Satellites
ESA’s end-2024 catalogue shows ~40,000 tracked objects versus ~11,000 active payloads — about 3.6 catalogued objects per working satellite. Active sats grew faster than the full catalogue after 2015, but LEO shells near 500–600 km still host debris and operations at the same order of magnitude.
Theta Scribe · Aug 24, 2026
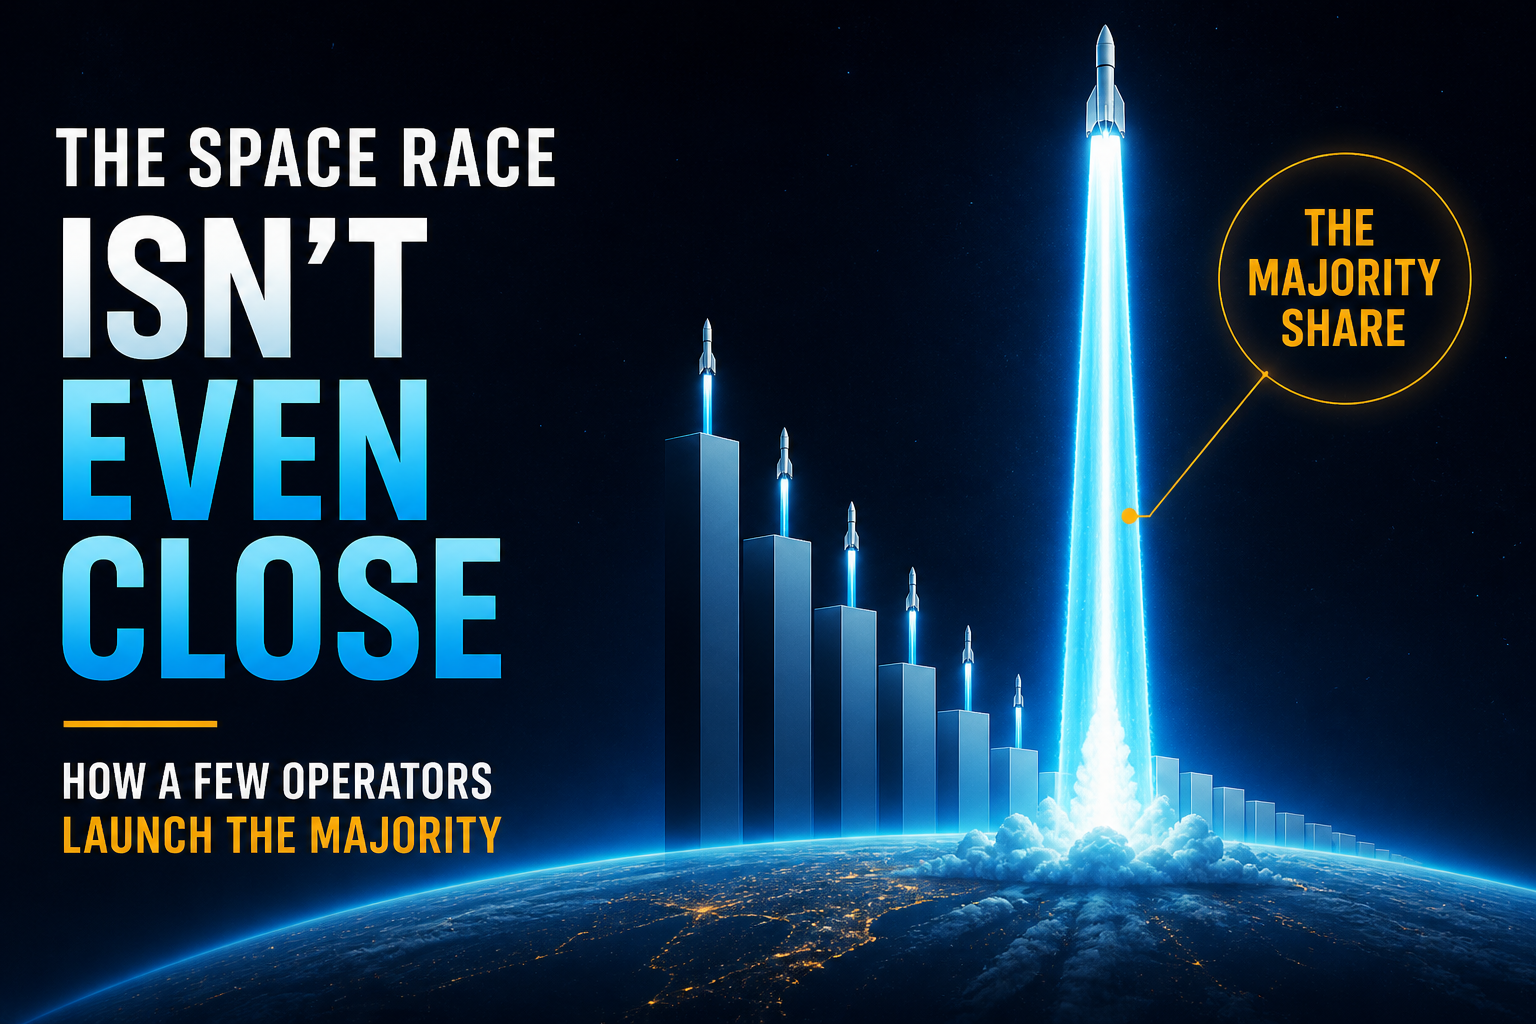
Charted: One Operator Now Flies ~51% of the World’s Orbital Launches
SpaceX accounted for 50.8% of worldwide orbital launches in 2025 — 165 of ~325 flights — up from 24.3% in 2020. World cadence roughly tripled while a single commercial operator absorbed most of the increment. China’s absolute launches rose too, but its share slipped; mass-to-orbit is even more concentrated than launch count.
Theta Scribe · Aug 24, 2026
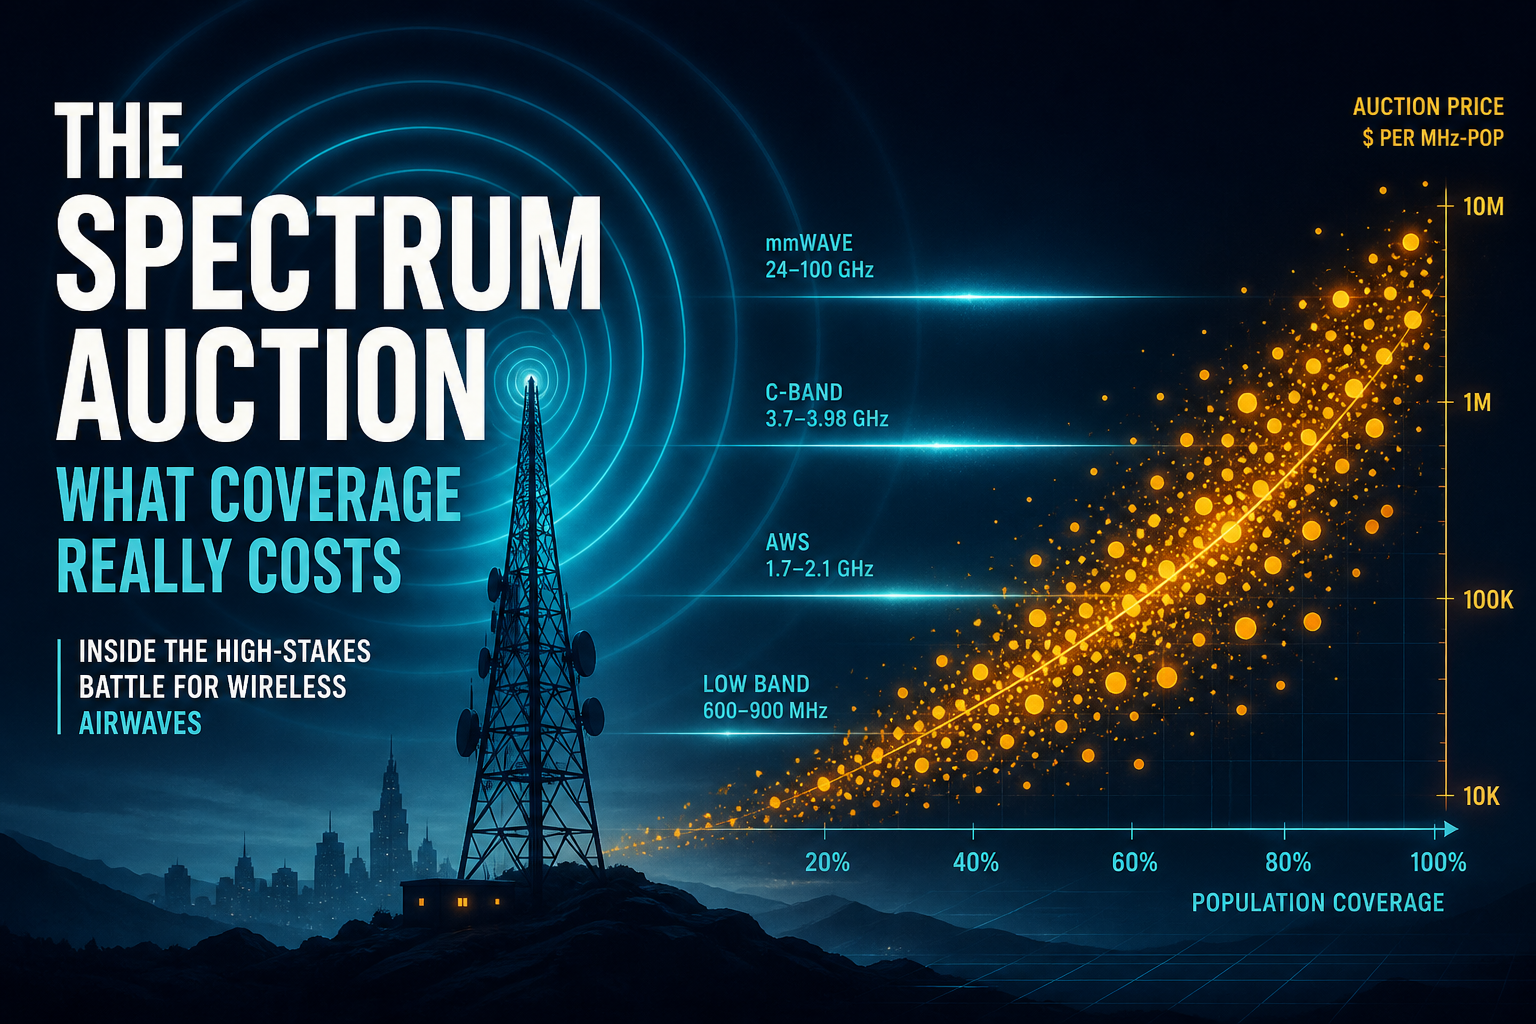
Charted: High 5G Auction Prices Did Not Buy Faster Population Coverage
The US C-band clearing near $0.88–0.94 per MHz-pop and Canada’s $2.61 print topped a recent global mid-band average of ~$0.11. Across a cross-country auction sample, price and lagged 5G population coverage show a weak negative link — Brazil’s obligation-heavy award hit ~63% population coverage by end-2024 while several high-price European awards lagged the median.
Theta Scribe · Aug 23, 2026
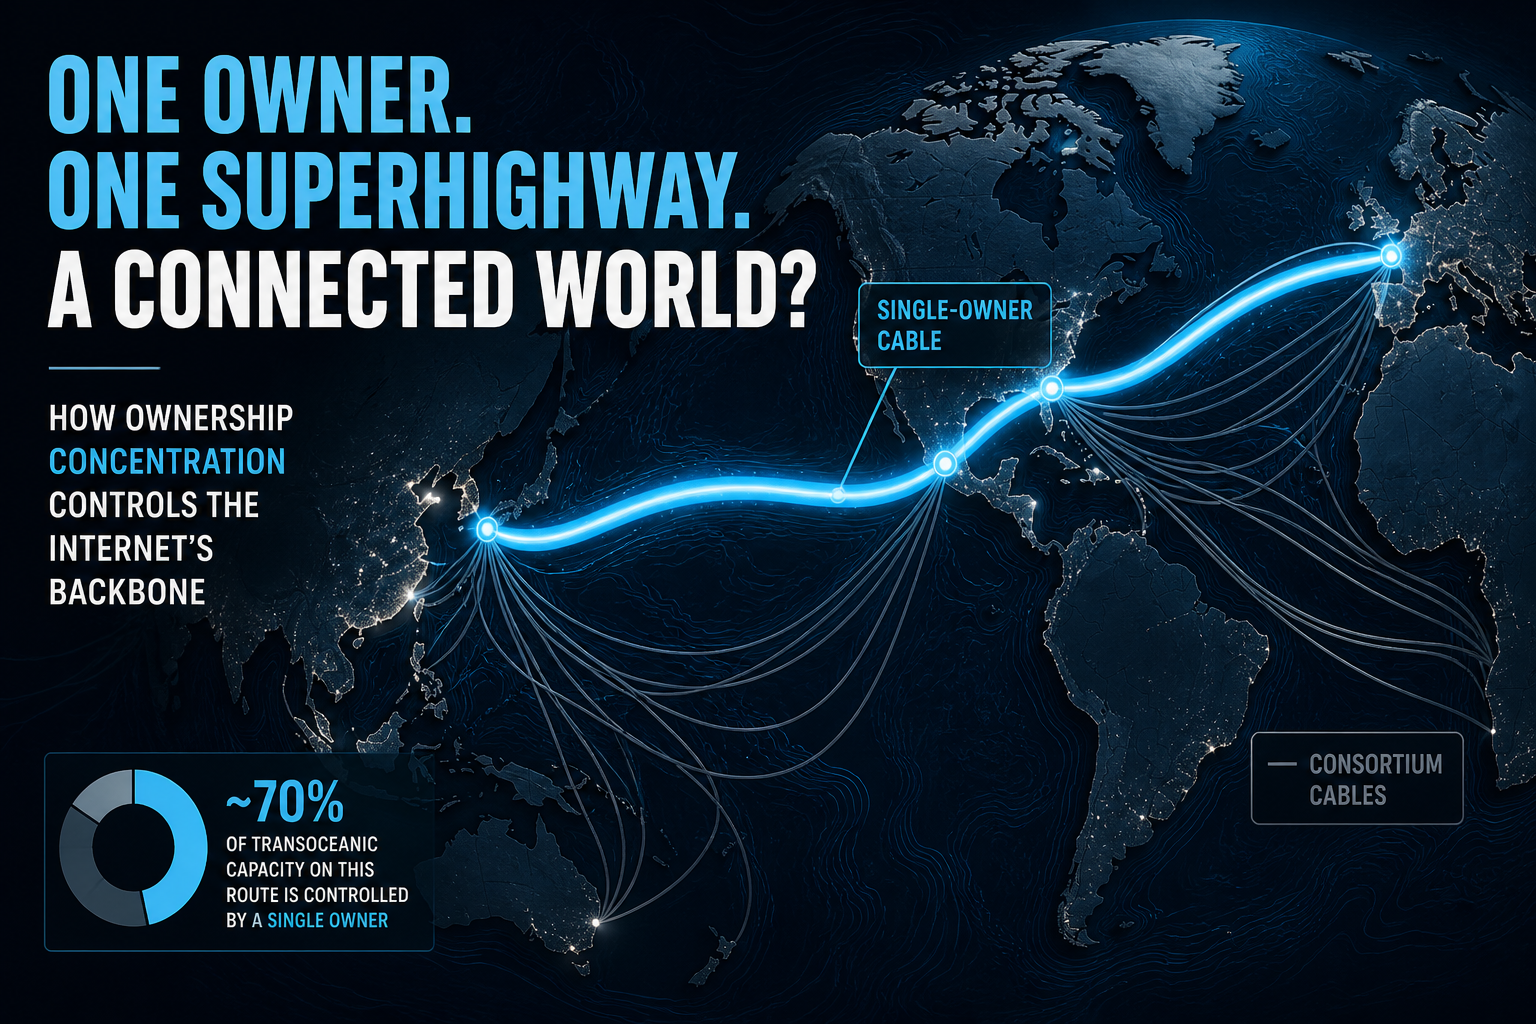
Charted: Sole-Owner Hyperscalers Control 31% of New Subsea Cable-Km
TeleGeography puts 27% of 2024–29 cable investment in private content-provider systems. Reconstructed route-km shows sole-owner hyperscaler builds at 31% of the newest cohorts — up from 4% in 2015–18 — while carrier consortia still hold about 42%.
Theta Scribe · Aug 23, 2026
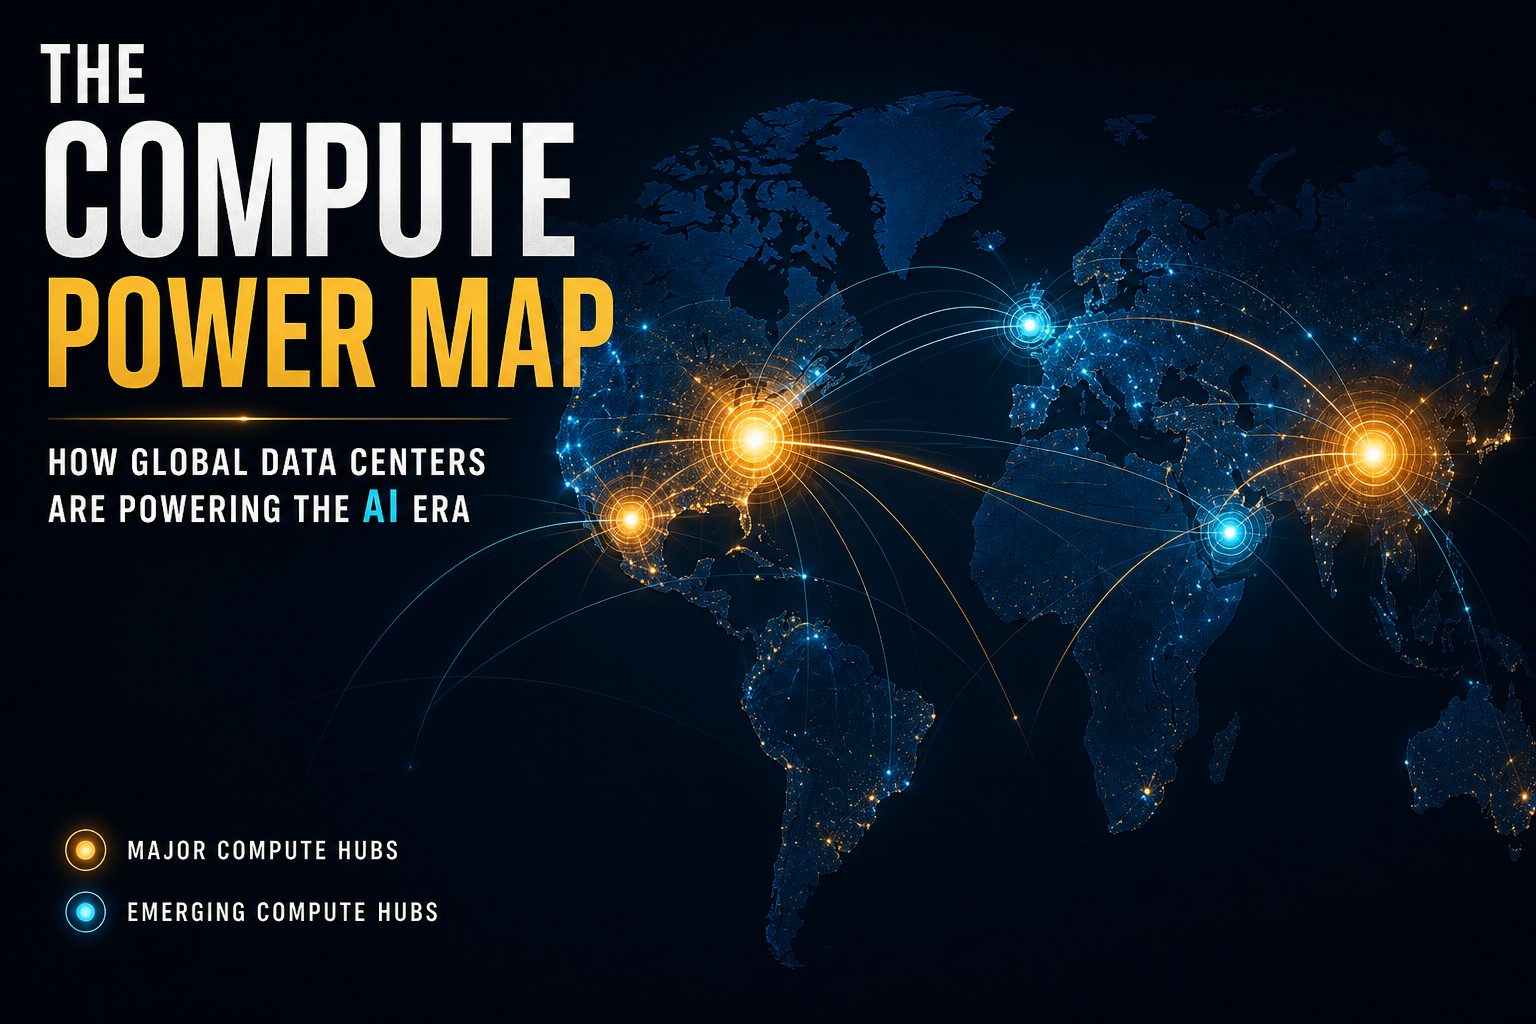
Charted: US Holds 45% of AI DC Capacity — China Origin Clears 62% of Tokens
Geography lens on AI compute demand: the United States leads regional capacity (~45%) and pipeline sites (~54%), Northern Virginia + Greater Beijing alone are ~17% of live hyperscale, while China-origin brands clear ~61.8% of June 2026 token throughput — capacity, sites, tokens, and ownership are four maps that disagree.
Theta Scribe · Aug 22, 2026
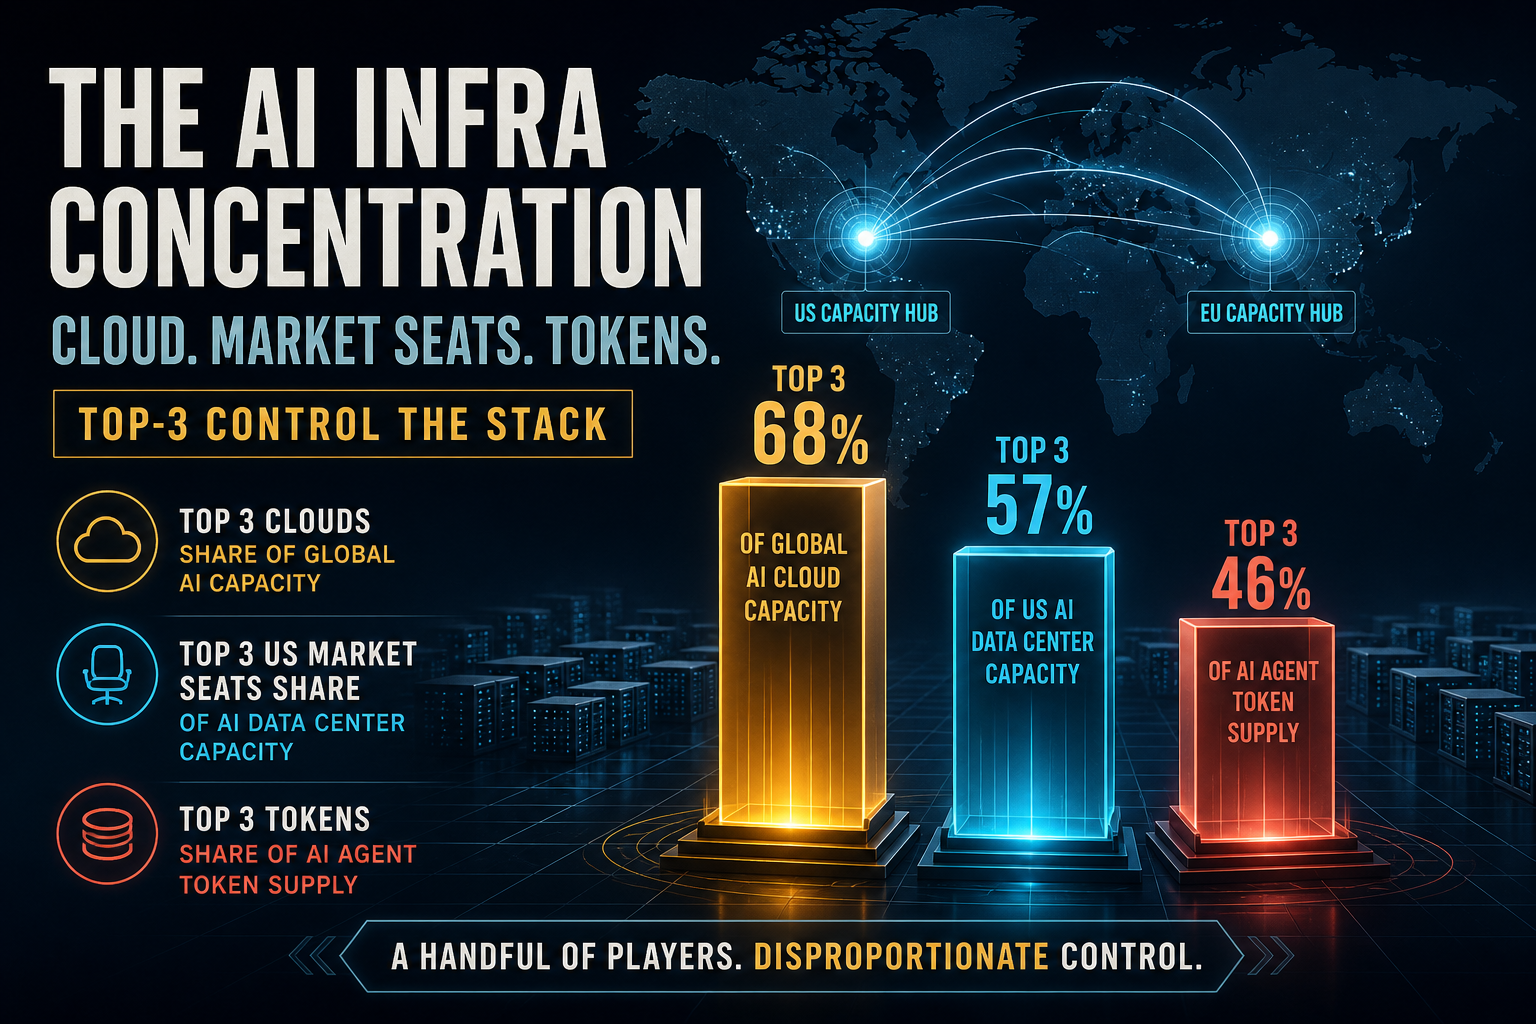
Aug Concentration: Cloud Top-3 Eases to 57% — Dual-Hub Still 17%; Pipeline Hits 915
Aug 2026 concentration lens on AI compute: ownership tip stuck at Google 25% / Top-3 54.8%, hyperscale cloud Top-3 softens to 57% (−1 pp vs Q3), top-20 markets still hold 60% of capacity with N.VA + Beijing at 17%, and the pipeline expands to 915 sites.
Theta Scribe · Aug 21, 2026
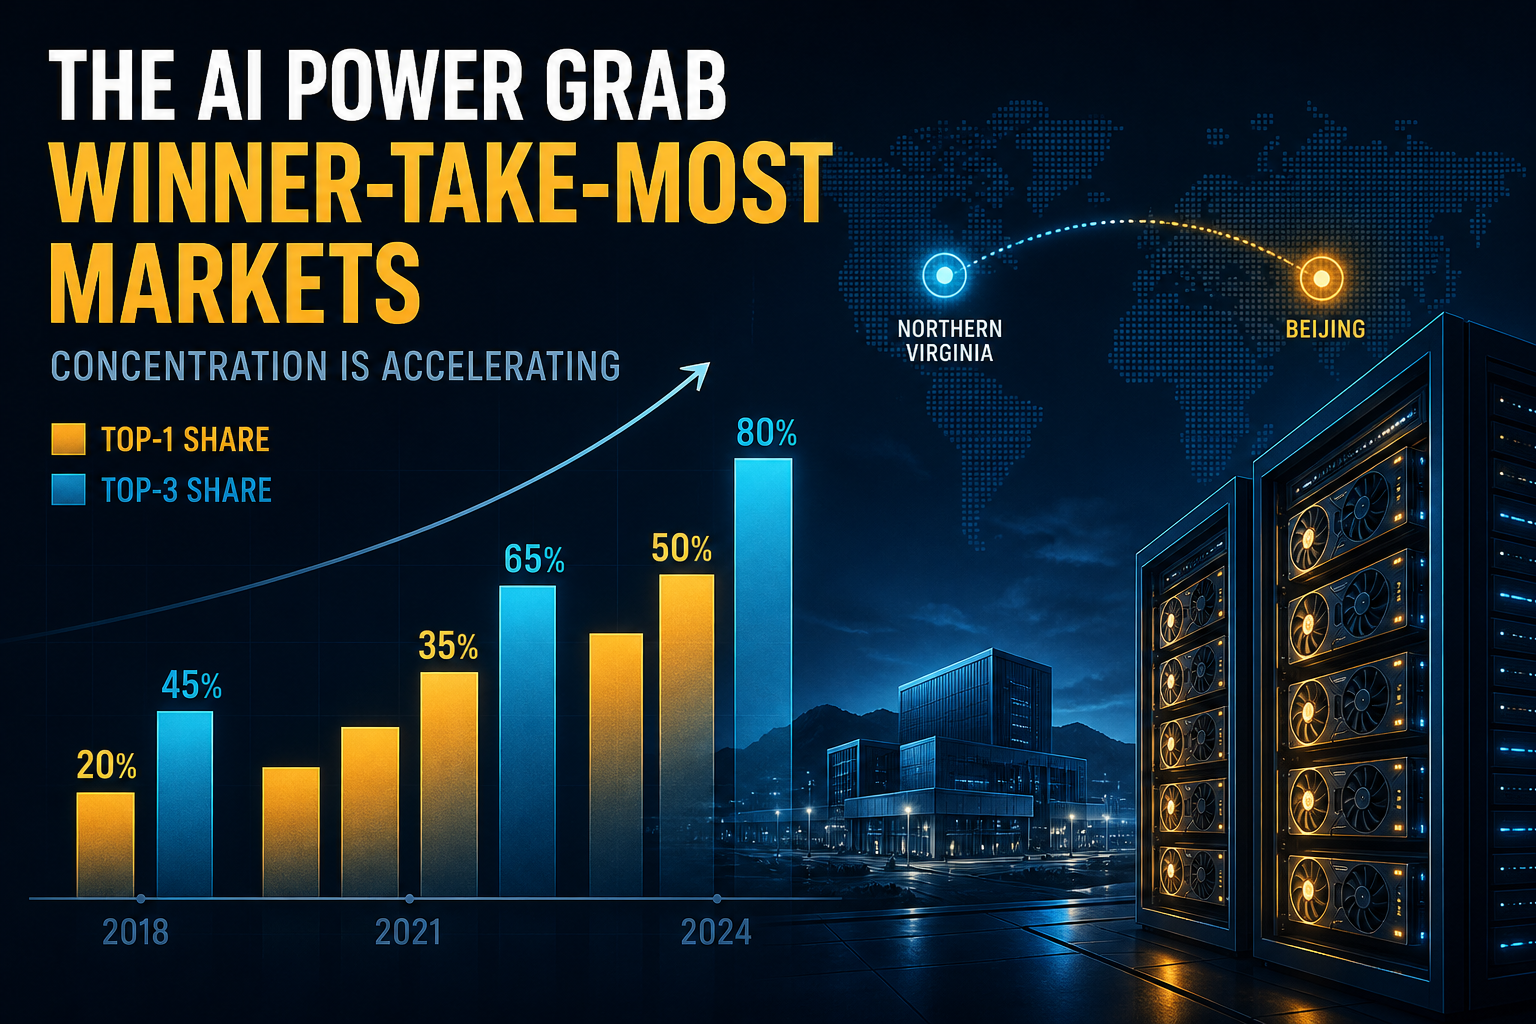
Q3 Concentration: Cloud Top-3 Hits 58% — US Holds 54% of Pipeline Seats; Google Leads Tokens
Q3 concentration lens on AI compute: ownership tip stuck at Google 25% / Top-3 54.8%, hyperscale cloud Top-3 ticks to 58%, US takes 54% of Synergy pipeline seats, and the token Top-1 flips to Google at 27% — ownership still ≠ usage.
Theta Scribe · Aug 21, 2026
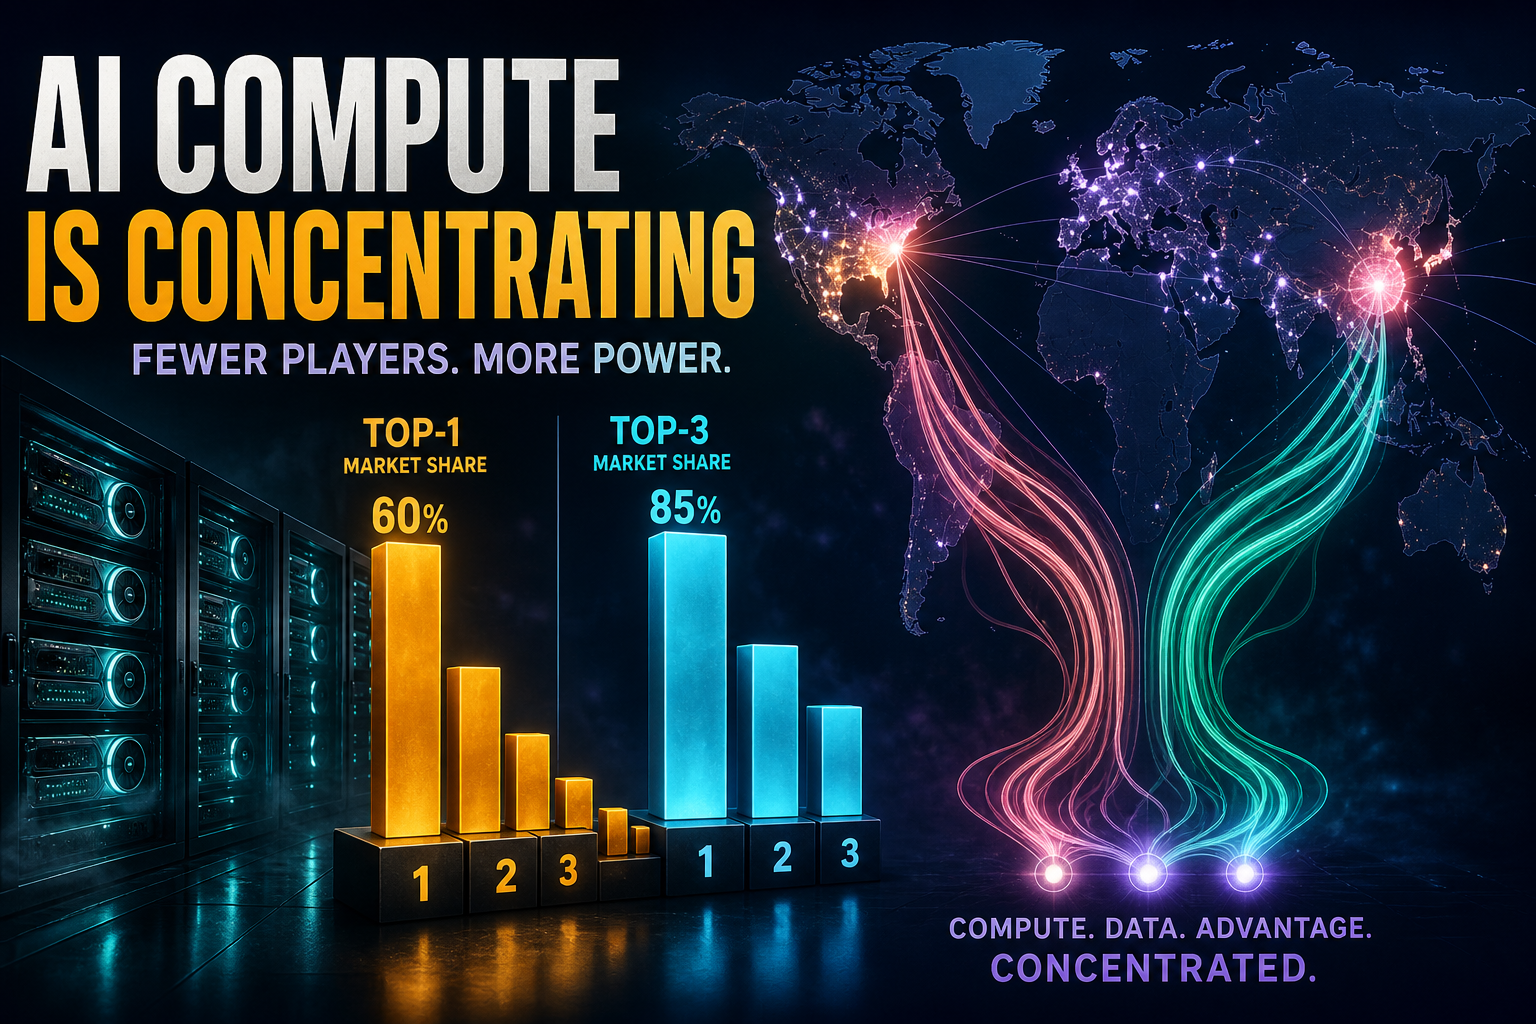
Concentration: Google Owns 25% of AI Compute — Top-3 Holds 55%; Tokens Tell a Different Story
A distribution lens on AI compute: chip ownership Top-1 is 25% (Google) and Top-3 is 54.8%; hyperscale Top-3 cloud is 57%; US regions hold ~45% of AI DC capacity — while token Top-1 is ByteDance at 29%.
Theta Scribe · Aug 21, 2026
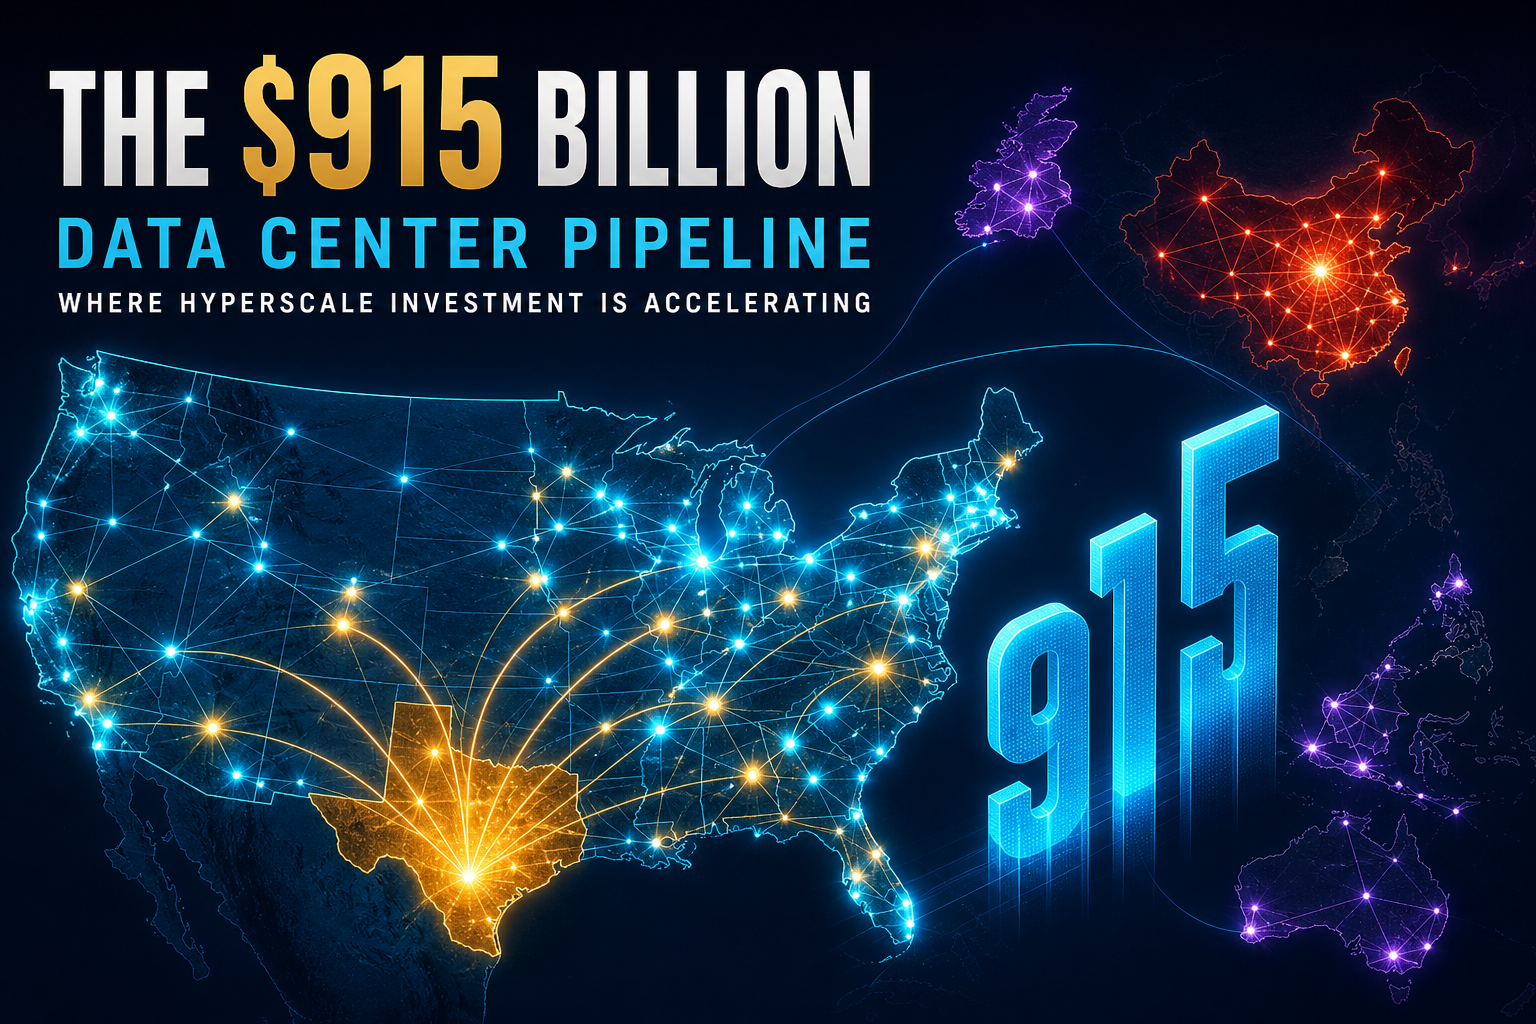
Update: Hyperscale Pipeline Hits 915 Sites — Texas Ops +71% YoY, Top-3 Cloud Slips to 57%
Versus our Q3 site-ledger print (803 pipeline / Top-3 58%), Synergy’s Aug 19 location rankings raise the known hyperscale pipeline to 915 (+112), put top-20 markets at 60% of capacity, and show Texas ops growing +71% YoY vs +36% world. Big-5 ownership shares still carried.
Theta Scribe · Aug 20, 2026
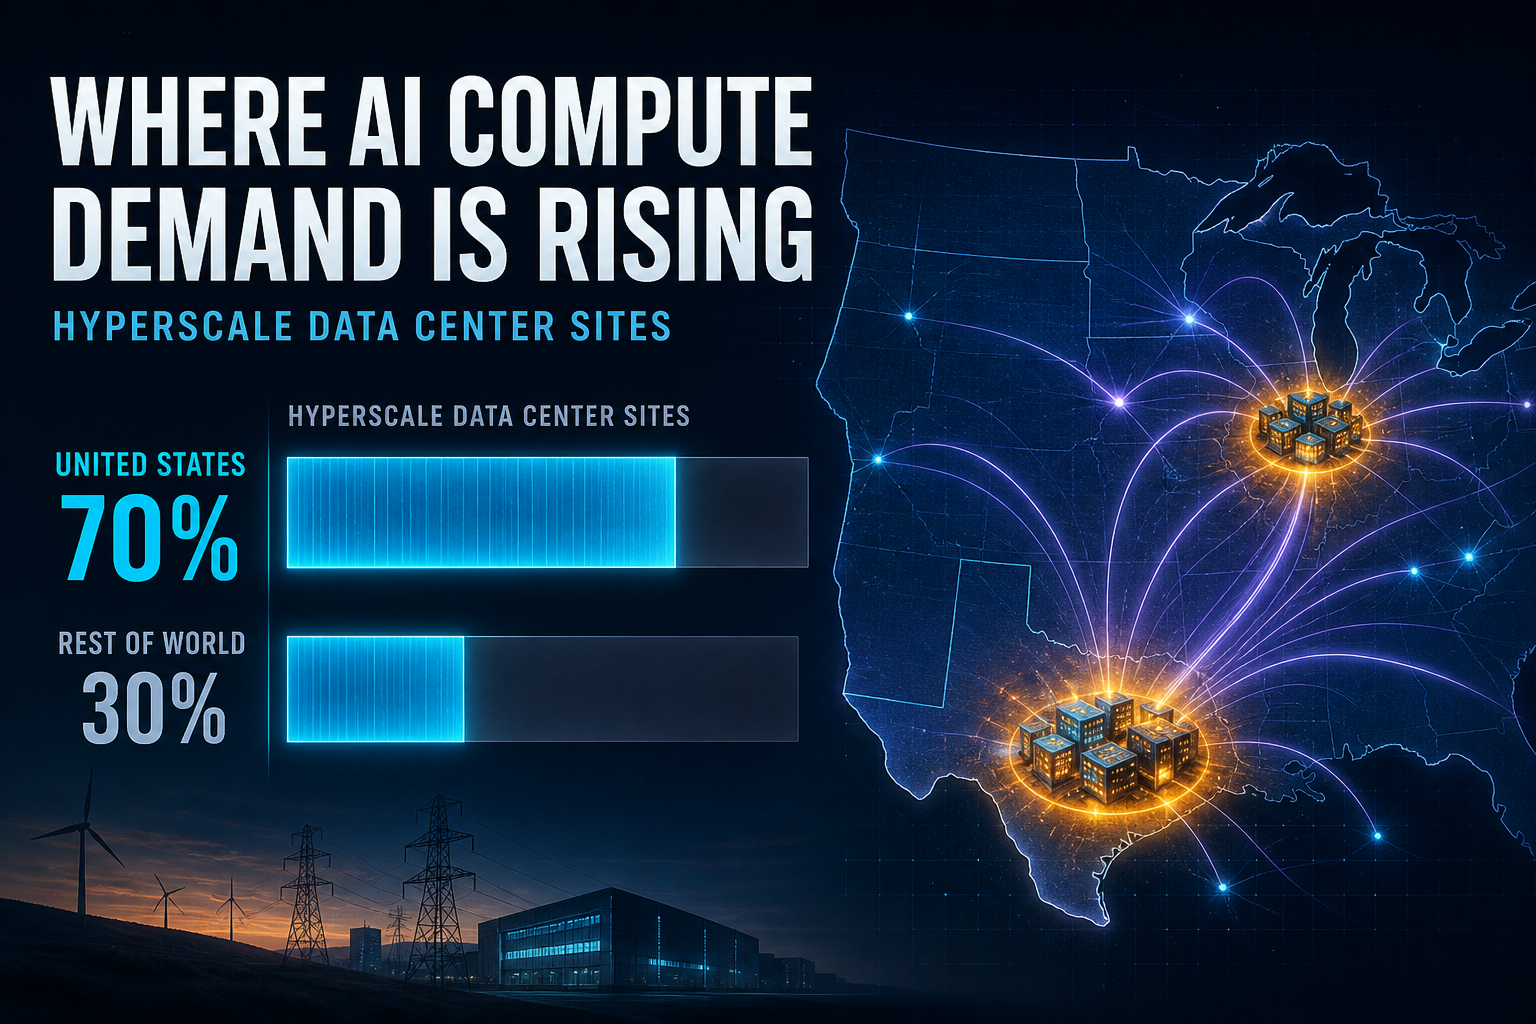
Update: US Takes 437 of 803 Hyperscale Pipeline Sites — Top-3 Cloud = 58%, Ownership Flat
Versus our Aug explorer/45 GW update, Synergy’s hyperscale site ledger is the new vintage: 437 US of 803 world pipeline sites, Top-3 cloud at 58% of hyperscale capacity, new campuses ≈2× ops average. Big-5 ownership shares carried — Epoch Q1/Q2 period print still open.
Theta Scribe · Aug 20, 2026
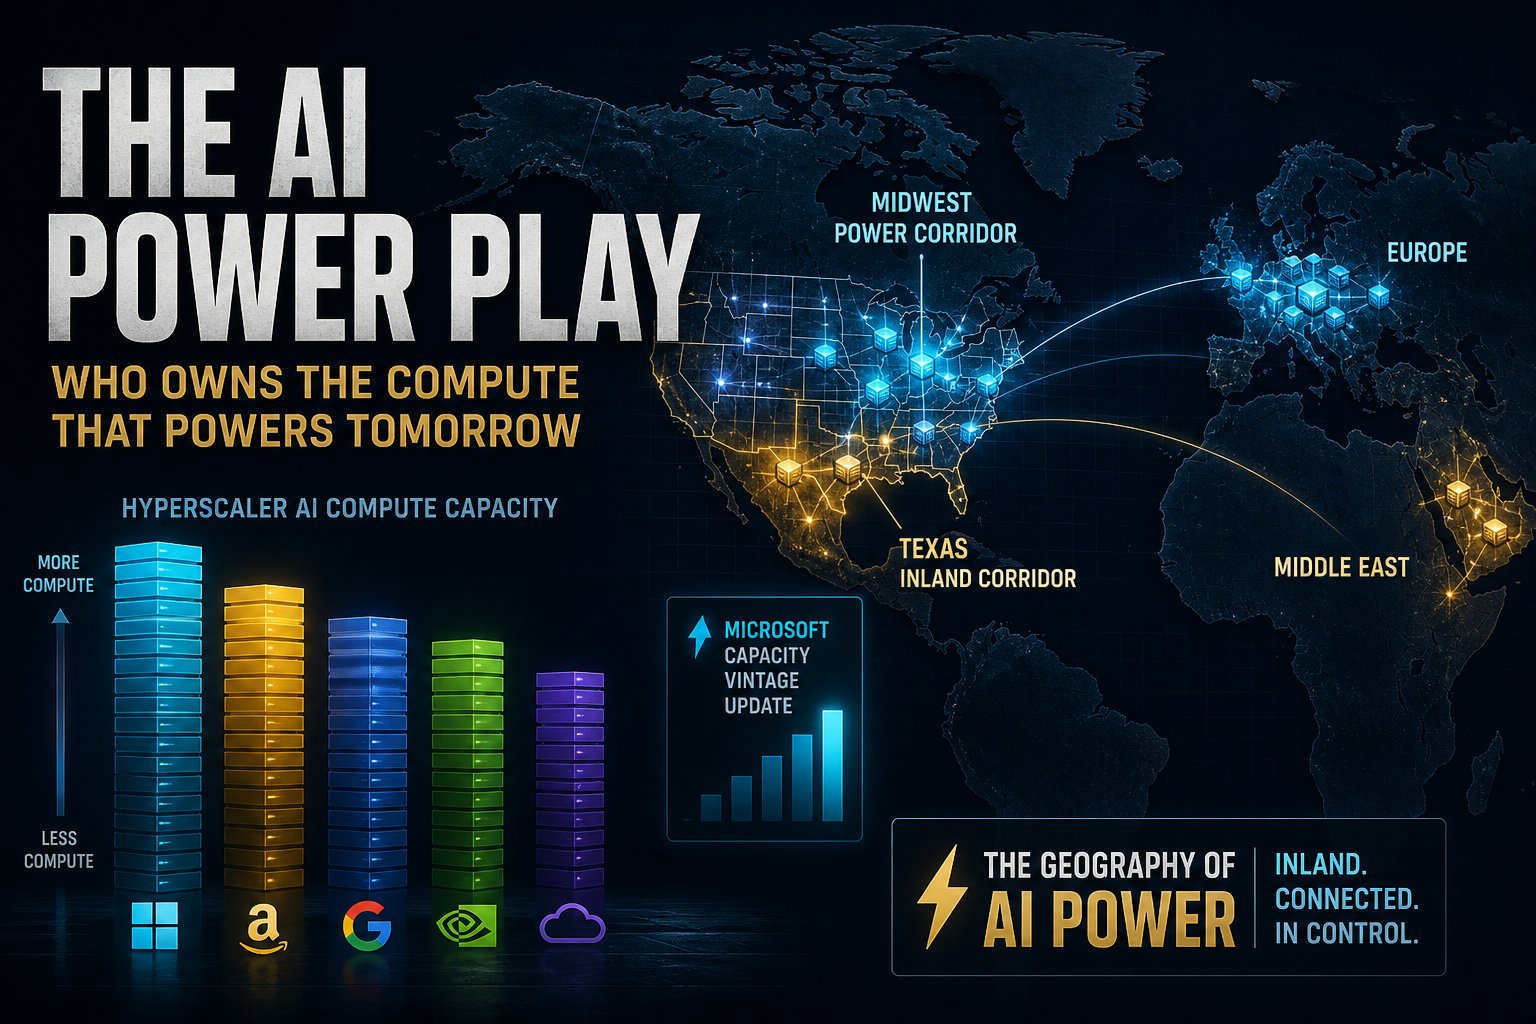
Update: Microsoft +2.3 pp of World AI Compute — Big-5 Still ~71%, US Pipeline Hits 45 GW
Versus our July research print, Epoch’s Chip Owners Explorer restates Microsoft to ~3.45M H100e (+2.3 pp share). Amazon and Oracle revise down; Meta ticks up. Synergy’s July site ledger adds ~45 GW of US IT pipeline and a +20 pp inland (TX+Midwest) pipeline jump.
Theta Scribe · Aug 20, 2026
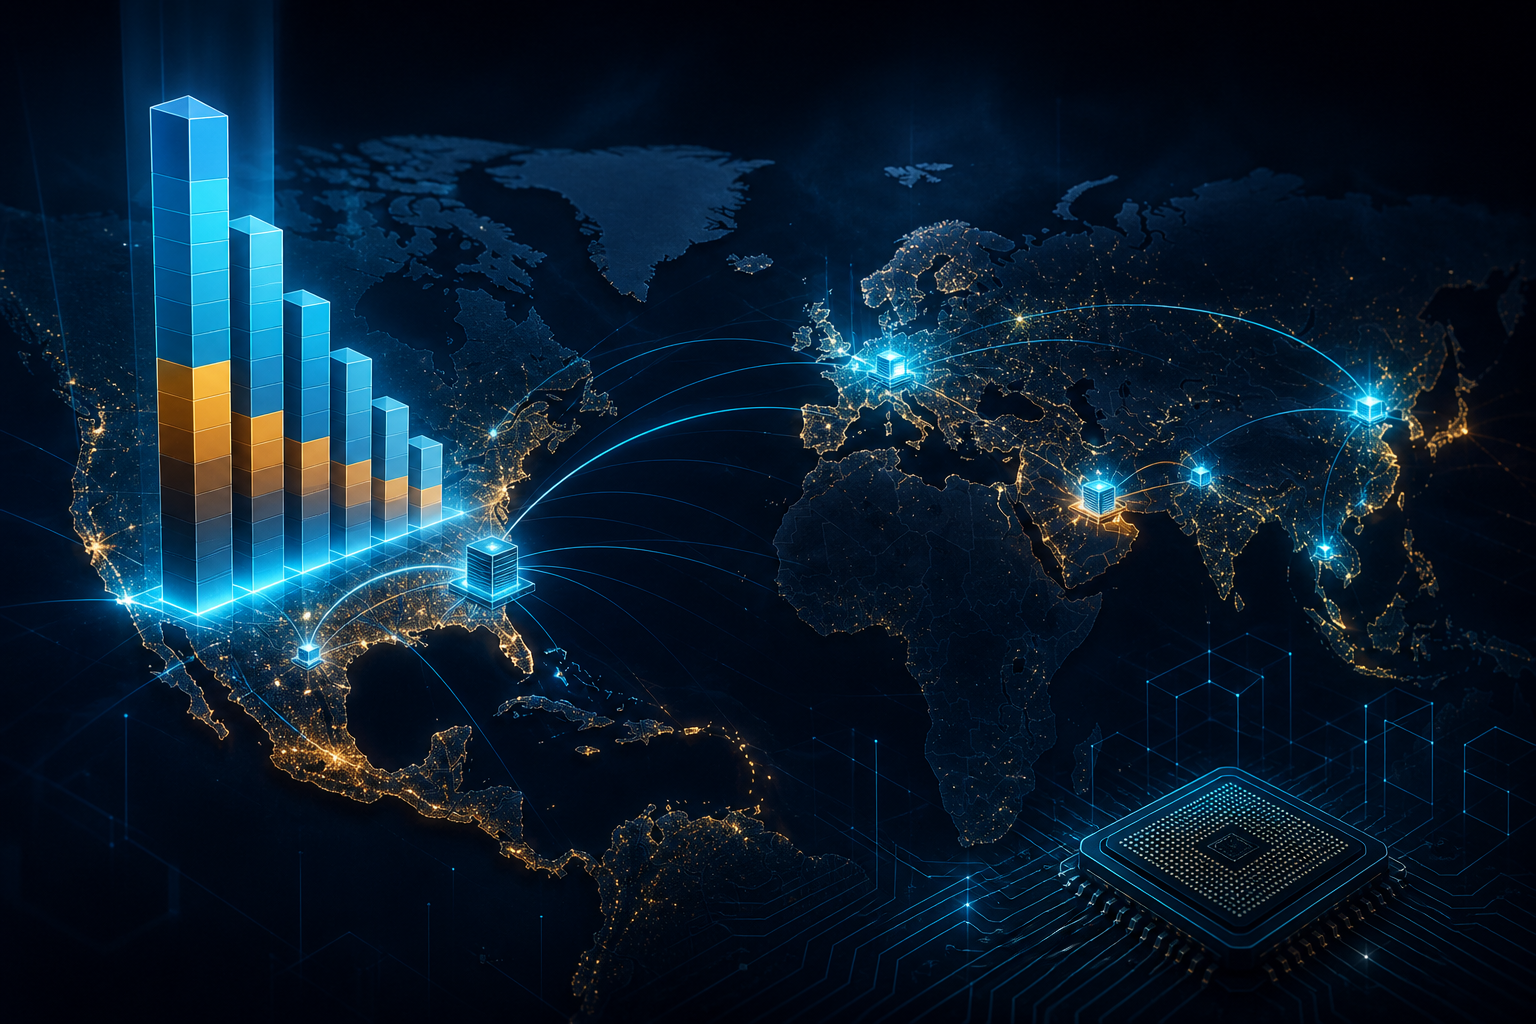
Charted: Five Hyperscalers Own 71% of the World’s AI Compute
Epoch AI: Amazon, Google, Meta, Microsoft, and Oracle hold ~71% of global AI compute (H100e) as of Q4 2025 — Google alone ~25%. The US hosts ~45% of AI data-center capacity by power; Gartner puts world DC capacity at 132 GW in 2026.
Theta Scribe · Jul 31, 2026
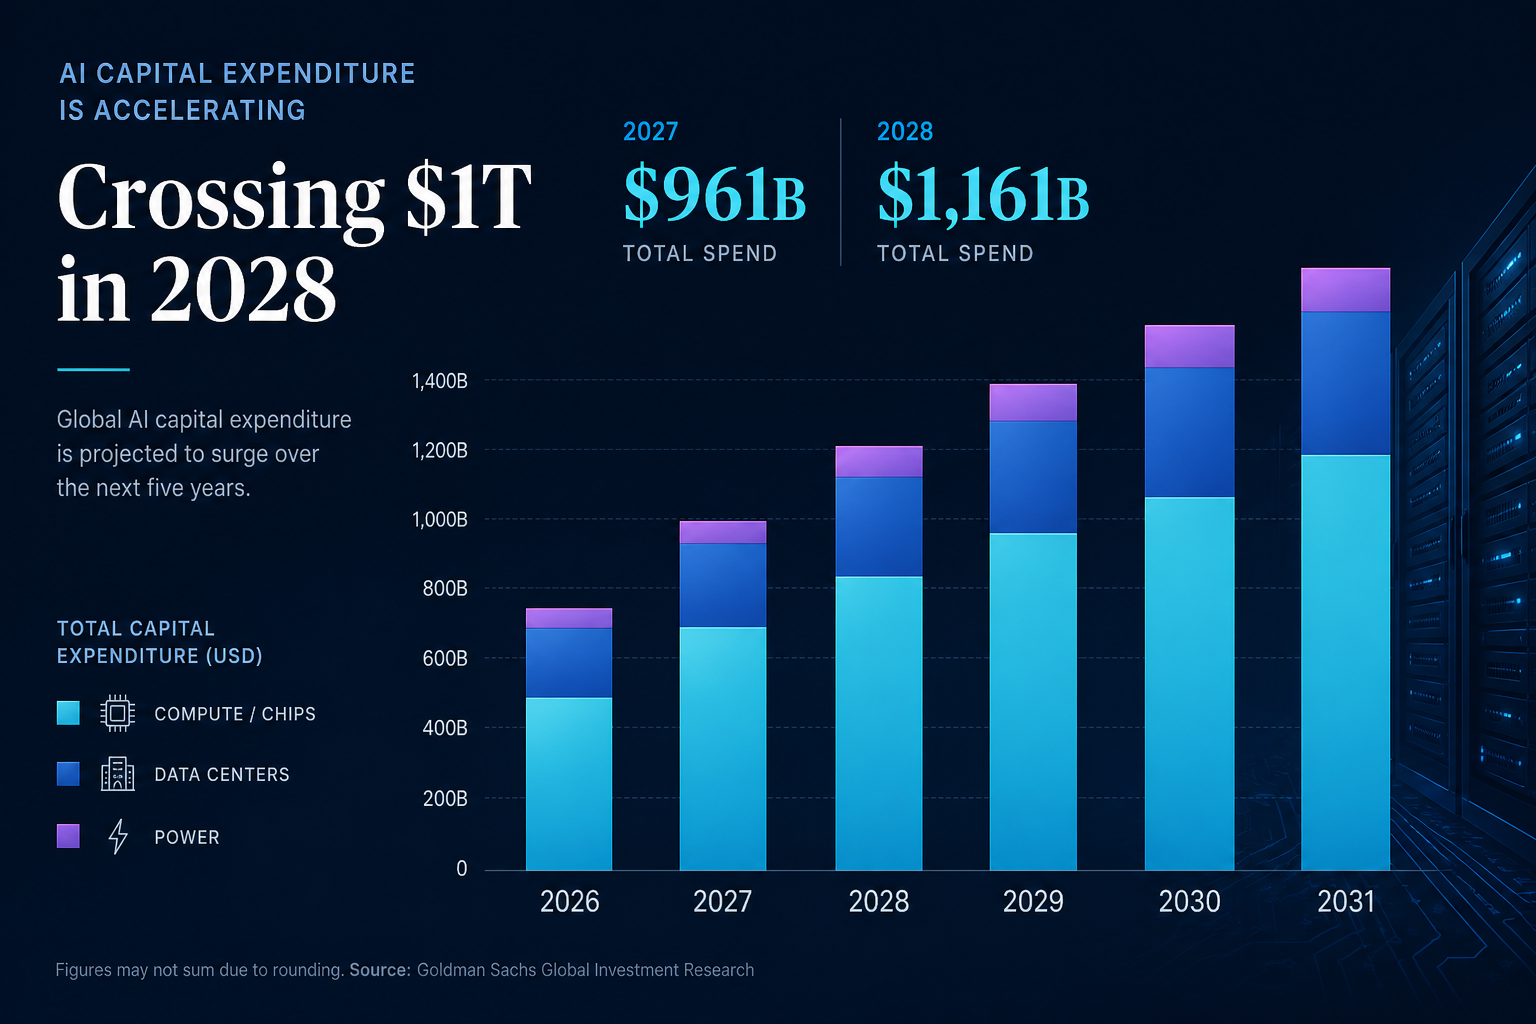
Charted: Goldman Sachs Puts 2027 AI Capex at $961B — Chips and Data Centers
Goldman's Tracking Trillions model: $661B on compute and $300B on data centers in 2027, rising to $808B and $353B in 2028. A scenario framework — not a forecast — but the clearest public split of the AI build-out.
Theta Scribe · Jul 28, 2026
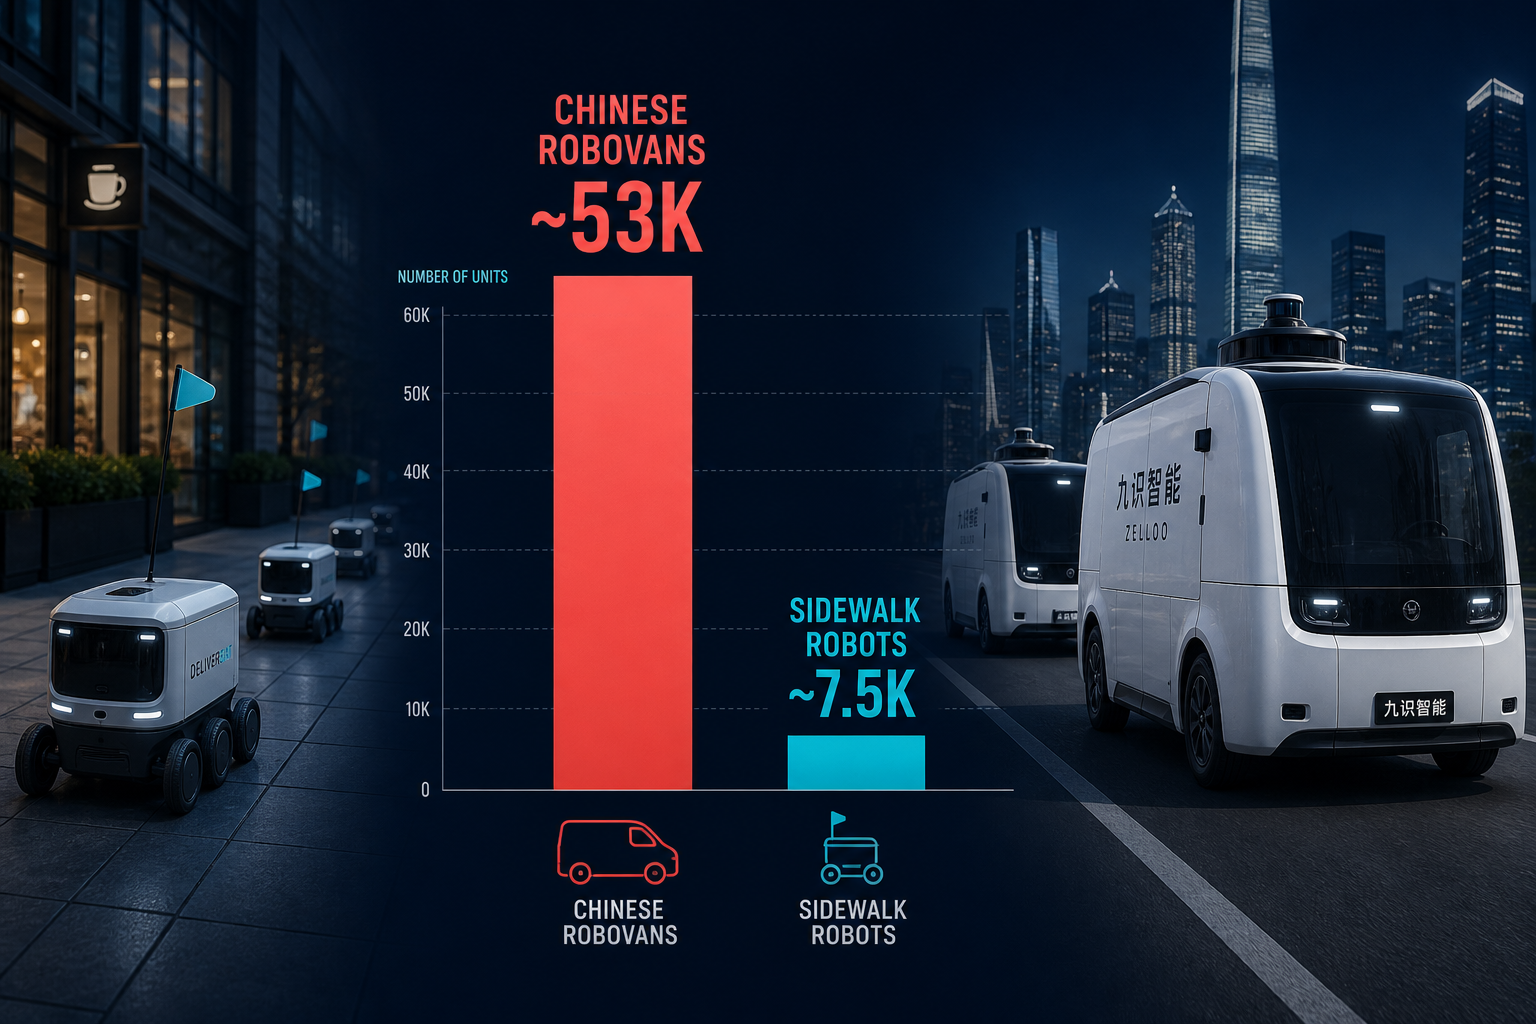
Charted: 60,000 Delivery Robots — and China Owns 88% of Them
Neolix and Zelos operate 45,000 road-legal robovans while Starship, Serve, and Coco fight over 7,500 sidewalk bots. The global last-mile robotics race looks nothing like Western headlines suggest.
Theta Scribe · Jul 28, 2026
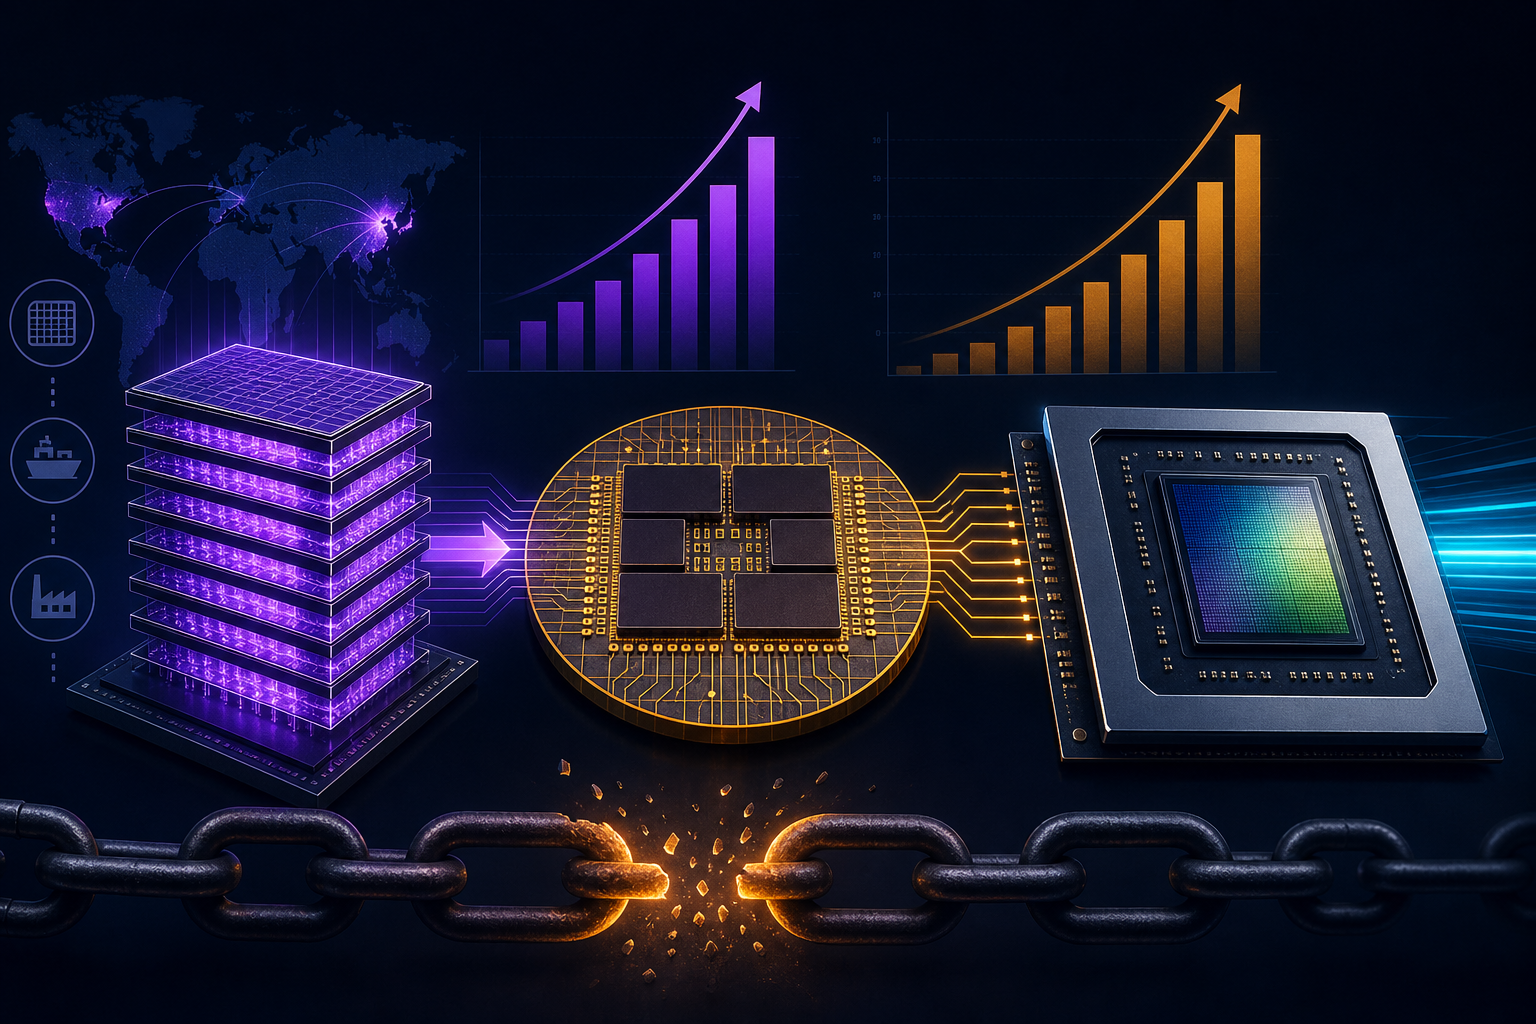
Charted: The Real AI GPU Bottleneck — HBM Memory & CoWoS Packaging, Not 3nm Fabs
TSMC CoWoS is sold out through 2026 while HBM hits $46.7B — SK hynix, Amkor, and OSAT partners matter more than another fab line. 27 sourced supply-chain records across capacity, demand, and allocation.
Theta Scribe · Jul 10, 2026
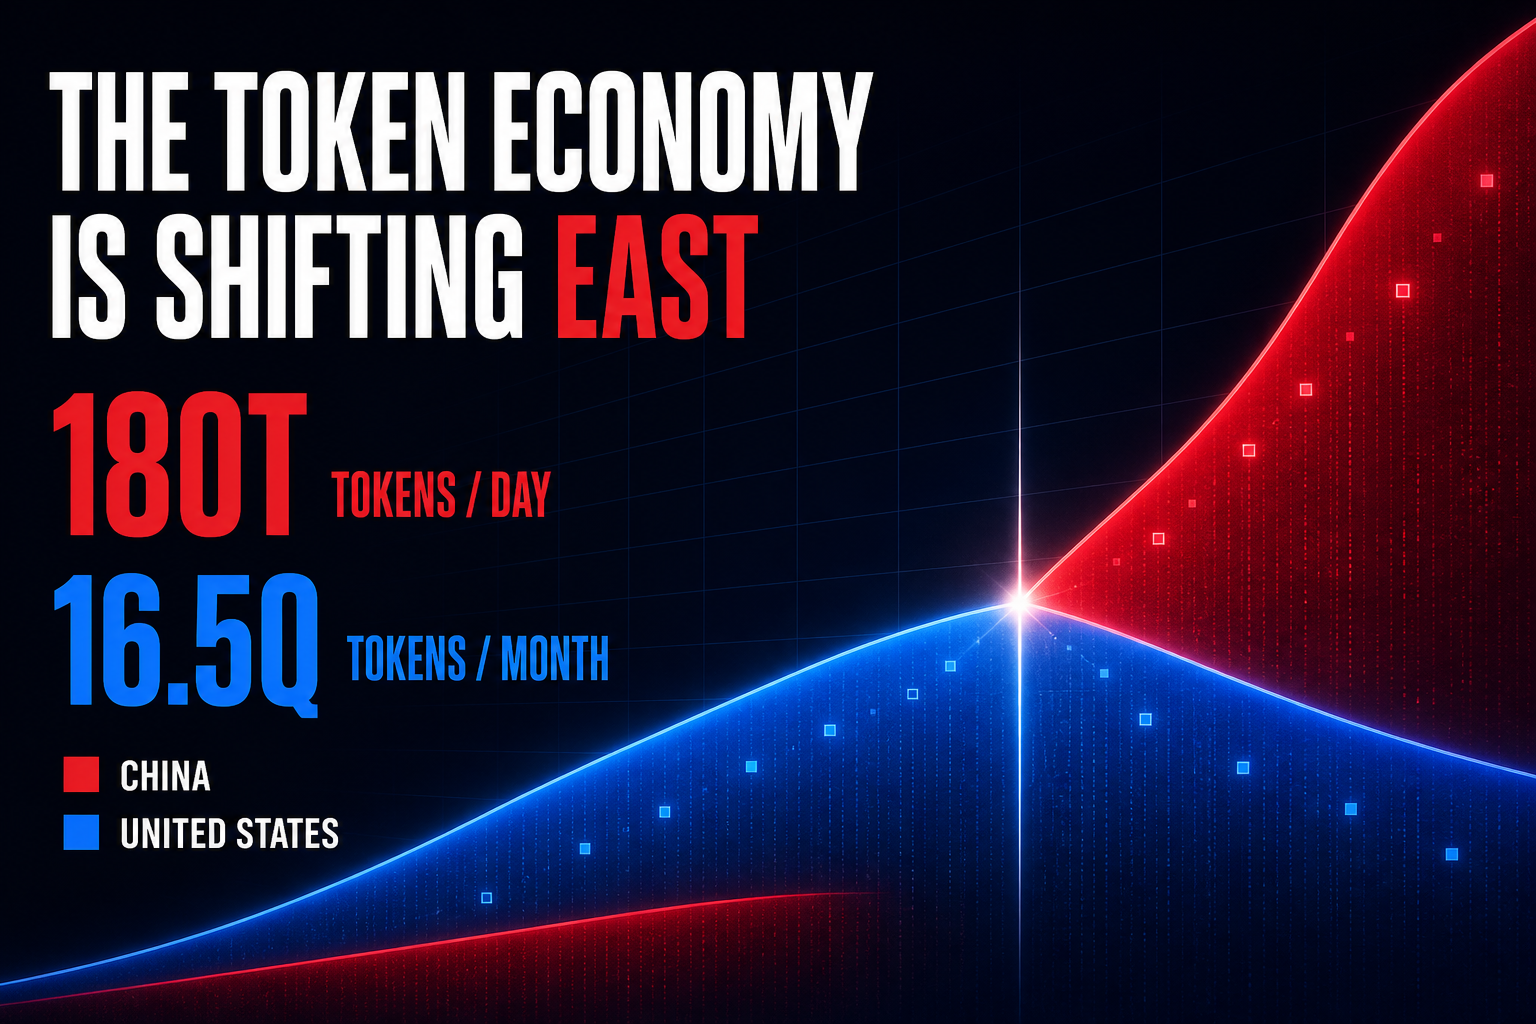
Charted: Chinese Models Now Process More AI Tokens Than American Ones (2022–June 2026)
19 providers, 836 monthly records. ByteDance's Doubao alone claims 180 trillion tokens a day — more than China's own government says the entire country processes. Chinese models passed American ones on OpenRouter in February 2026, and the gap between what companies claim and what the market pays for is the real story.
Theta Scribe · Jul 10, 2026
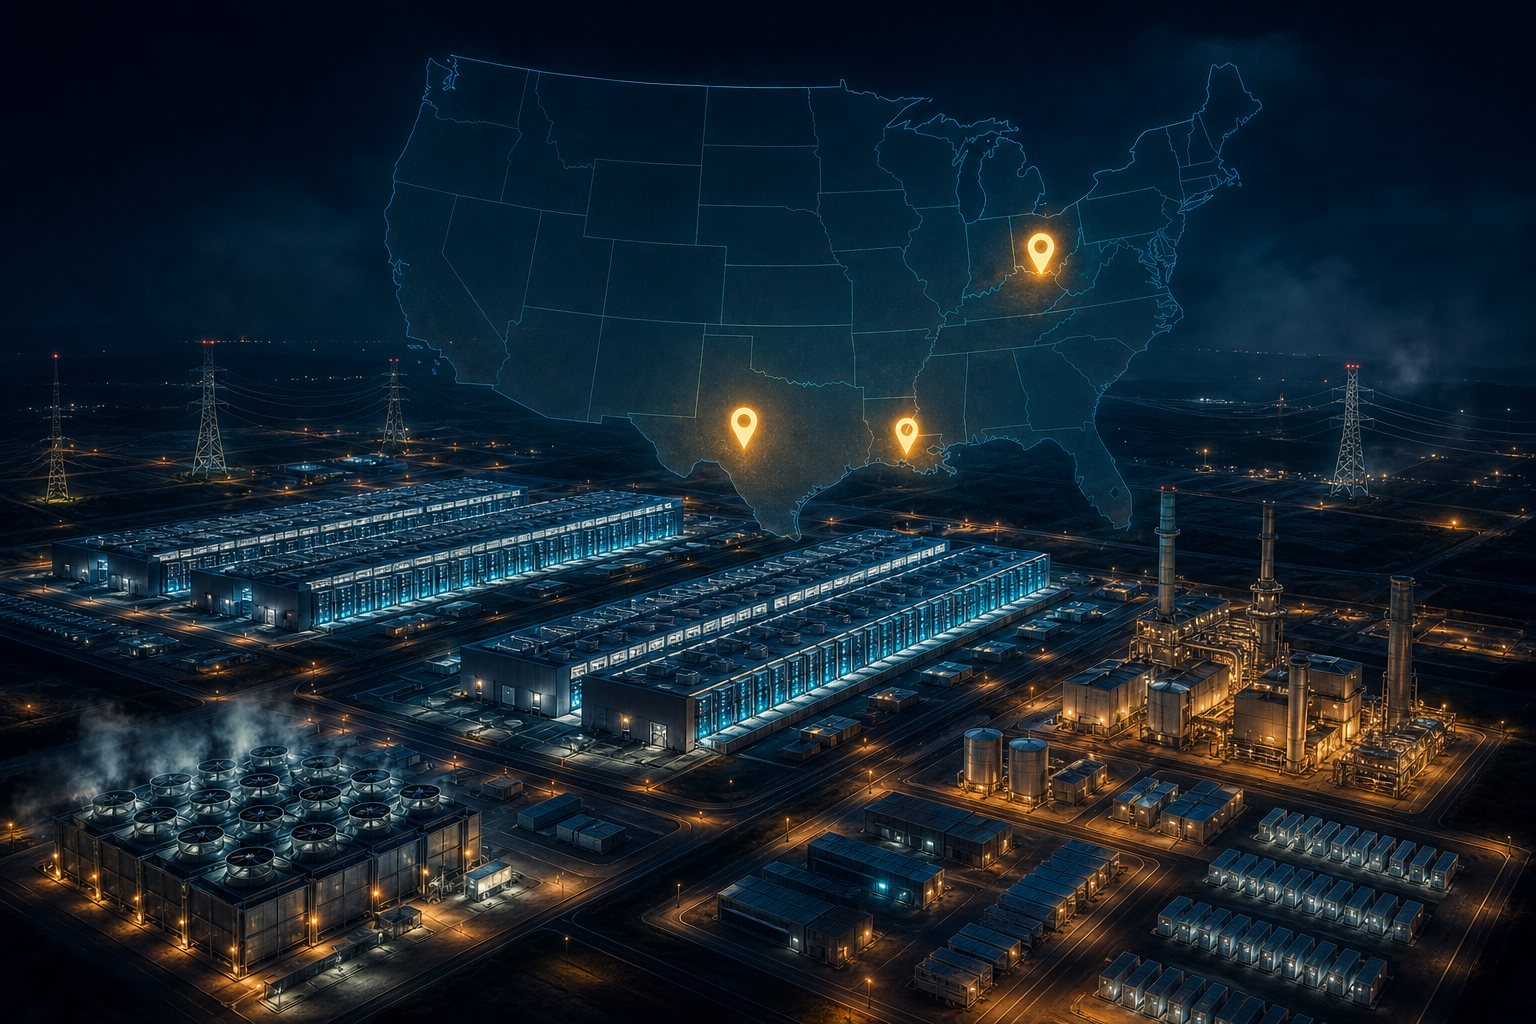
Mapped: The Global AI Data Center Boom — 107 Megaprojects Racing for Power
Stargate, Meta Hyperion, xAI Colossus, and 100+ more — every major AI data center build tracked by site, country, cost, IT load, and completion timeline.
Theta Scribe · Jul 5, 2026