
Research desk
Transport & Logistics
11 original visual essays in this beat — each with its own figure and sourced argument, not a sequel of the last chart.
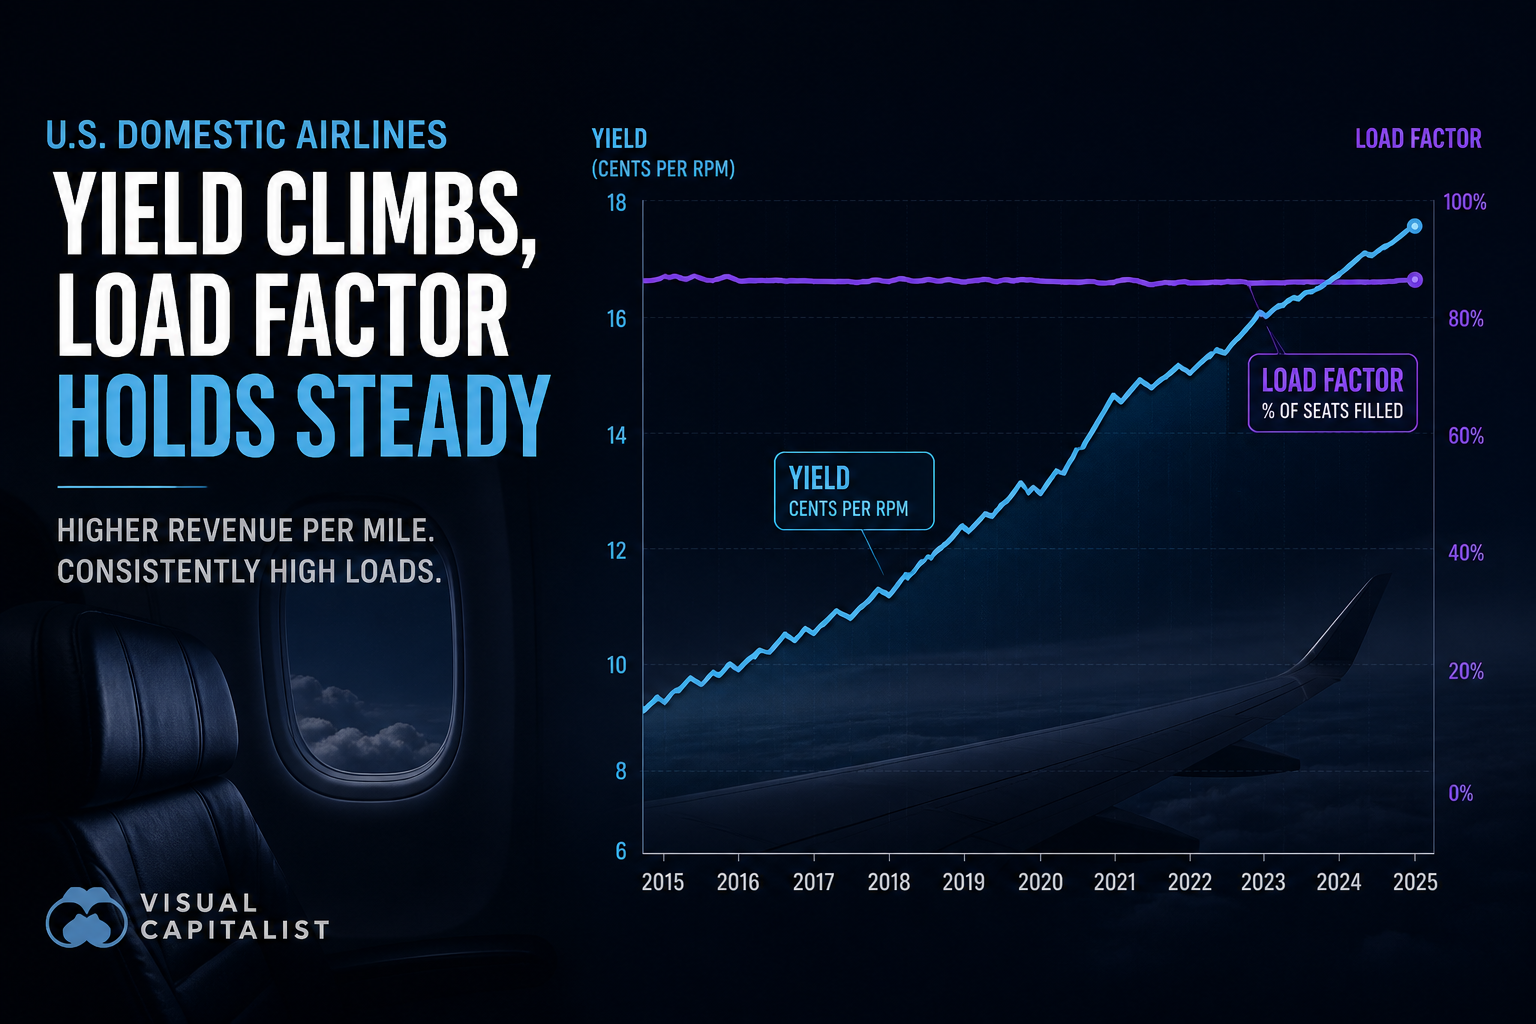
Domestic Passenger Yield vs Load Factor: Did Cents-per-Mile Pricing Rise While Planes Stayed Full?
April 2026 domestic yield prints 17.12¢/RPM — up 14% from 2019 — while load factor holds 79.6%, only five points below the pre-COVID baseline and within shouting distance of July 2024’s 87.5% record.
Theta Scribe · Aug 31, 2026

6.8% Poor Spans, 168.6M ADT: Structurally Deficient Bridges Versus Daily Traffic
FHWA’s 2024 National Bridge Inventory still lists 42,080 Poor bridges — 6.8% of the stock — yet those spans carry 168.6 million average daily traffic, about 3.4% of inventory ADT.
Theta Scribe · Aug 30, 2026

Airline Fares CPI vs Jet-Fuel Prices: How Closely Do Tickets Track Gulf Coast Fuel Since 2019?
On a 2019 = 100 scale, July 2026 airline fares sit at 117 while U.S. Gulf Coast jet fuel is at 181 — a 64-point gap, with fuel leading fares by about one month (r ≈ 0.77).
Theta Scribe · Aug 30, 2026

Diesel Still Takes 66% of New School Bus Deliveries
In the 2024–25 OEM production cycle, diesel accounted for 66.1% of new Type A/C/D school buses — up 6.5 points from 2022–23 — while electric held near 7% and propane slipped to 4%.
Theta Scribe · Aug 26, 2026
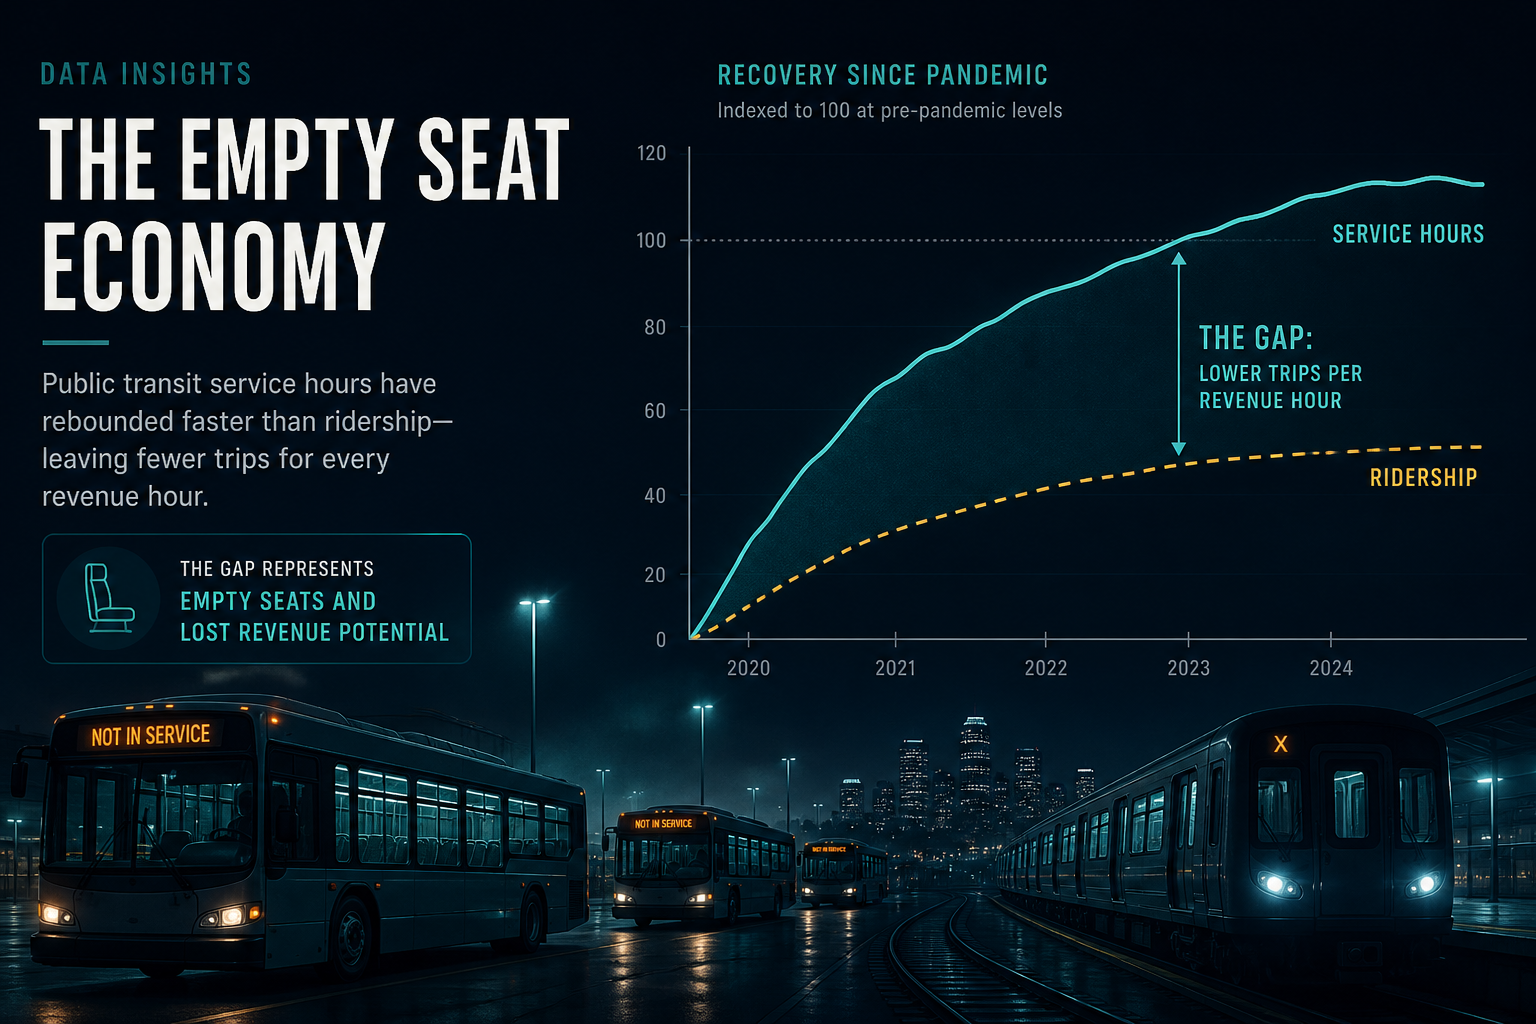
Trips per Vehicle Revenue Hour Sit at 82% of 2019 — Service Hours Recovered Faster Than Riders
FTA NTD and APTA prints put calendar-year 2024 vehicle revenue hours near 95% of 2019 while unlinked passenger trips reached only about 78%. That 17-point service lead leaves trips per VRH near 82% of the pre-pandemic load — restored schedules with thinner loads, especially on heavy and commuter rail.
Theta Scribe · Aug 26, 2026
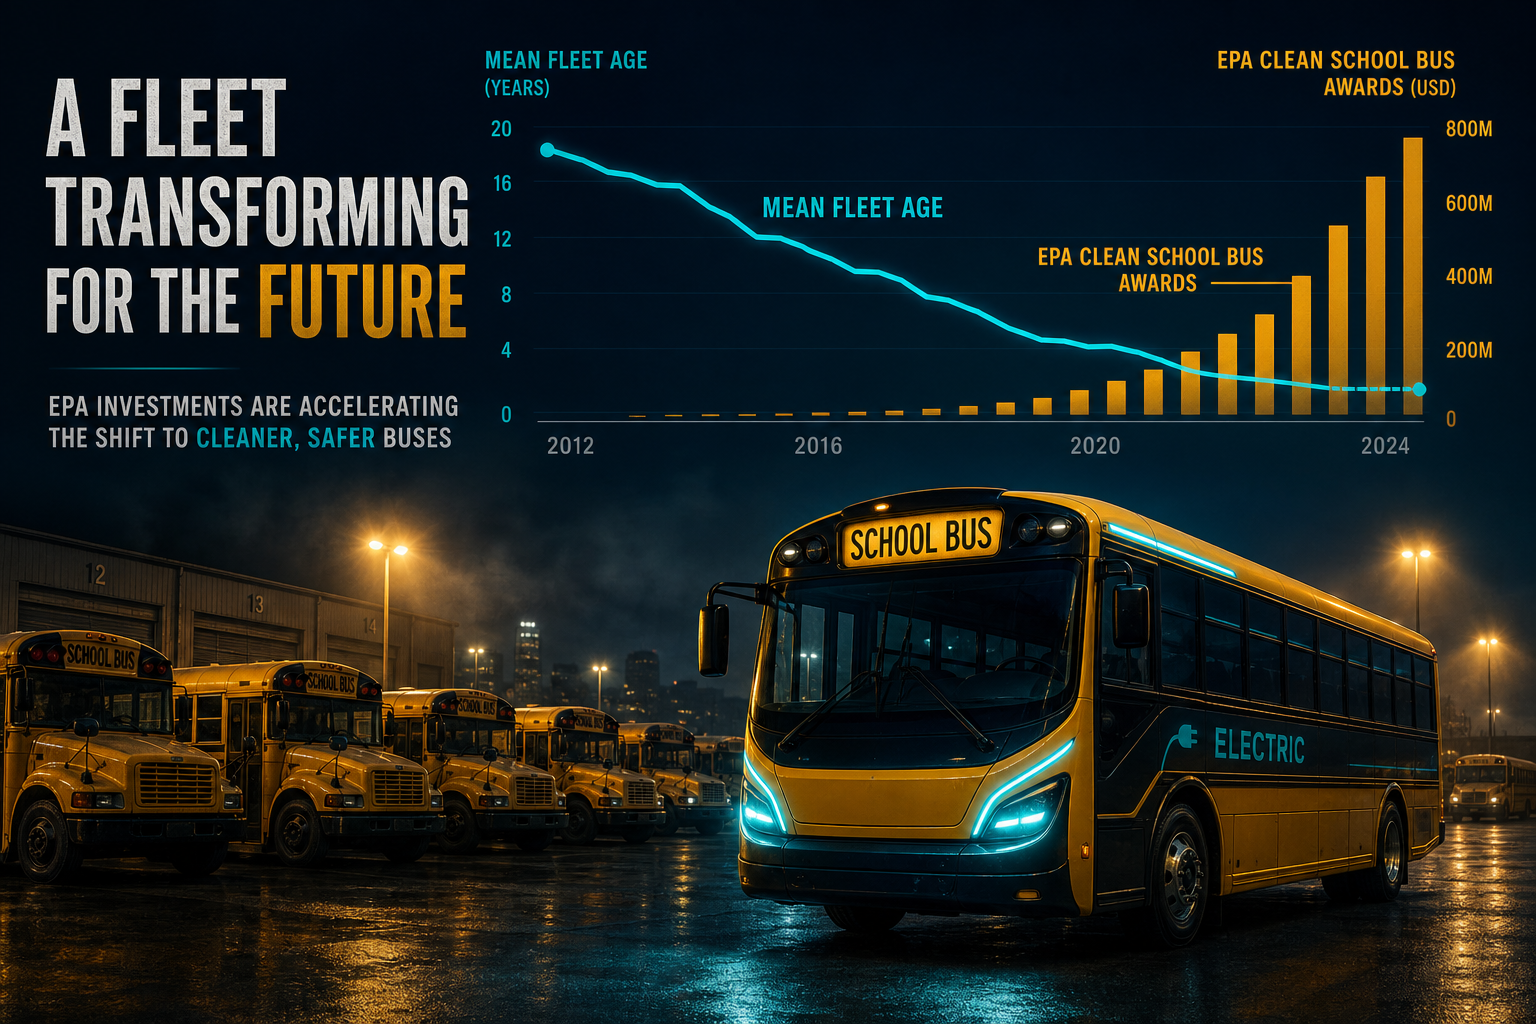
Mean School-Bus Age Fell to 8.3 Years — But EPA Clean Awards Still Cover Only 1.8% of the Fleet
School Bus Fleet’s 2026 maintenance survey puts mean yellow-fleet age at 8.3 years, a full year below the 2022–23 peak of 9.3. EPA’s Clean School Bus Program had awarded almost $3 billion for more than 8,500 replacements by end of FY2024 — still under 2% of the 483,000-bus national stock, which remains roughly 90% diesel.
Theta Scribe · Aug 26, 2026

Charted: Van Spot’s Last Month Above Contract Was January 2022 — Food & Beverage Still Took the Biggest Renewal Lift
DAT’s national van spot last beat contract in January 2022 ($3.11 vs $2.98); by July 2022 spot sat about 58¢ under. Fall renewal awards still hit food & beverage hardest (+19% YoY) — specialized capacity priced the RFP, not the spot tape alone.
Theta Scribe · Aug 26, 2026
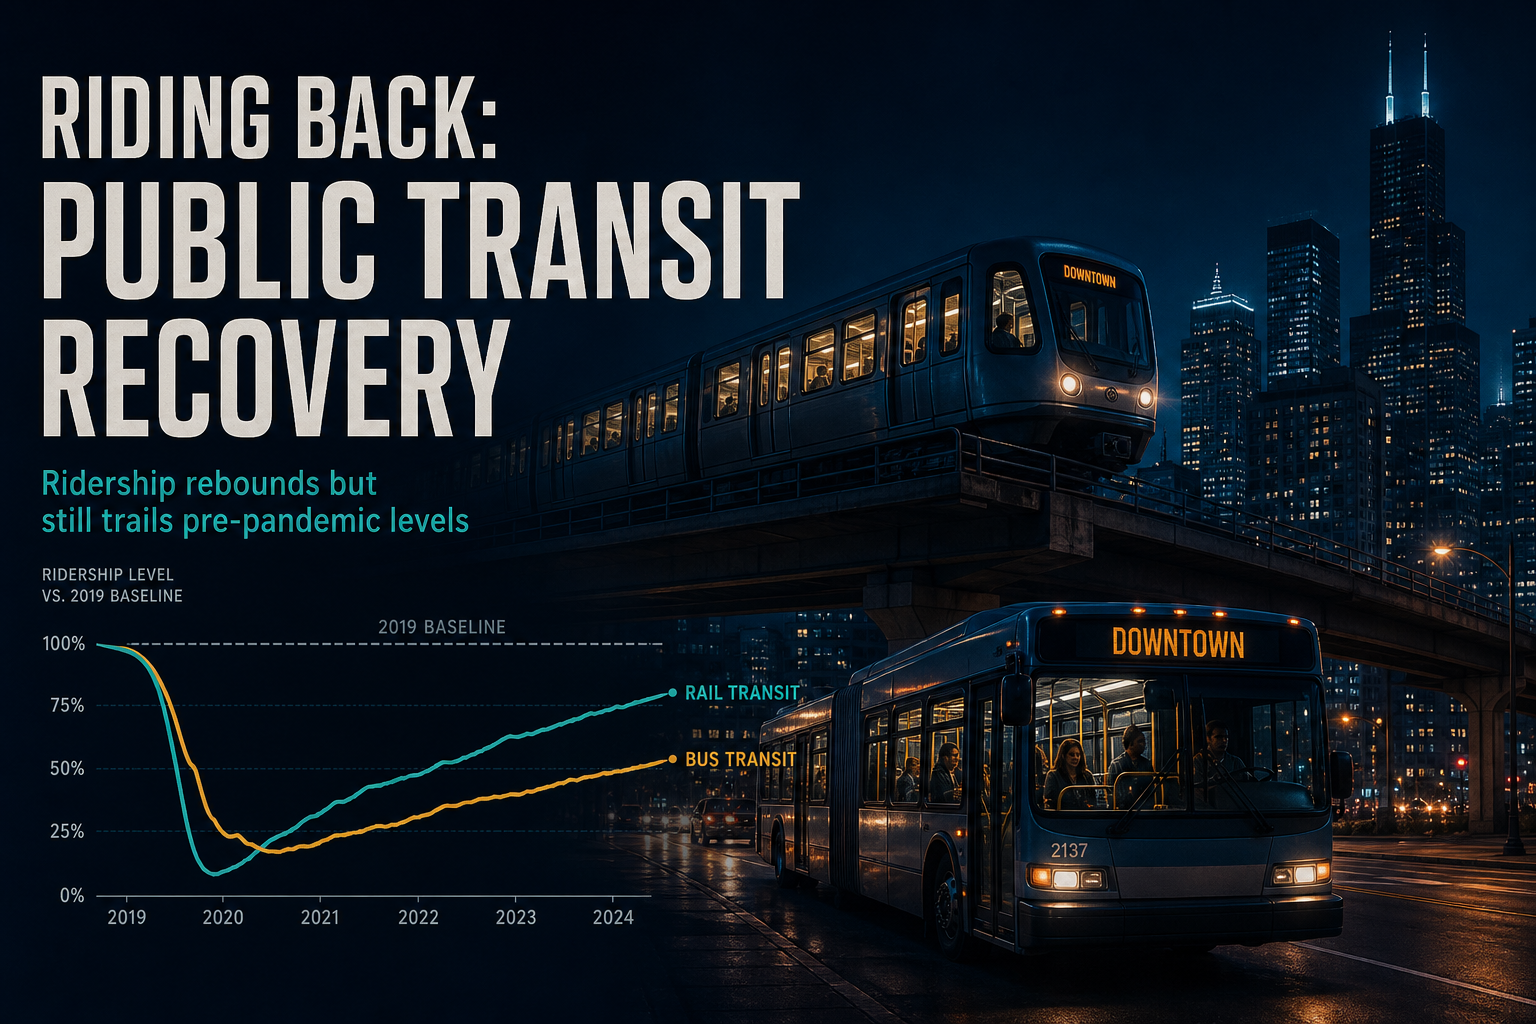
Transit UPT Index vs 2019: Mid-Size Agencies Near 88, Mega Urban Stuck Near 74
U.S. unlinked passenger trips closed 2024 at about 79% of 2019. Bus leads rail by roughly 14 index points (86 vs 72), mid-size reporters median near 88, and only about 7% of the largest 150 agencies have fully recovered.
Theta Scribe · Aug 26, 2026
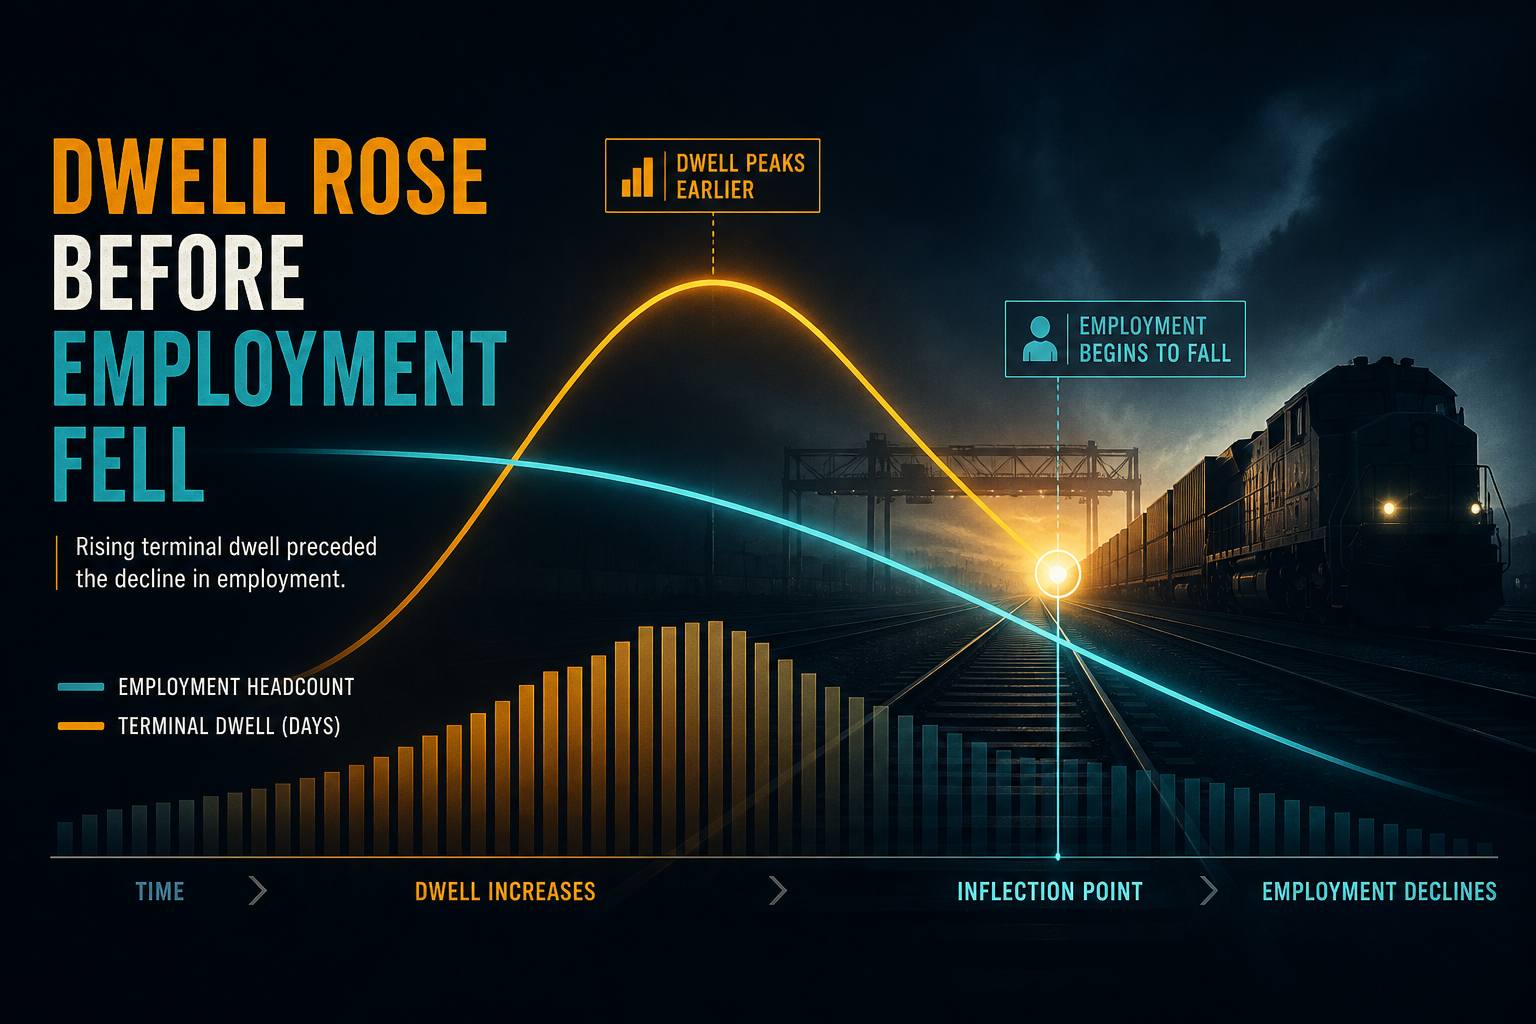
Charted: Class I Rail Headcount Fell ~29% Under PSR — Terminal Dwell Rose First
STB Class I employment dropped from ~163k in 2015 to ~116k in 2022 (−29%). AAR terminal dwell climbed ~4.7 hours by 2019 — about three years before the employment trough — then eased while payrolls stayed thin. Headcount vs dwell inflection, not a single-year shock.
Theta Scribe · Aug 25, 2026

Charted: Trucking Spot Rates Fell Roughly Half From the 2022 Peak — Authority Exits Surged Months Later
After the 2022 dry-van spot peak, national linehaul fell roughly by half peak-to-trough while monthly FMCSA authority exits surged on a lag through 2023–24. By mid-2026 the top 1% of active fleets held ~42% of power units among survivors.
Theta Scribe · Aug 23, 2026

Charted: Freight Rail Velocity Fell 12% While Revenue per Carload Rose 28%
STB system train speed dropped about 12% peak-to-trough from late 2019 into 2022 while a Class I revenue-per-carload index climbed ~28%. By mid-2026 speed had regained most of the gap, but rates still sat ~18% above the 2019 base — and Kansas City, Memphis, and Laredo still lag on dwell.
Theta Scribe · Aug 23, 2026