
Research desk
Global Systems
64 original visual essays in this beat — each with its own figure and sourced argument, not a sequel of the last chart.
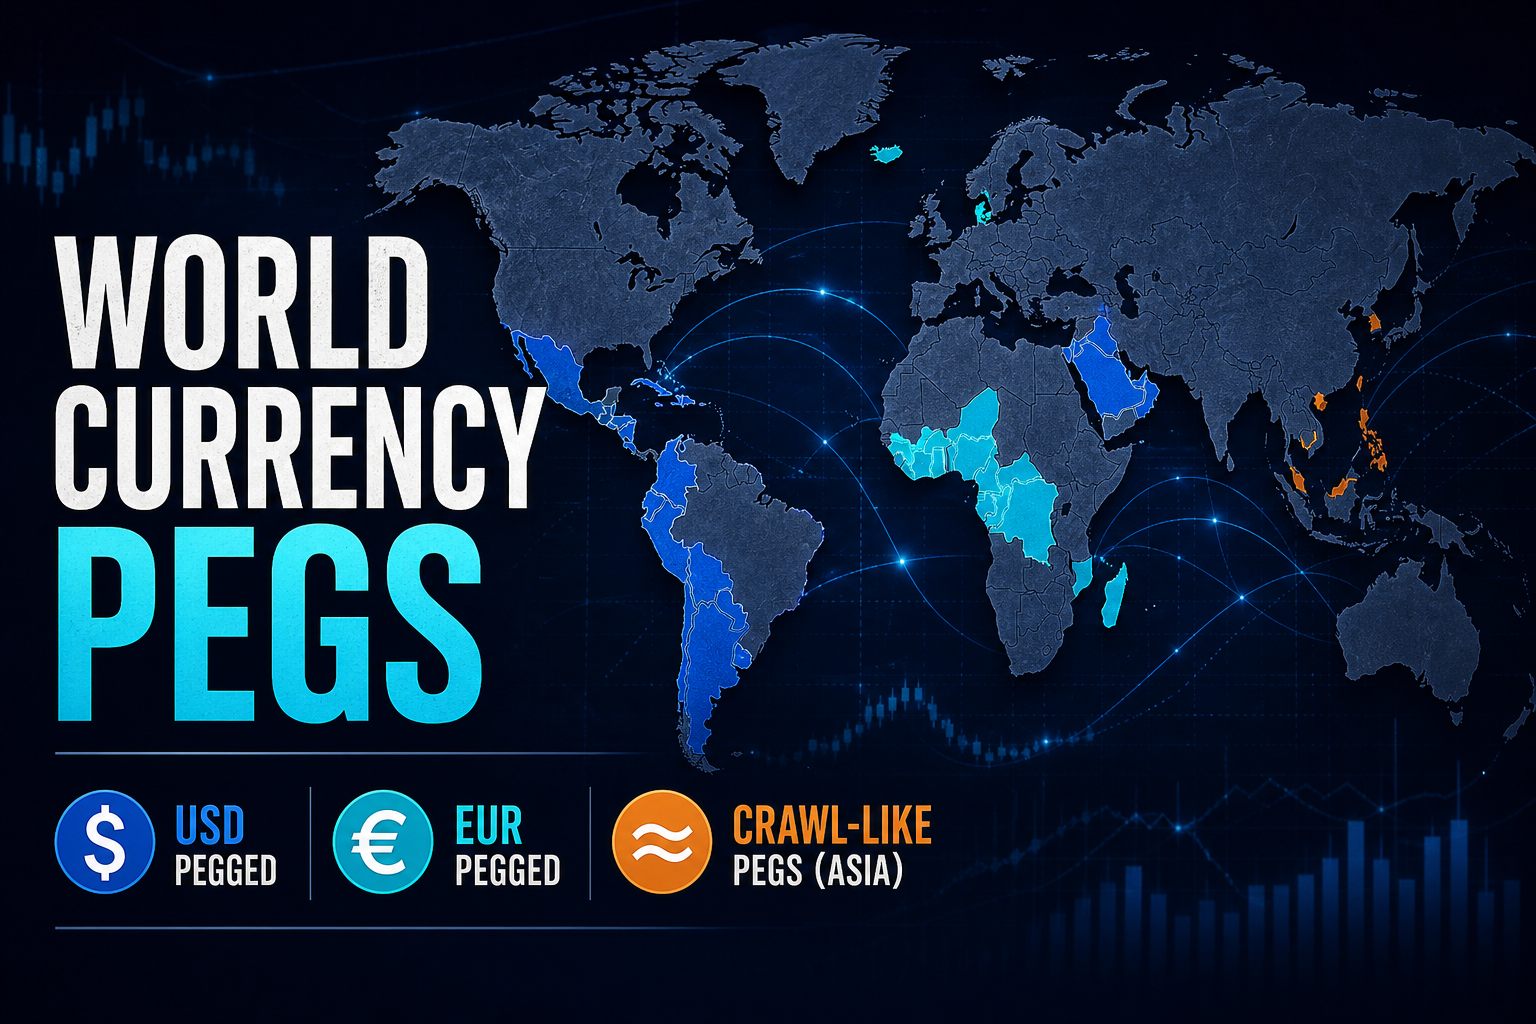
155 Countries Still Lock Their Exchange Rate to Someone Else's Currency
IMF AREAER 2023 de facto classes, updated through September 2026 — two world maps and a country table covering hard pegs, soft parities, dirty floats, crawl-likes, and the dual-rate regimes where the official price is not the price you get.
Theta Scribe · Sep 2, 2026

Phoenix and Las Vegas Alone Took Nearly 12% of U.S. Heat-Coded Deaths
Across 2018–2023, Maricopa and Clark counties logged 1,039 CDC heat-coded deaths — about 11.9% of the national total — while U.S. heat mortality climbed from 1,008 to 2,325.
Theta Scribe · Sep 2, 2026

Federal Firefighting Contract Aviation Hours: 81% of LAT/VLAT Time Ran Exclusive-Use in 2021 — CWN Rates Still 54% Higher per Day
USDA Forest Service calendar-year billing shows large airtanker hours split 81% exclusive-use vs 19% call-when-needed in CY2021 after a 2020 surge year when CWN carried nearly half of LAT/VLAT flight time. Published contract benchmarks still price CWN daily availability 54% above EU.
Theta Scribe · Sep 1, 2026
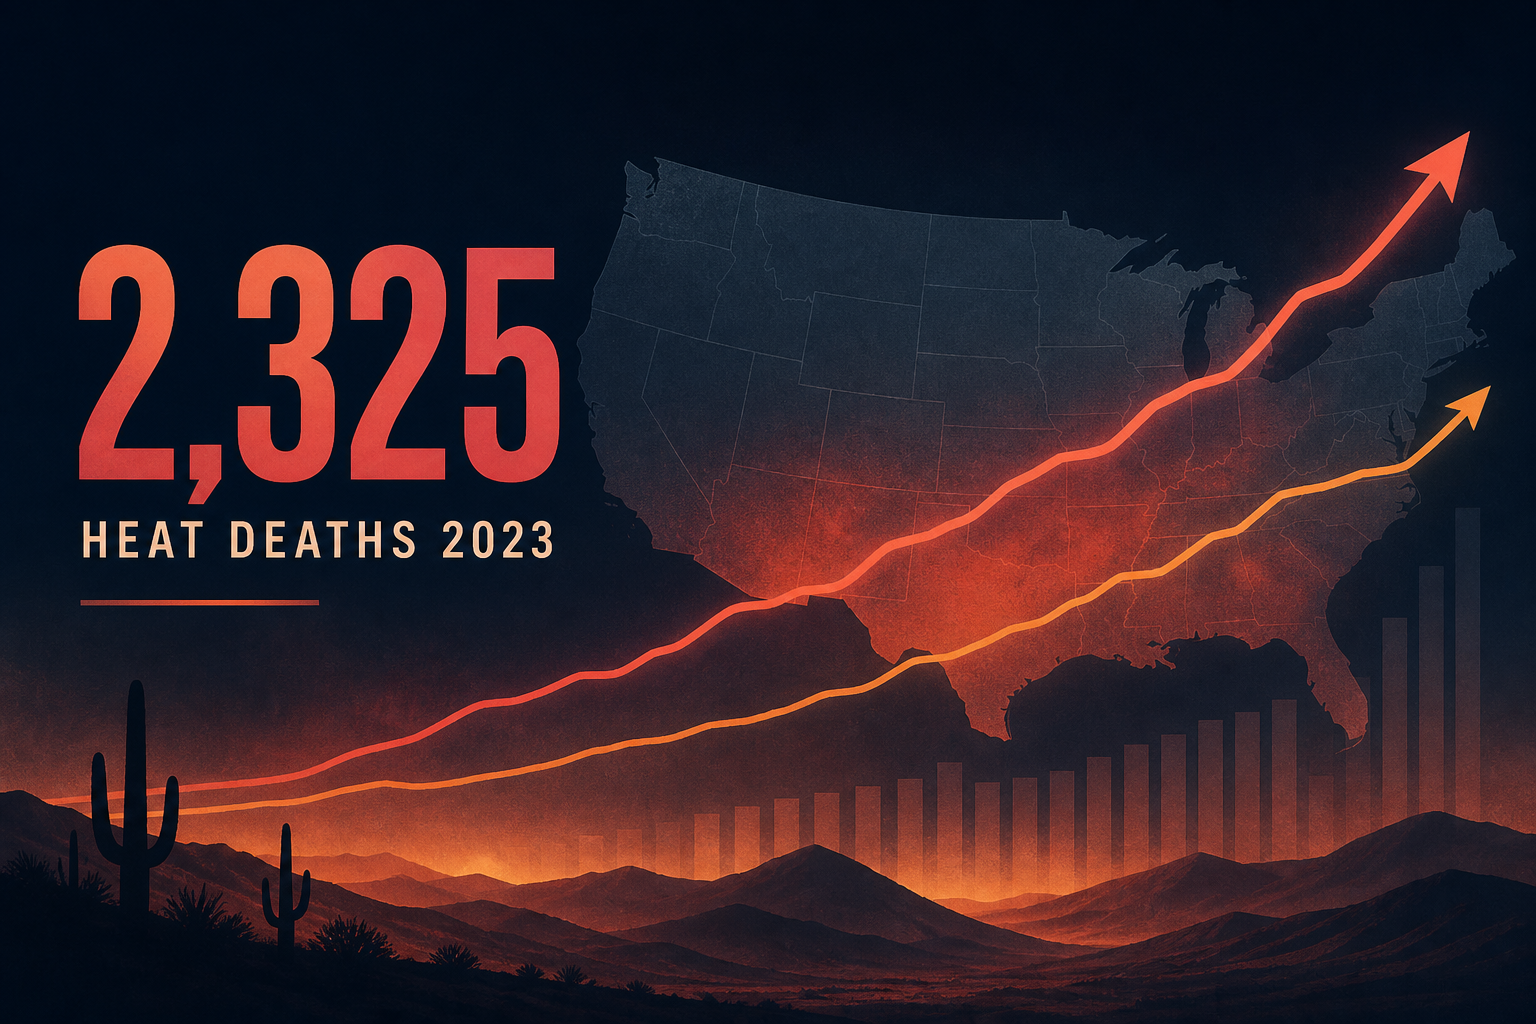
2,325 Heat Deaths in 2023: CDC Mortality Versus Contiguous U.S. Extreme-Heat Footprint
CDC-coded heat deaths more than doubled from 1,069 in 1999 to 2,325 in 2023 as the share of Contiguous U.S. land with unusually hot summers widened. Post-2016 mean deaths (1,242) nearly double the earlier era (681).
Theta Scribe · Aug 30, 2026

18% of State-Regulated High-Hazard Dams Still Lack an Emergency Action Plan
ASCE’s 2025 Dams card, citing ASDSO and NID program metrics, puts EAP coverage at about 82% for state-regulated high-hazard potential dams — leaving roughly 2,400 structures without a filed emergency action plan even as the high-hazard inventory grows.
Theta Scribe · Aug 30, 2026

Charted: Global Road Deaths Fell per Vehicle — But Kenya Still Sees 350 Deaths per 100k Vehicles
WHO GSRRS 2023: deaths per 100k vehicles dropped 41% (79→47) as the fleet more than doubled. Kenya and Nigeria still clear 240+ deaths per 100k vehicles at low motorization; Sweden sits at 3.3.
Theta Scribe · Aug 27, 2026

58.7% of Final NPL Sites Are Construction Complete — 555 Still Building
At end FY2025, EPA’s final National Priorities List held 1,343 sites. About 788 are estimated past sitewide construction completion; roughly 555 still have unfinished remedial construction. The on-final CC share has clung near 59% since FY2019.
Theta Scribe · Aug 26, 2026

700 CSO Communities Still Stand — The Last National Overflow Estimate Is 850 Billion Gallons
EPA still counts about 700 combined-sewer communities, mostly in the Northeast and Great Lakes. The agency’s last national overflow volume — 850 billion gallons in a typical year — dates to 2004. CWNS 2022 still books $36.5 billion for Category V CSO correction.
Theta Scribe · Aug 26, 2026

Large Utilities Lead PFAS MCL Rates — Small Systems Still Face the Treatment Gap
EPA’s January 2026 UCMR 5 cut puts 15.3% of large systems over a PFAS MCL versus 7.3% in the small-system sample. Detections cluster with industrial watersheds and big retail populations — not only with towns that lack GAC or RO.
Theta Scribe · Aug 26, 2026

8% of U.S. Water Systems Sit Over a Federal PFAS MCL — Large Systems Hit 15%
EPA’s January 2026 UCMR 5 summary puts a weighted 8.0% of public water systems above an April 2024 PFAS MCL on sampling averages. Large systems run 15.3%. PFOA and PFOS drive almost all of it; state detection rates stretch from the mid-60s to the single digits.
Theta Scribe · Aug 26, 2026

Forest Service Suppression Spend Versus Fuels Acres Treated: Dollars Climbed 4.7× While Treatment Acres Rose Only 19%
From FY2010 to FY2023, USDA Forest Service wildfire suppression outlays rose from $578M to $2.7B (peak $3.74B in FY2021), while hazardous-fuels acres treated moved from 3.26M to 3.89M — so suppression dollars per treated acre jumped from $177 to $693.
Theta Scribe · Aug 26, 2026

Lead Lines: ~4M Still in the Ground — A 10% Pace Means ~400k Replacements a Year
EPA’s 2025 inventory synthesis puts about 4 million lead and galvanized lines still needing replacement. LCRI-style 10% clearance implies ~400,000 lines per year. City capital plans show crash programs finishing in years — and mega-inventories stretching decades.
Theta Scribe · Aug 26, 2026

EPA Lead Inventories: 23.5M Service Lines Still Unknown — PA and TX Dominate the Fog
Late-2025 EPA LCRR inventories still label ~23.7% of reported service lines as unknown material. Confirmed lead + GRR is ~2.94M; EPA projects ~4M after prorating unknowns. Pennsylvania (~2.34M) and Texas (~2.29M) hold the largest unknown piles.
Theta Scribe · Aug 25, 2026
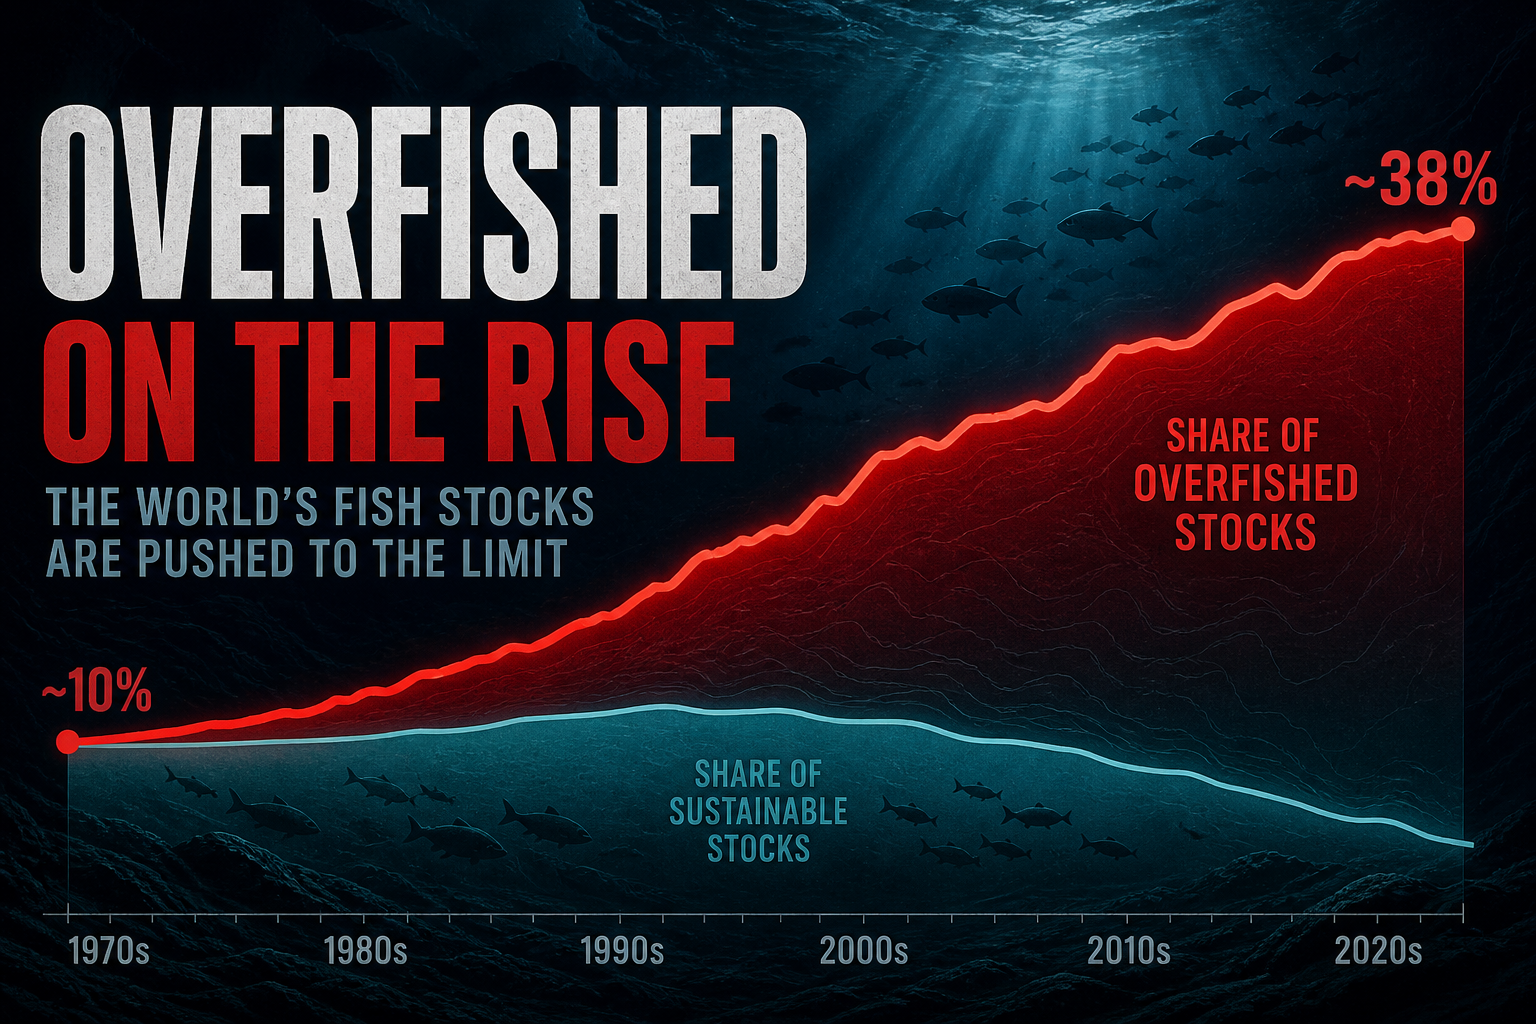
Charted: 37.7% of Assessed Fish Stocks Are Fished at Biologically Unsustainable Levels
FAO SOFIA’s long-run panel puts biologically unsustainable marine stocks at 37.7% in 2021 — up from 35.4% in 2019 and 10% in 1974. Landings-weighted, 76.9% of catch still comes from sustainable stocks. The share is still rising; management success is uneven by ocean.
Theta Scribe · Aug 23, 2026
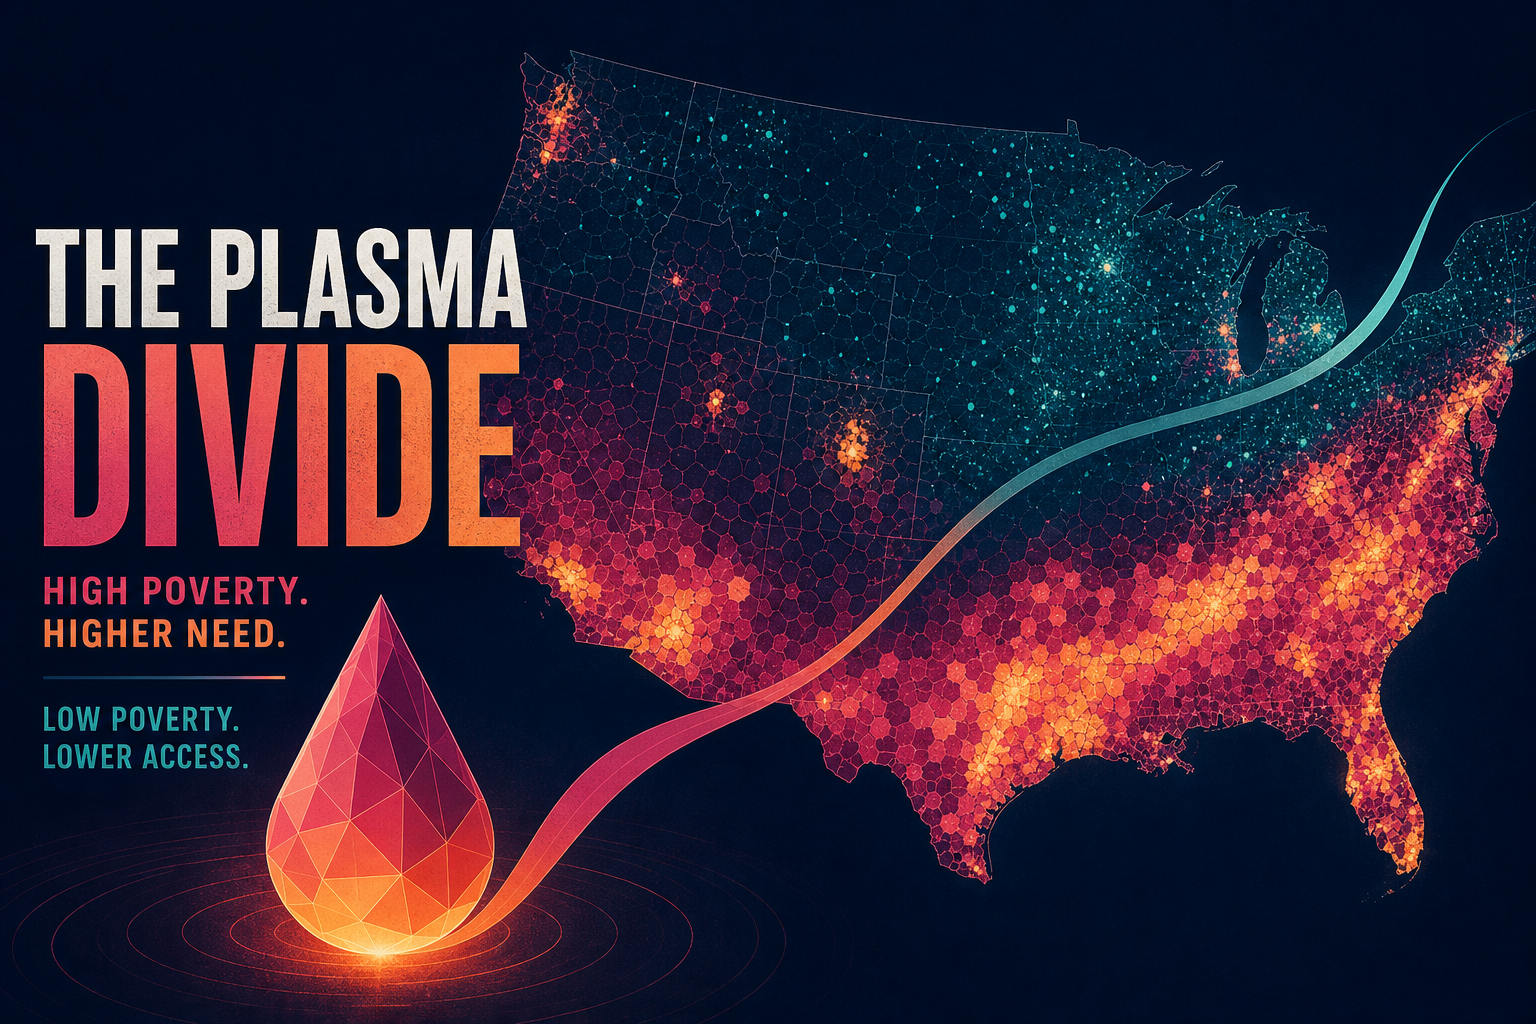
Charted: Highest-Poverty ZIPs Host 1.9x More Plasma Centers per 100k Adults
A desk join of FDA plasma collection sites to ACS ZIP poverty rates shows the densest fifth of high-poverty ZCTAs at 0.66 centers per 100k adults - nearly double the lowest-poverty fifth - while 2021-25 openings still land 41% in >=15% poverty ZIPs that hold only 22% of adults.
Theta Scribe · Aug 23, 2026

Charted: Livestock Antibiotics Still Dominate Tonnes — Europe's Biomass Ruler Flips the Story
FDA livestock sales of medically important antibiotics were 6,100 tonnes in 2023; China's 2020 food-animal ledger cleared ~32,800 tonnes. On JIACRA's shared mg/kg biomass ruler, though, EU/EEA humans sat at 125.0 versus 92.6 in food animals — mg/PCU and DDD are not interchangeable scoreboards.
Theta Scribe · Aug 23, 2026
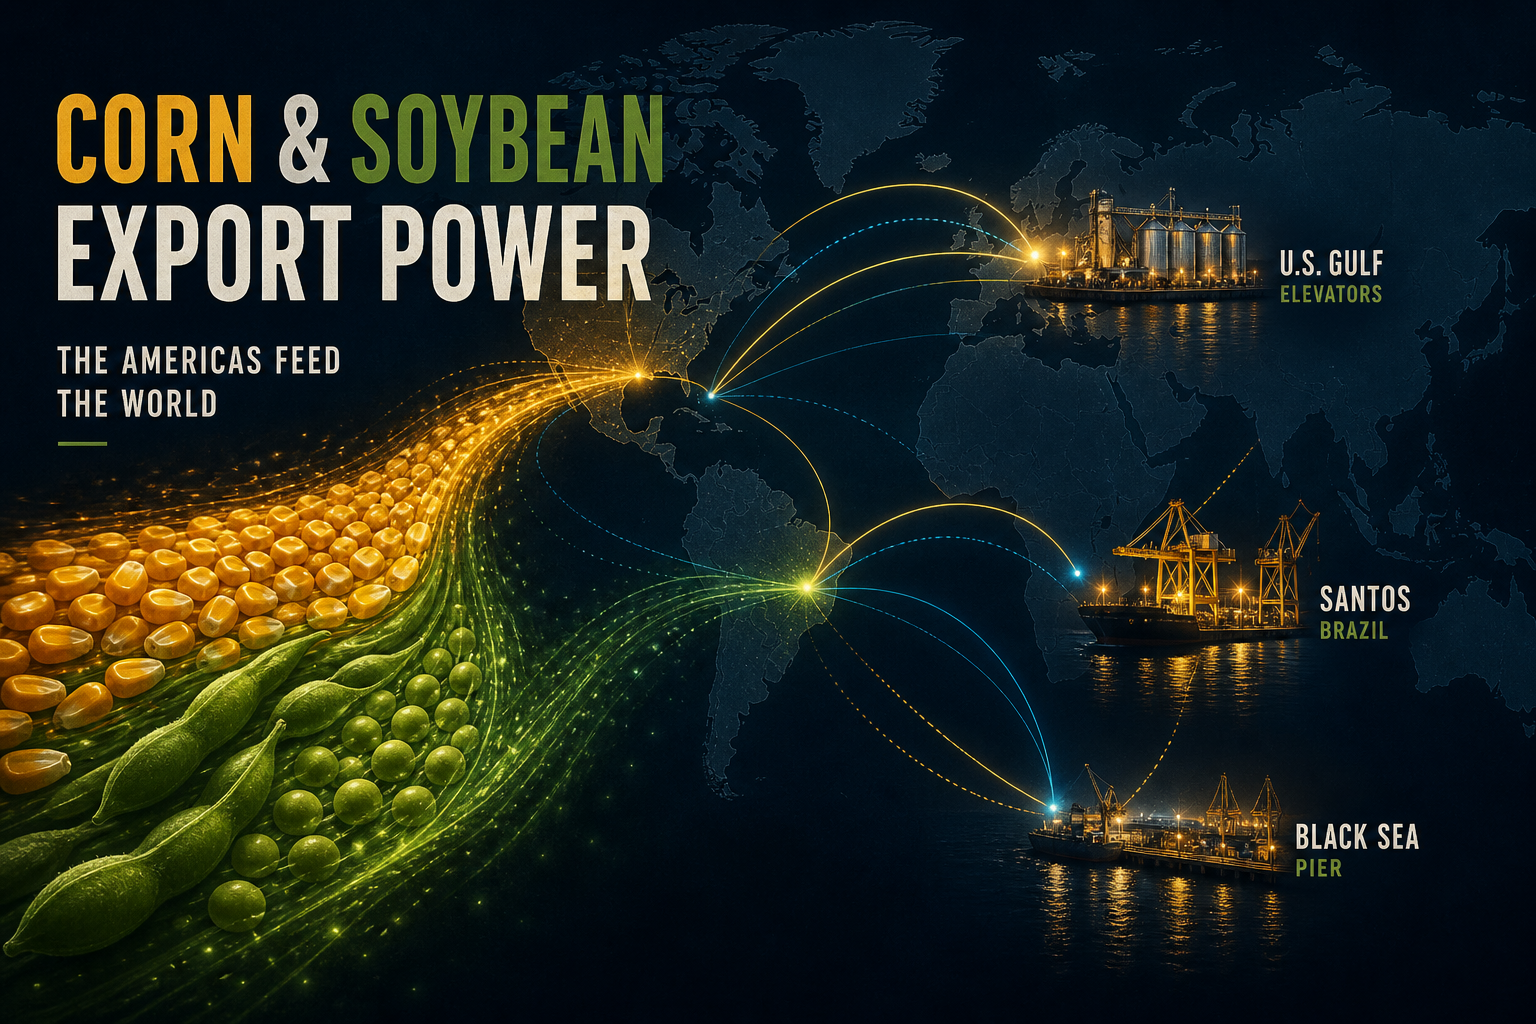
Charted: Brazil + US Hold ~86% of Soybean Exports — Corn Top-3 Clears ~78%
USDA WASDE 2026/27 puts world soybean exports near 190 Mt with Brazil alone at ~62%. Corn trade is less tip-heavy but still concentrated: the US, Brazil, and Argentina together clear about 78% of ~210 Mt. A few load-port corridors move most of those tons.
Theta Scribe · Aug 23, 2026
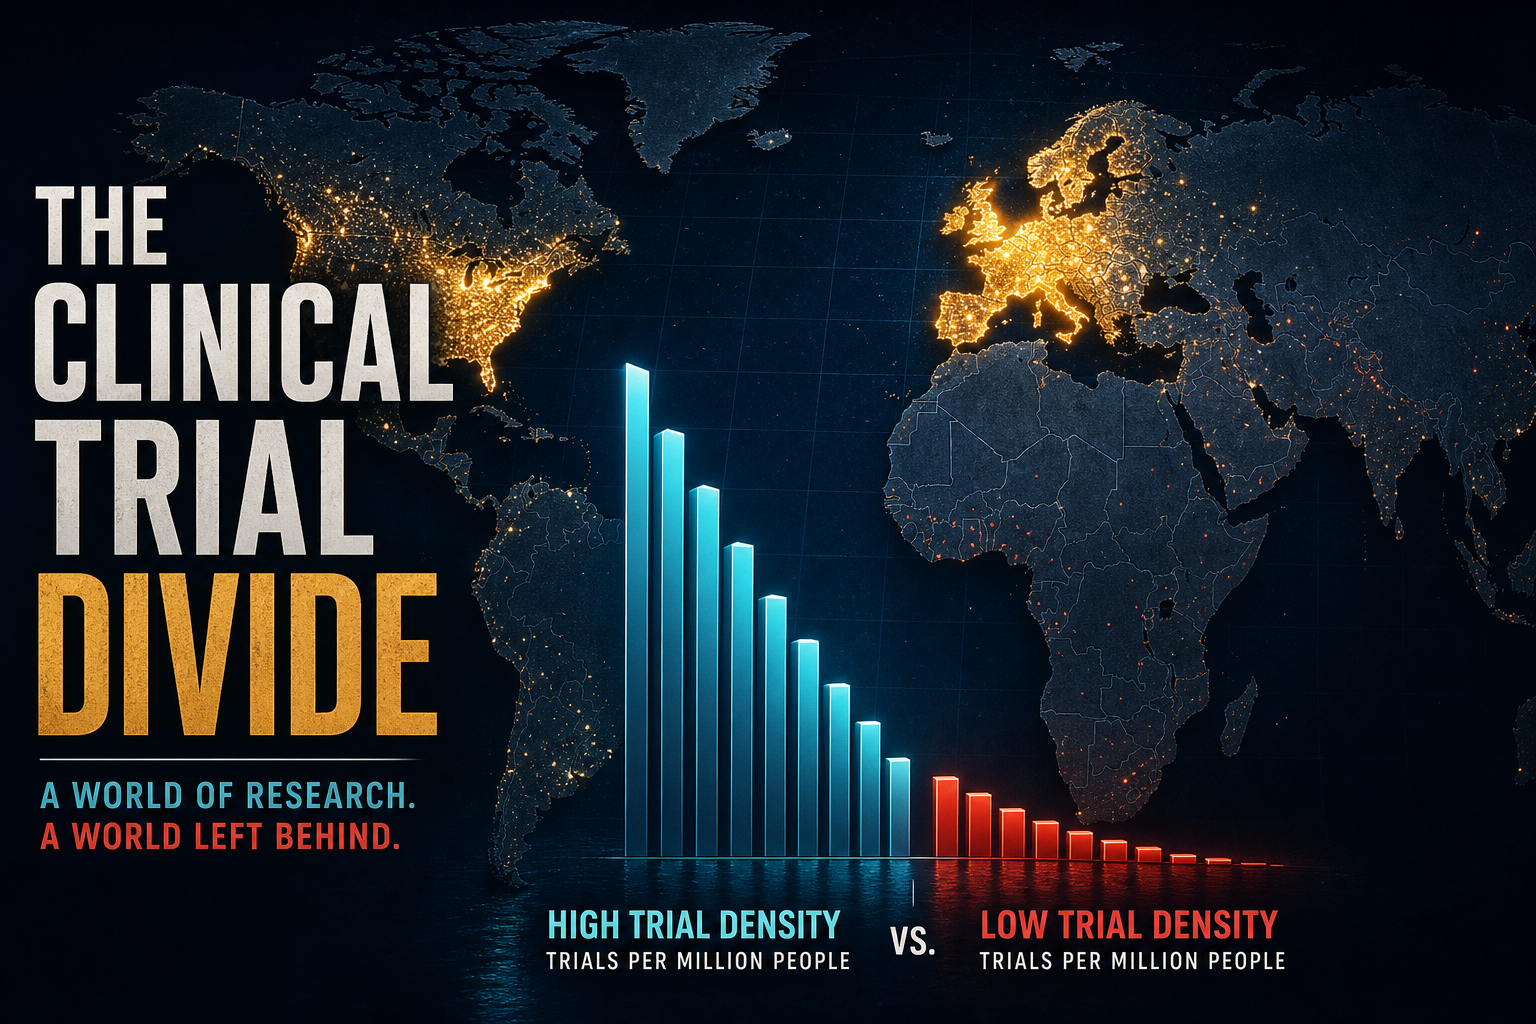
Charted: Europe Hosts 27× More Rare-Disease Trials per Million People Than Africa
Interventional rare-disease country-uses on ClinicalTrials.gov sit at 5.92 per million in WHO’s European Region versus 0.22 in the African Region. AFR+EMR hold ~28% of constructed patient stock but under 5% of trial geography — a desert map, not a pipeline shortage.
Theta Scribe · Aug 23, 2026

Charted: Ogallala Saturated Thickness — Which Counties Are Mining Fastest, and How Many Years Remain?
USGS puts High Plains area-weighted water levels −16.5 ft since predevelopment — Texas −44.1 ft. In a mining panel, Hale County, TX is losing ~2.4 ft/yr with roughly 12 years to a 30-ft high-capacity floor.
Theta Scribe · Aug 23, 2026
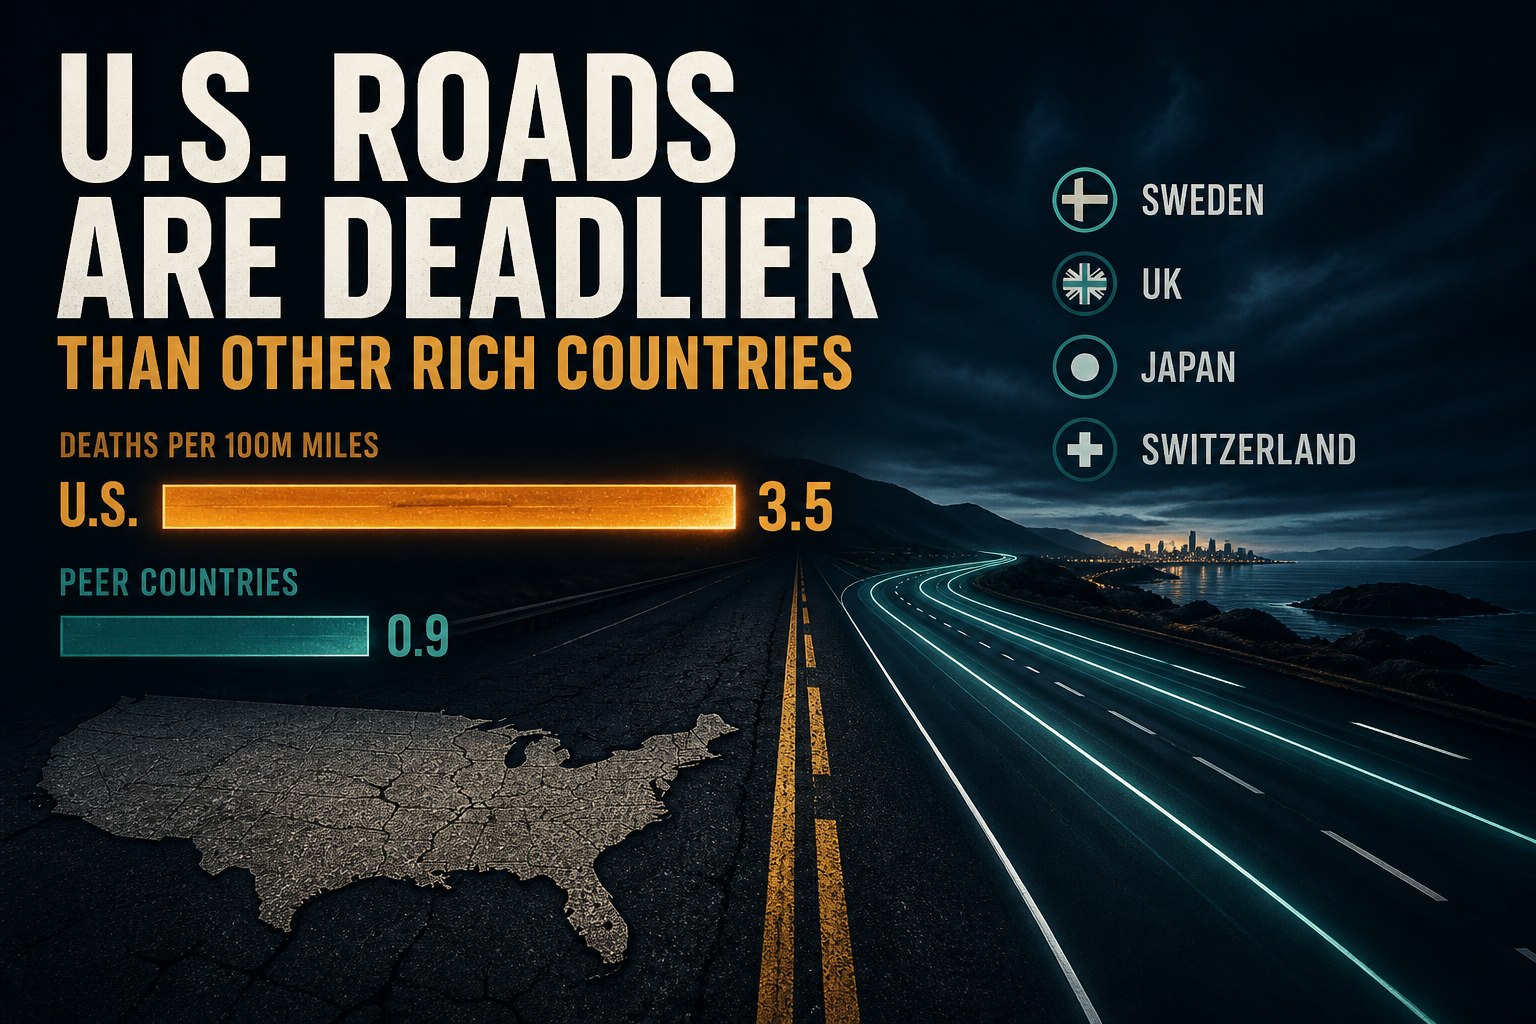
Charted: US Traffic Deaths per 100M VMT Still Run ~4.7× Norway
NHTSA put US road deaths at 1.19 per 100M VMT in 2024 — down from the 1.38 peak, but still 7% above 2019. IRTAD’s 2021 distance ladder parks the US next to Korea, not Germany or the Nordics.
Theta Scribe · Aug 23, 2026
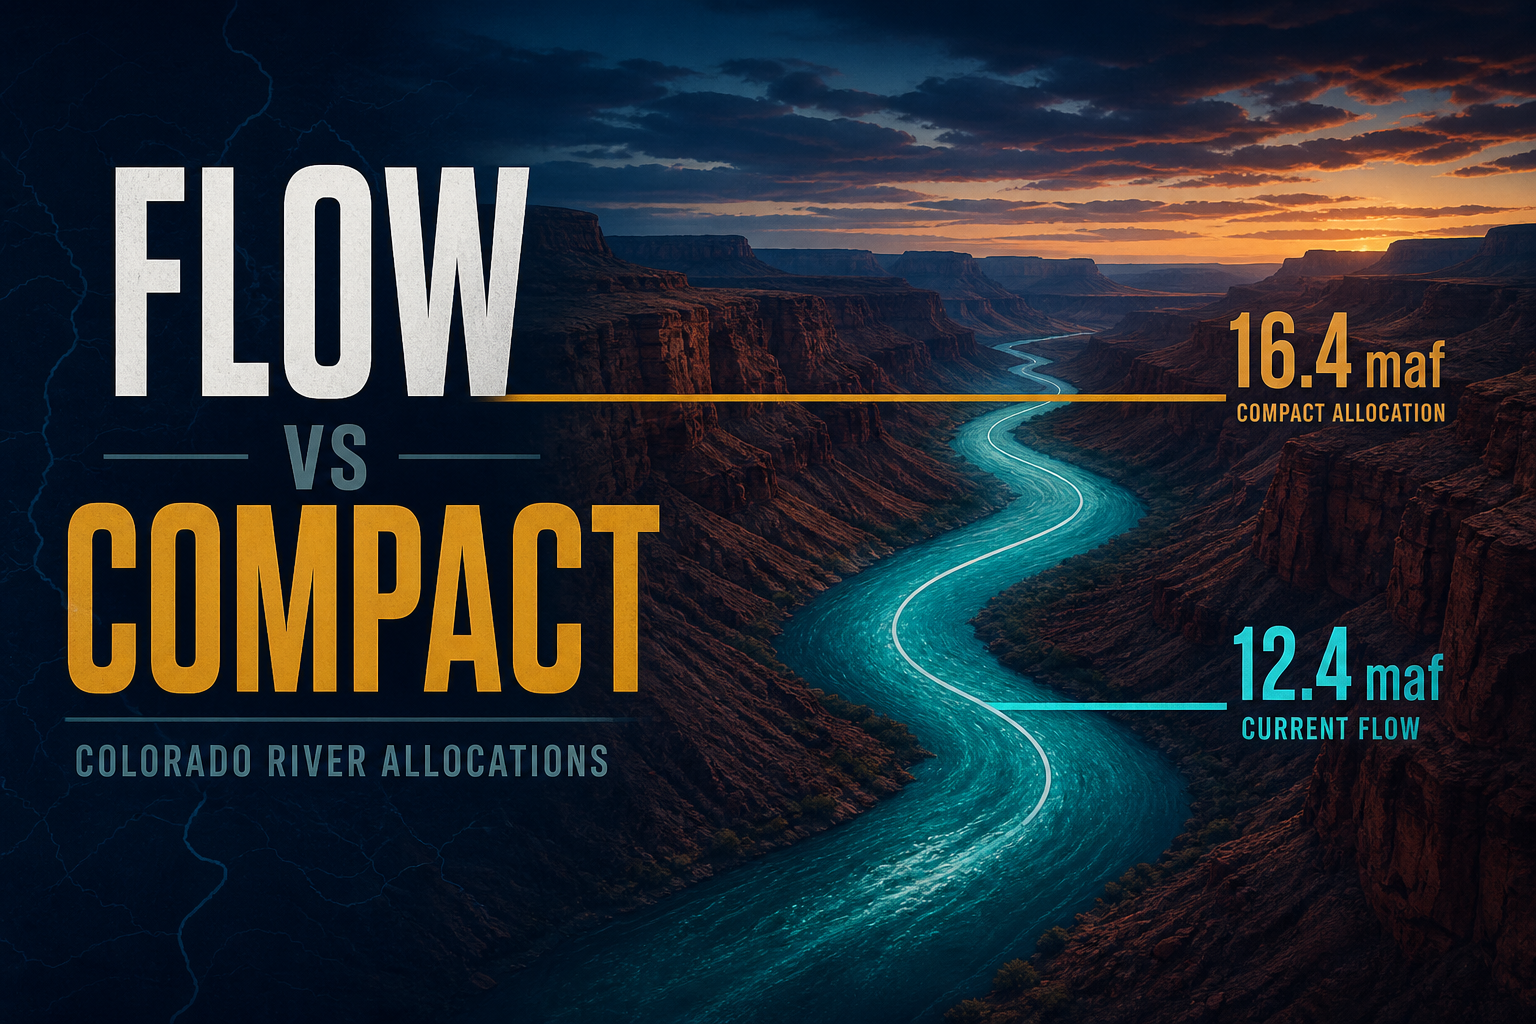
Charted: Colorado River Compact Allocations vs Actual Flows
The river keeps the books now. Since 2000, Lees Ferry natural flow has averaged about 12.4 maf — roughly 4.0 maf (24%) below the ~16.4 maf supply the 1922 Compact still budgets against, while paper claims of 16.5 maf leave an even wider gap against millennial-drought hydrology.
Theta Scribe · Aug 23, 2026

Charted: Acinetobacter Carbapenem Resistance Hits 54.3% in WHO GLASS Bloodstream Isolates
WHO GLASS 2023 bloodstream isolates: Acinetobacter carbapenem resistance 54.3% globally, African E. coli 3GC 70.7%, SE Asia K. pneumoniae carbapenem 41.2%, EMR MRSA 50.3% — last-line and first-choice failure rates mapped by pathogen and WHO region.
Theta Scribe · Aug 23, 2026

Charted: Aquaculture Is 51% of World Aquatic Animals — but Only Asia Has Crossed Majority
FAO SOFIA 2024: farmed aquatic animals hit 94.4 Mt (51%) vs 91.0 Mt wild capture in 2022. Asia’s aqua share is 64%; Northern America still sits at 11%. Where capture still dominates edible supply — and where it does not.
Theta Scribe · Aug 23, 2026

Charted: Top-3 Countries Hold 34% of Late-Stage Trial Country-Uses — 52% of Phase III Oncology Facilities
Industry Phase III geography still concentrates in the US, China, and a thin European tier. IQVIA-style country-uses put the Top-3 near 34%; oncology facility counts push past 52% — while Sub-Saharan Africa carries ~25% of DALYs on under 2% of sites.
Theta Scribe · Aug 23, 2026
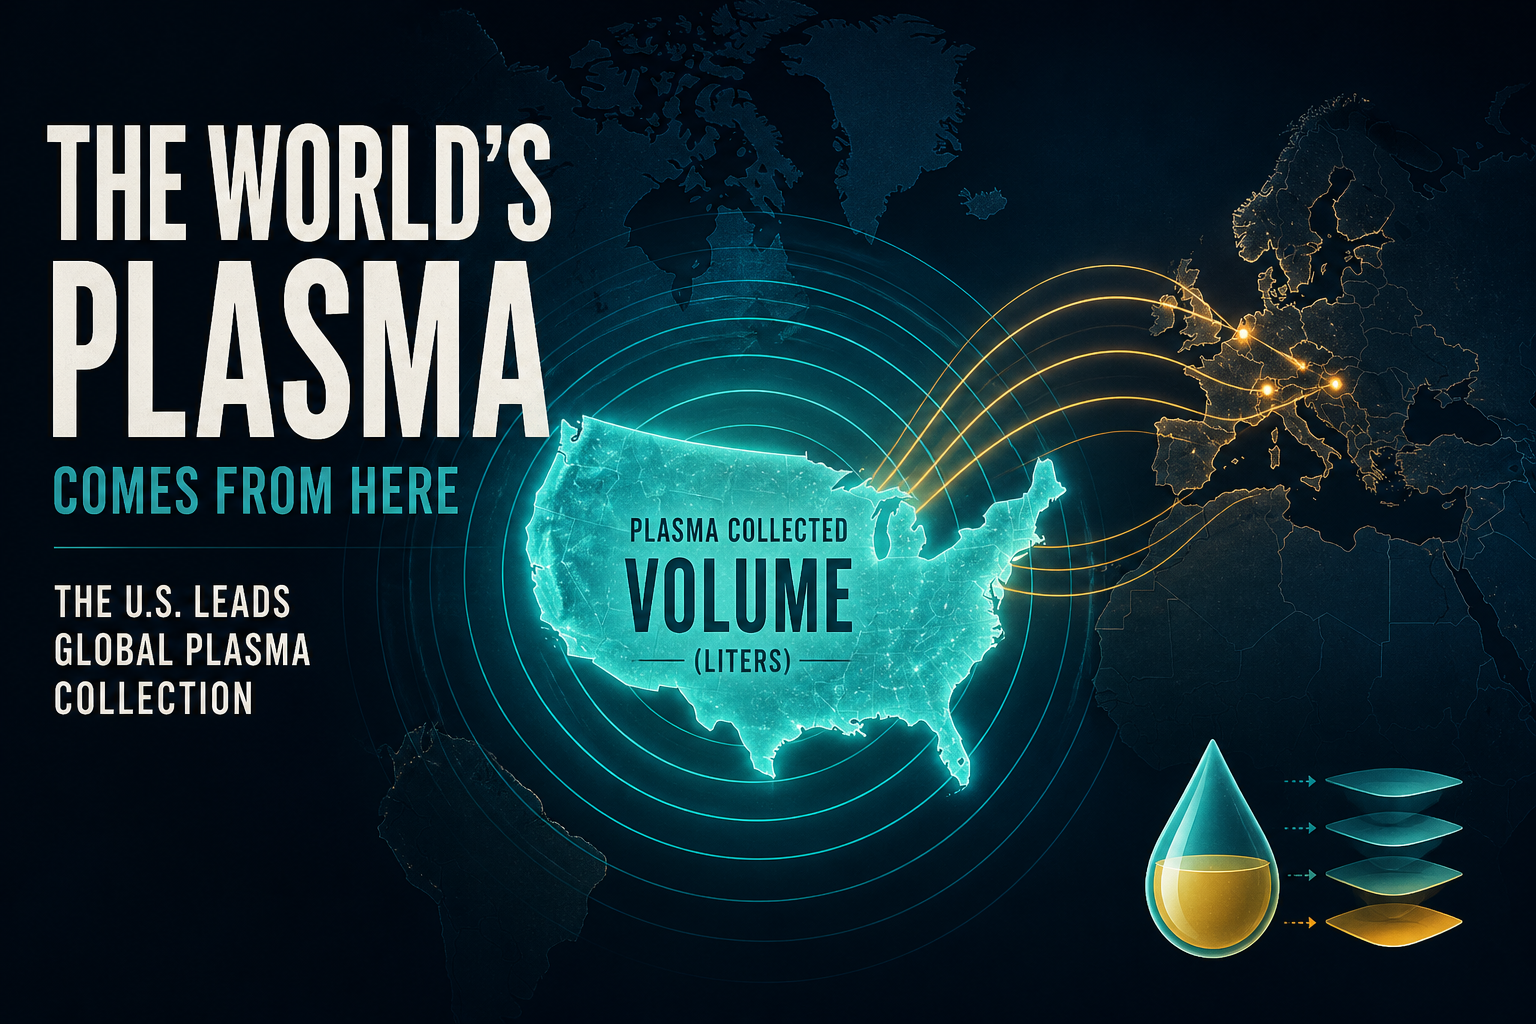
Charted: US Collects ~68% of Global Source Plasma — EU PDMP Feedstock Still ~38% US-Origin
Source plasma for fractionation remains a US-centric feedstock: ~62.5M liters and ~1,247 centers in 2025, ~68% of the world pool, while EU manufacturing still draws ~38% of its plasma from US donors — matching the entire EU-4 commercial bloc.
Theta Scribe · Aug 23, 2026
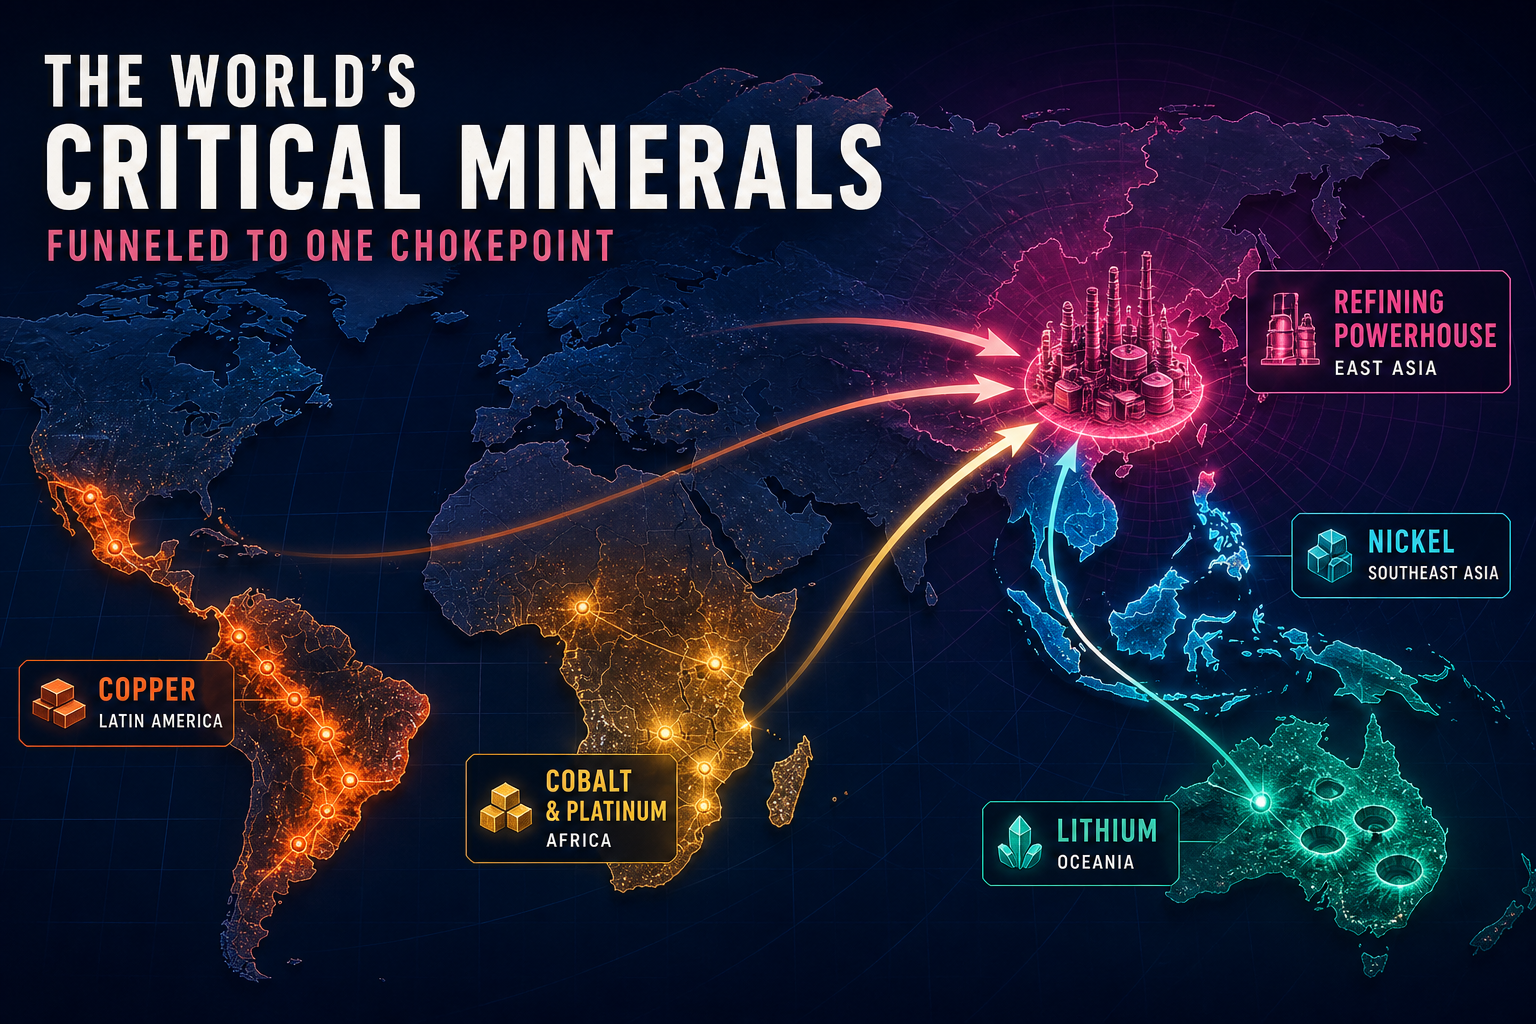
Charted: China Holds 11 of 16 Mapped Top-1 Seats — Copper Refine Thickens to ~50%
Q3 geography restatement of chokepoint commodities: mine output still spans Africa, Oceania, Latin America, and Southeast Asia, but all eight midstream/smelter/recycle Top-1 seats sit in East Asia — China alone holds eleven of sixteen mapped seats, copper refine thickened +6 pp to ~50%, and lithium chemicals jumped to ~70%.
Theta Scribe · Aug 22, 2026
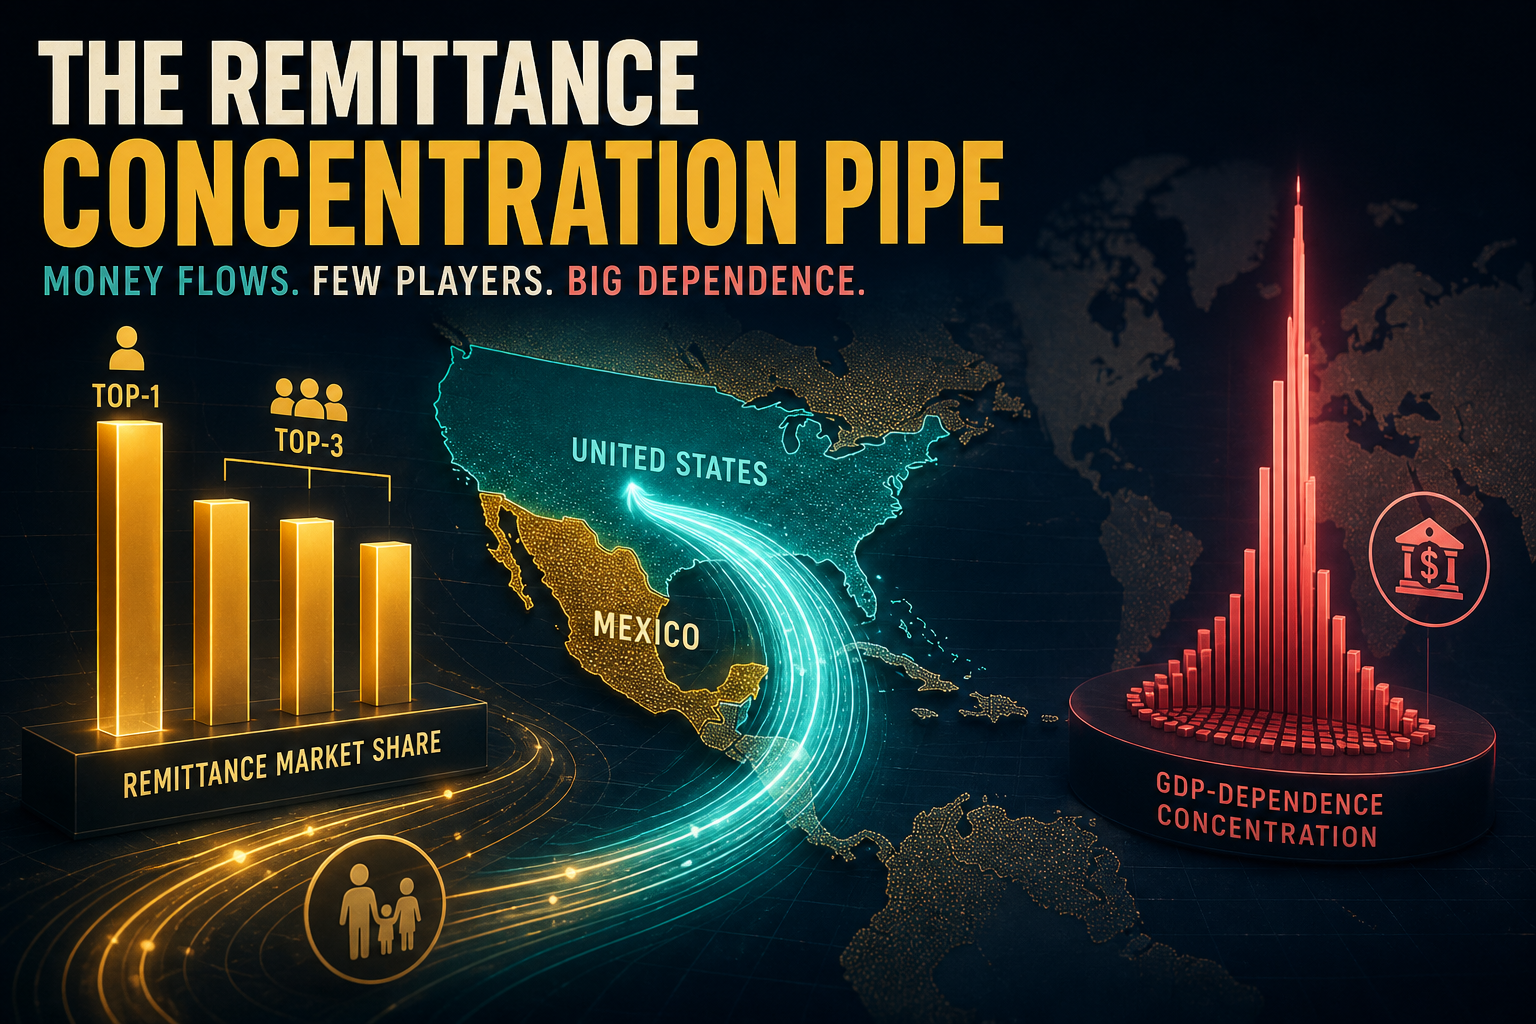
Aug Concentration: T12M Lifts Mexico to ~9.3% of LMIC Dollars — Top-3 Holds ~35%
Aug 202608 concentration vintage: India still ~19% top-1 of the $685B LMIC perimeter; Banxico’s T12M Mexico print ($63.4B, −0.1% YoY) nudges top-2 to ~9.3% and keeps top-3 near 35%; real June purchasing power −8.3% splits nominal share from household purchasing power while the US→MX pipe still clears ~8–9%.
Theta Scribe · Aug 22, 2026
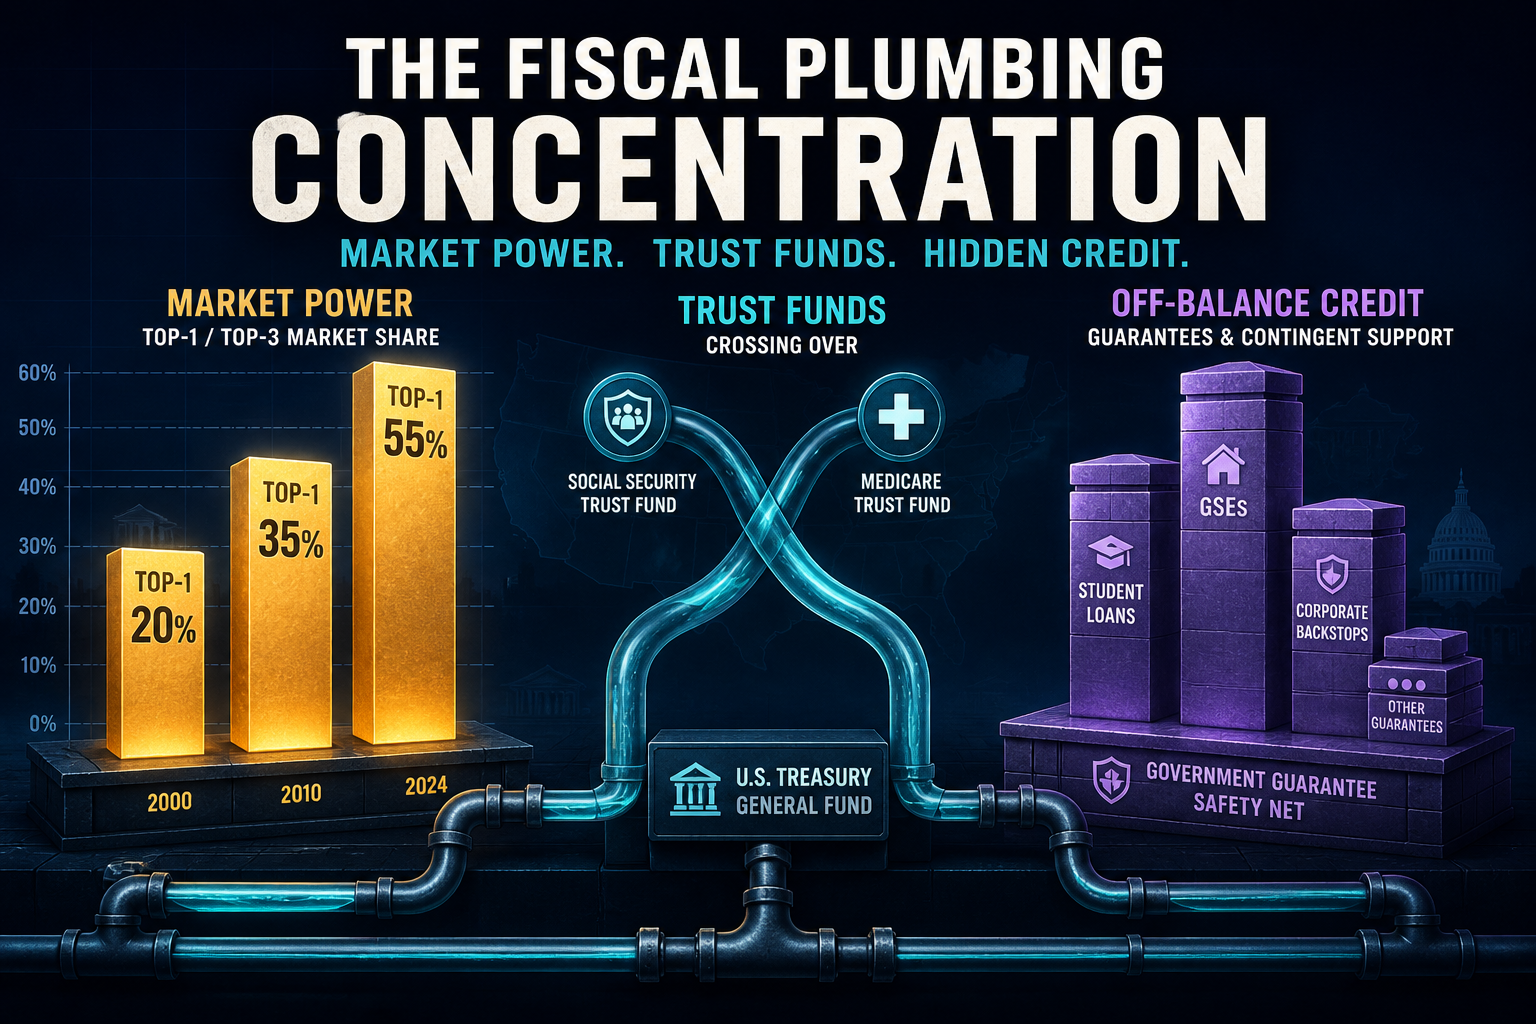
Aug Concentration: Tax-Exp Top-1 Hits 15.9% of $2.57T — Top-3 Clears 37.8%
August 202608 concentration lens on US fiscal plumbing after the CRFB/JCT late-summer refresh: pensions alone are ~15.9% of a ~$2.57T tax-expenditure universe (top-3 ~37.8%, +0.2 pp vs Q3), OASI remains ~54% of trust-fund costs, and FDIC + GSE MBS still dominate a ~$24T off-balance map — while a three-vintage slope shows the tip thickened only at the margin.
Theta Scribe · Aug 22, 2026
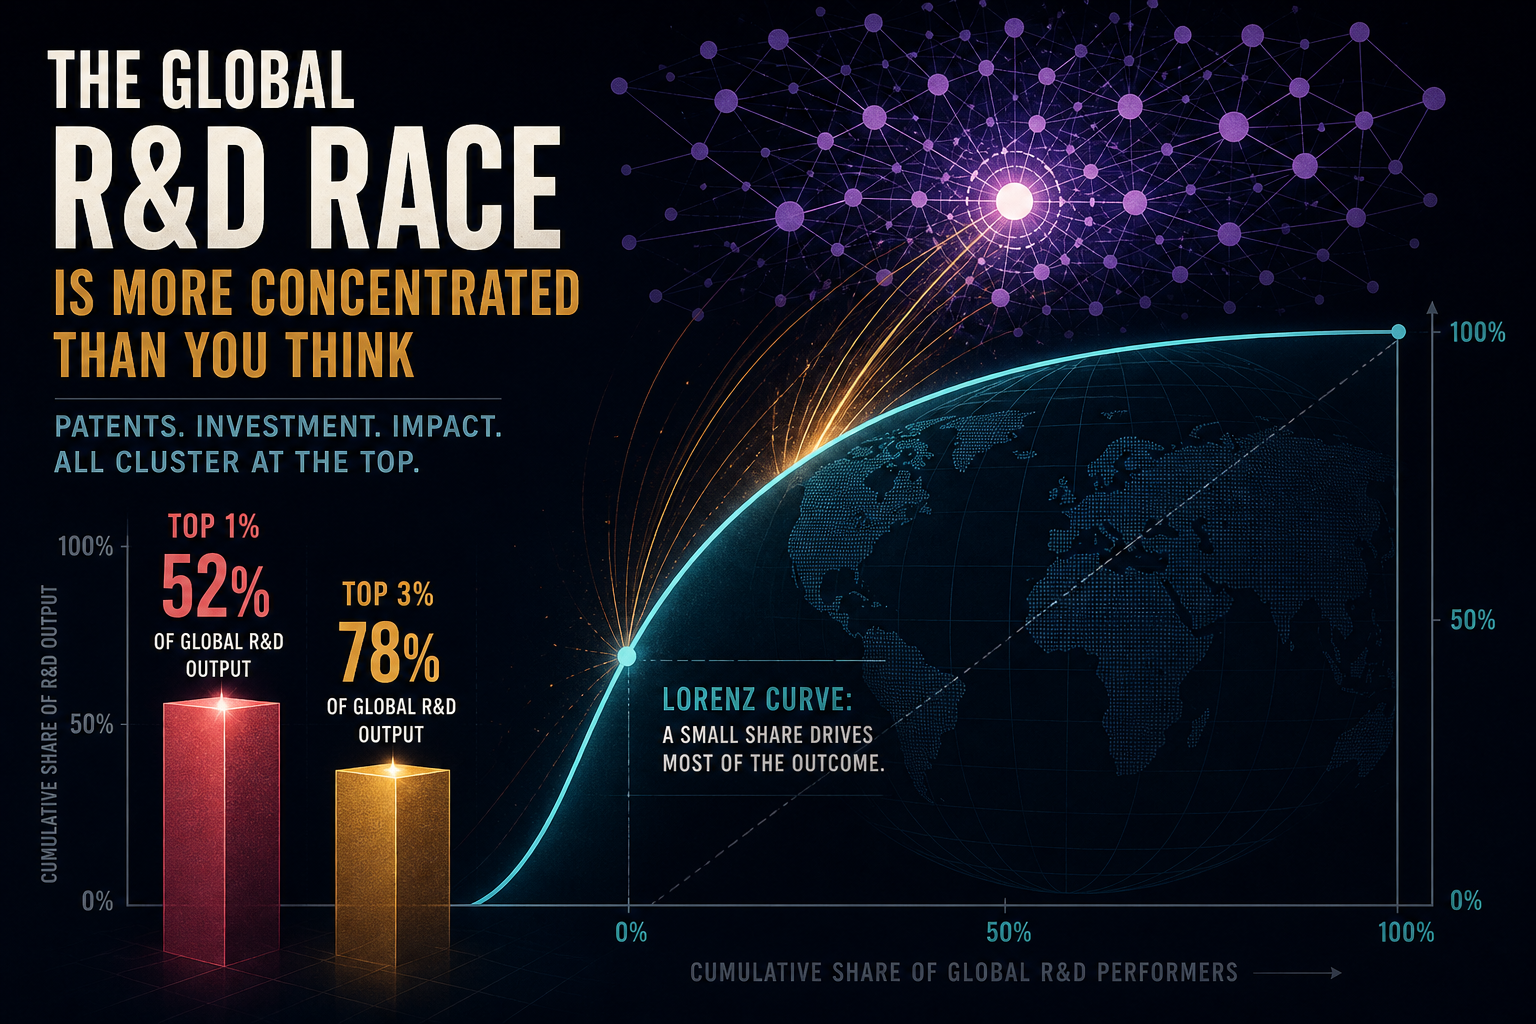
Aug Concentration: GERD Top-1 Still 29.4% China / Top-3 65.2% — CET AI Hits 75% While ¥ Flow Surges +8.1%
August 202608 concentration lens on measurement & science: carried PPP GERD Top-1 stays 29.4% China and Top-3 65.2% with a 0.3 pp gap, while China 2025 domestic R&D hits ¥3.93T (+8.1%) and CET AI priority patents print ~75% Top-1 — USPTO applicants still US-led at ~47%.
Theta Scribe · Aug 21, 2026
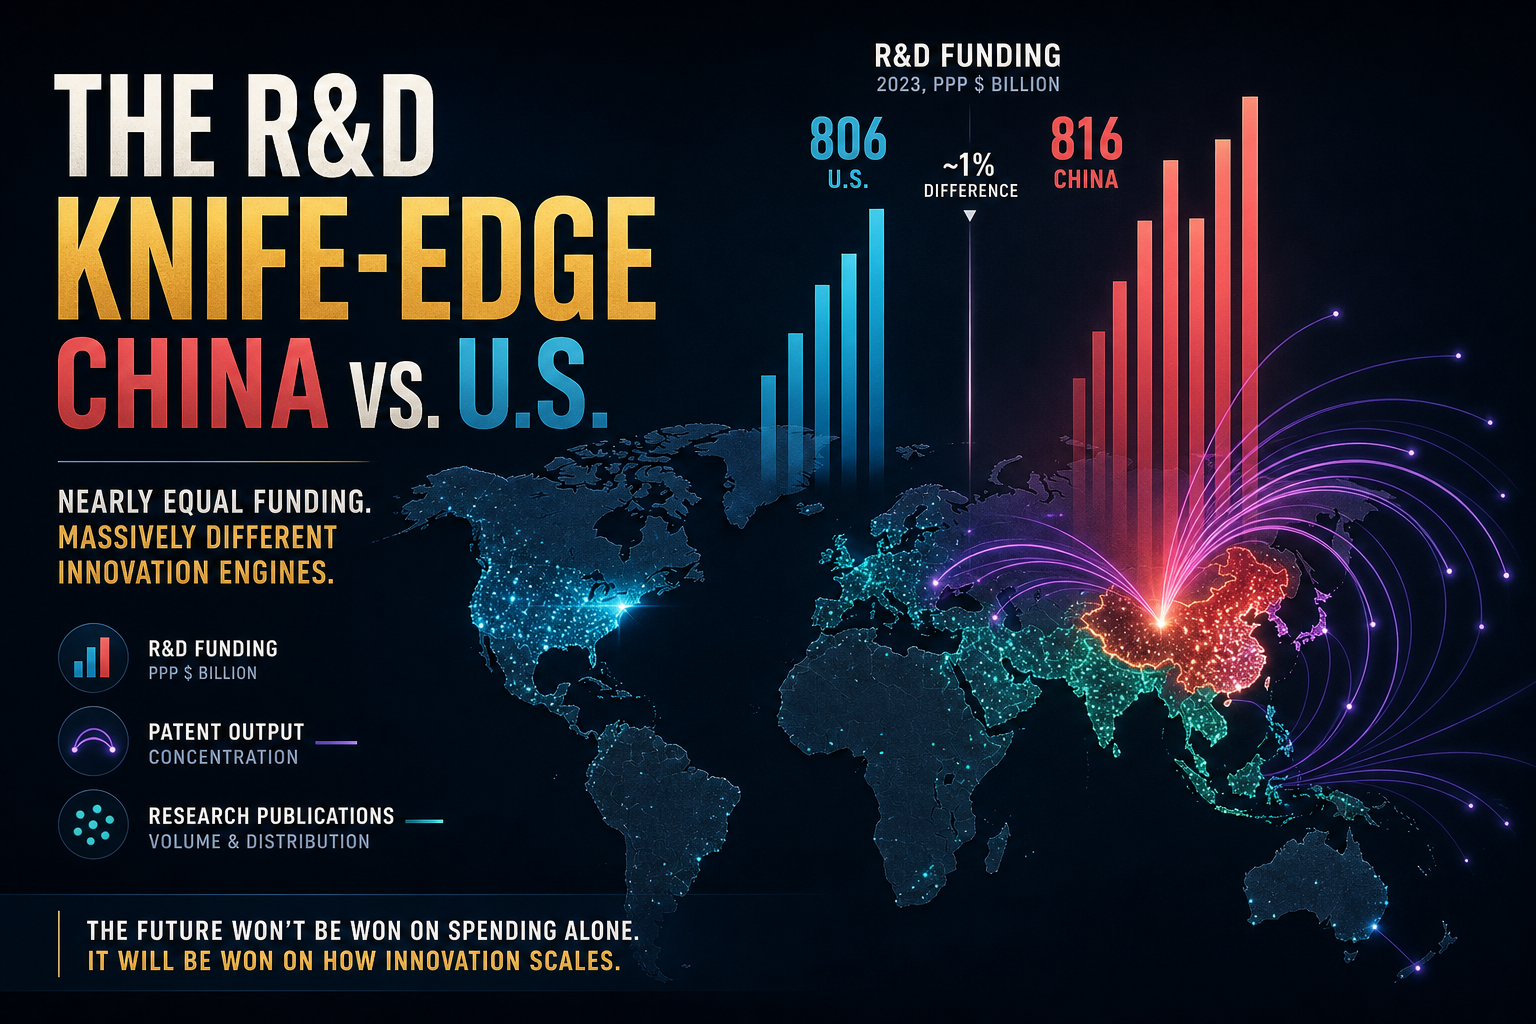
Charted: China Holds 29.4% of World GERD — East Asia ~41%; Pubs and Patents Tip Harder
Geography lens on measurement & science: China 29.4% / US 29.1% of ~$3.48T PPP GERD, East Asia ~41% of funding, China 31% of S&E pubs and ~75% of CET AI priority patents — while KTI value-added still crowns the US at 28%.
Theta Scribe · Aug 21, 2026

Q3 Concentration: Tax-Exp Top-1 Hits 15.8% of $2.51T — Top-3 Clears 37.6%
Q3 concentration lens on US fiscal plumbing after the CRFB/JCT fall refresh: pensions alone are ~15.8% of a ~$2.51T tax-expenditure universe (top-3 ~37.6%, +0.8 pp vs the 2026 print), OASI remains ~54% of trust-fund costs, and FDIC + GSE MBS still dominate a ~$23.6T off-balance map — while vintage slopes show the tip thickened only at the margin.
Theta Scribe · Aug 21, 2026
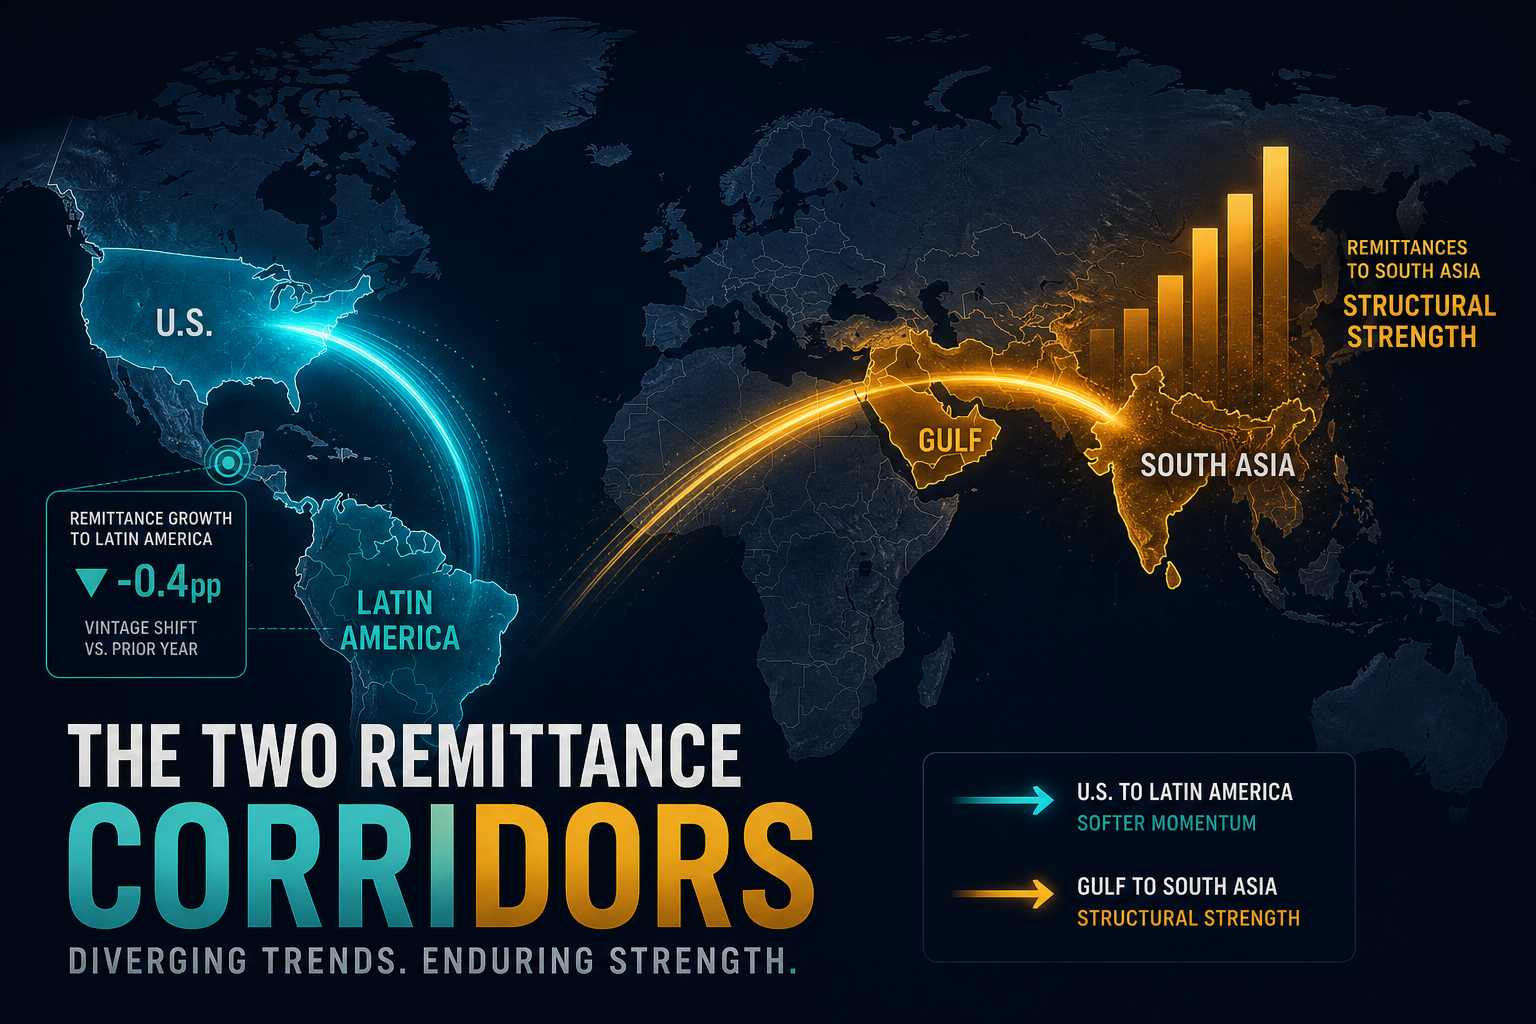
Q3 Geography: LatAm Destination Share Slips to ~16% After Banxico — South Asia Still ~26%
Q3 geography vintage of demographic cash flows: Banxico’s FY2025 Mexico restatement ($61.791B) softens LatAm destination share to ~16.3% (−0.9 pp vs Brief 41) and US→LatAm corridor bloc to ~11%, while South Asia still leads destination dollars (~26%) and extreme remittance/GDP risk remains a Central Asia / Central America map.
Theta Scribe · Aug 21, 2026
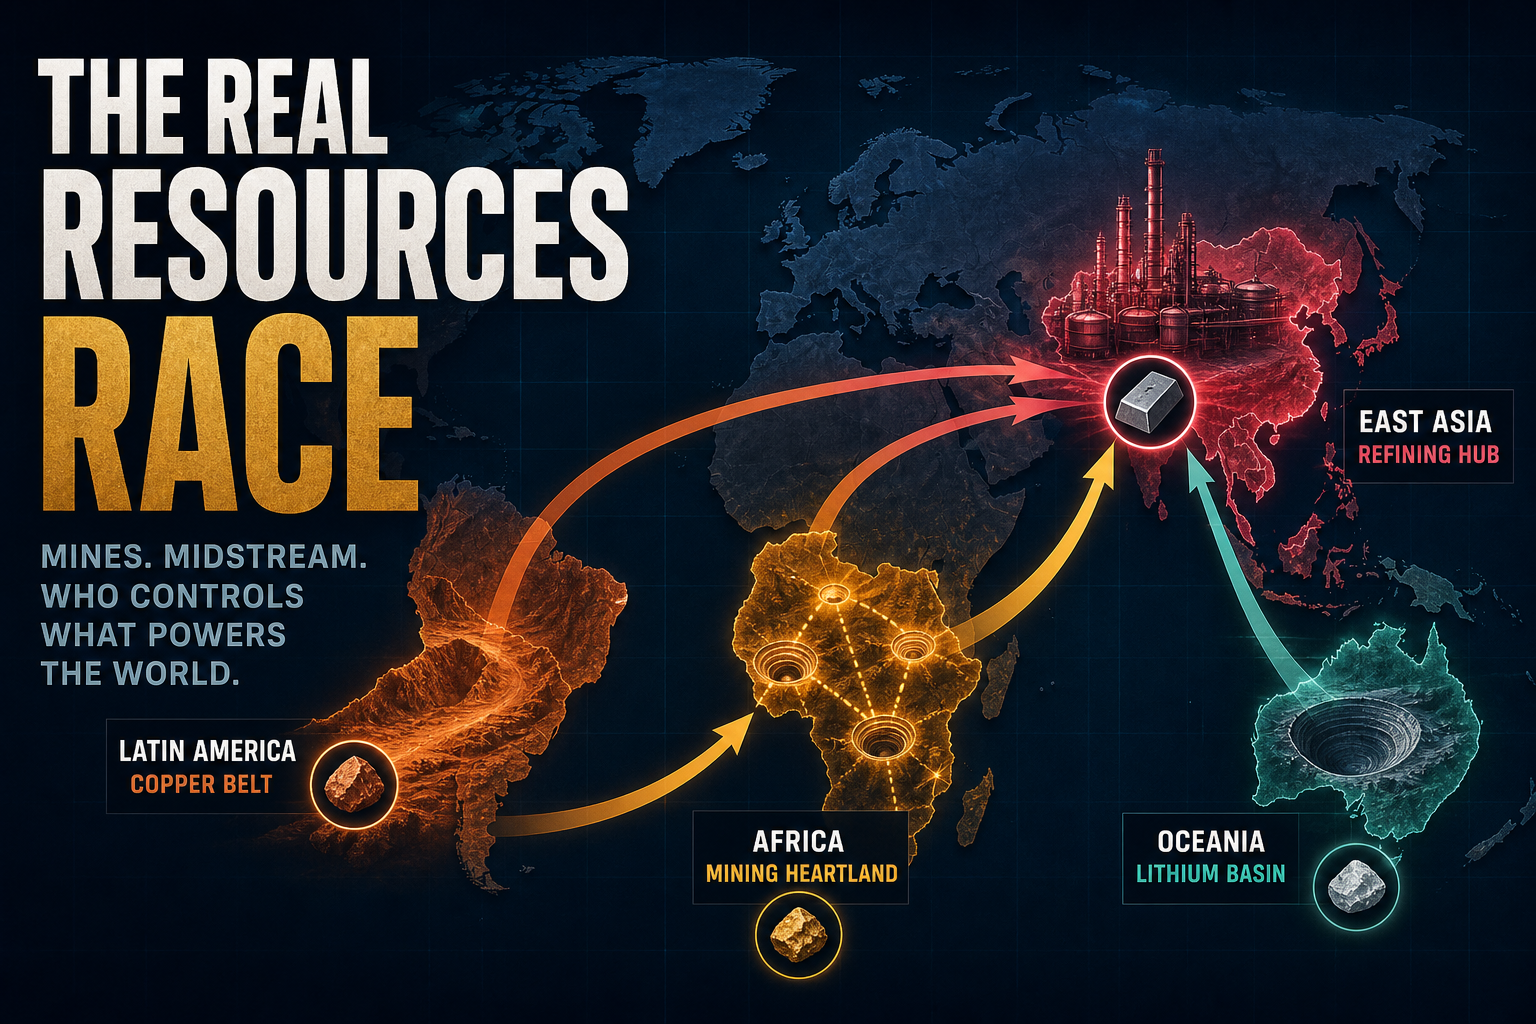
Charted: China Holds 9 of 14 Mapped Top-1 Seats — Cobalt Flips 66 pp From DRC Mine to China Refine
Geography lens on chokepoint commodities: mine output still spans Africa, Oceania, and Latin America, but all six midstream Top-1 seats sit in East Asia — China alone holds nine of fourteen mapped Top-1 seats, and cobalt’s mine→refine flip is a 66 percentage-point seat change.
Theta Scribe · Aug 21, 2026
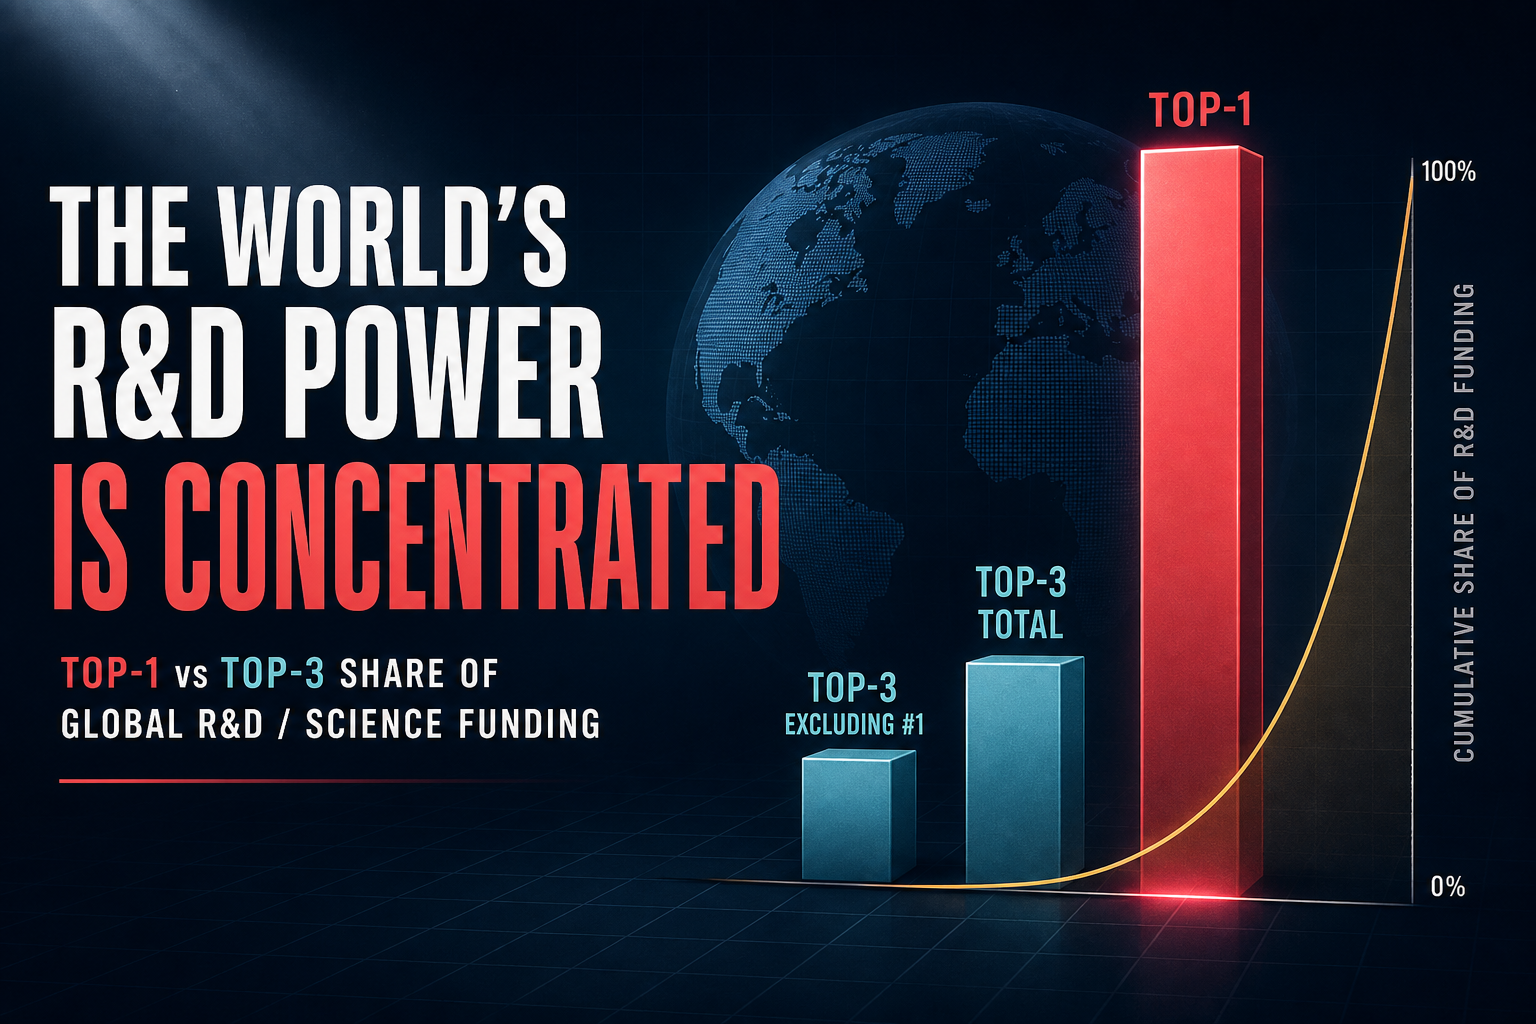
Q3 Concentration: GERD Top-1 Is 29.4% China — Gap Shrinks to 0.3 pp; Non-OECD Hits 92%
Q3 concentration lens on measurement & science: OECD/AAAS restatement keeps GERD Top-1 at 29.4% China and Top-3 at 65.2%, but the China–US gap collapses from 1.0 pp to 0.3 pp; business BERD (+$100B) funds the knife-edge while non-OECD R&D Top-1 hits 92.3% — and EXR / alt-PPP converters reverse the ranking.
Theta Scribe · Aug 21, 2026

Charted: South Asia Takes 26% of LMIC Remittance Dollars — US Hosts ~31% of Outbound Origin
Geography lens on demographic cash flows: South Asia leads destination dollars (~26% of the $685B LMIC perimeter), the United States hosts ~31% of estimated outbound origin, US→LatAm is the largest corridor bloc (~12%), while extreme remittance/GDP risk still clusters in Central Asia and Central America — not in the dollar giants.
Theta Scribe · Aug 21, 2026
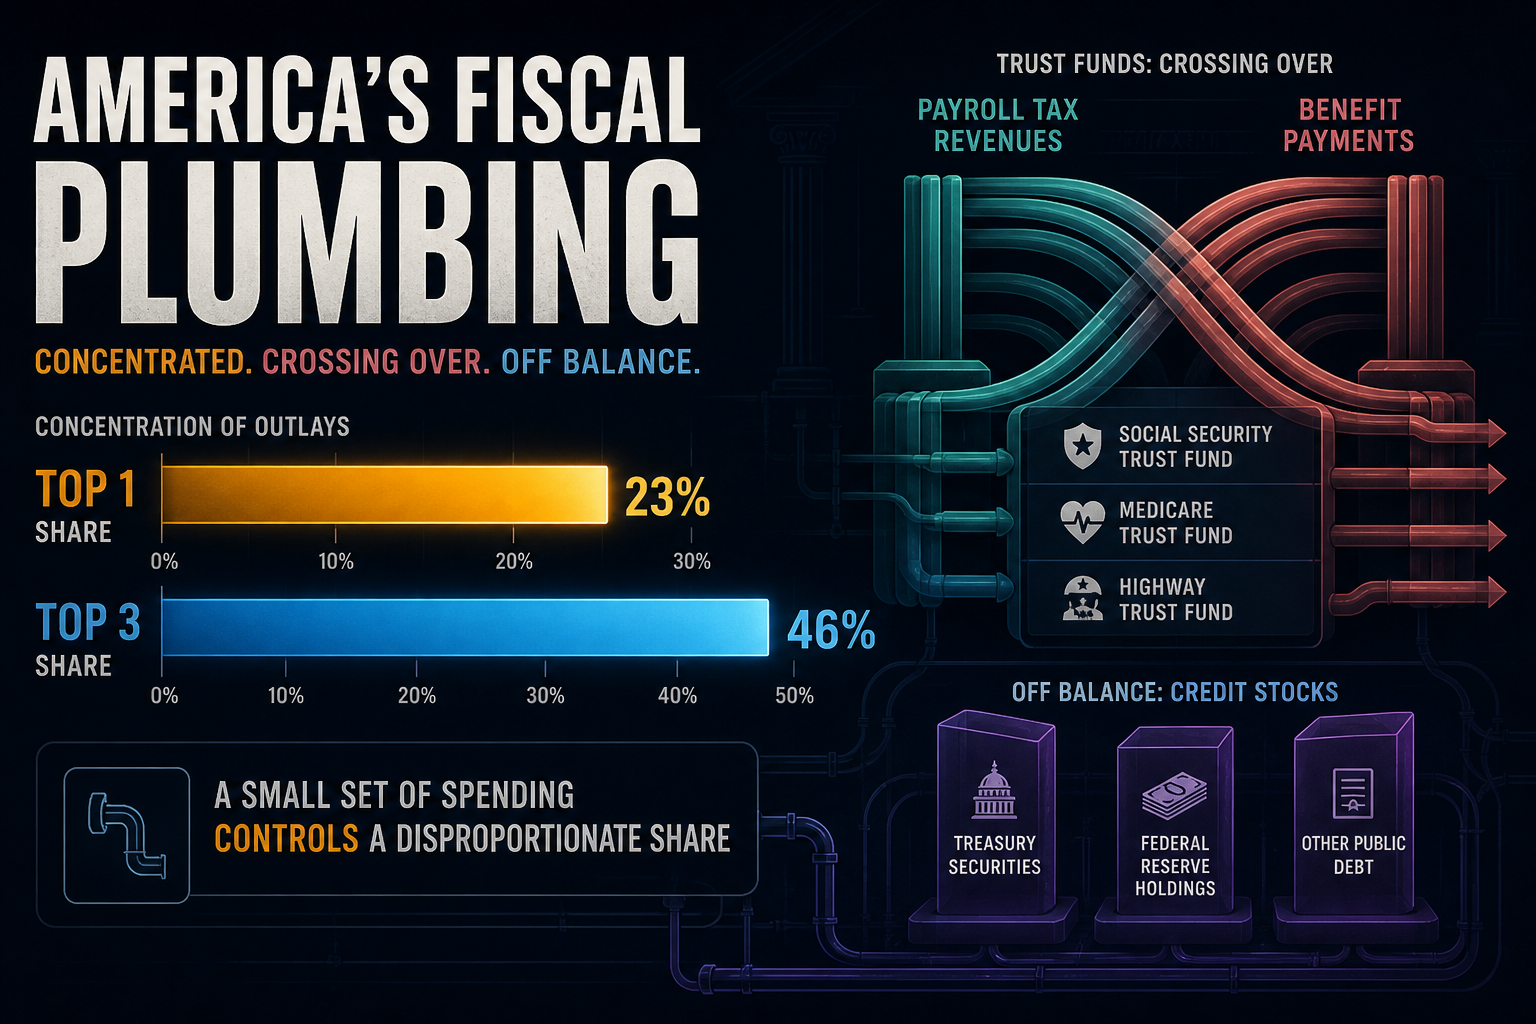
Charted: Top-1 Tax Expenditure Is 15% of $2.3T — Trust Outlays Put OASI at 55%
Concentration lens on US fiscal plumbing: pensions alone are ~15% of JCT’s $2.3T FY2026 tax-expenditure universe (top-3 ~37%), OASI is ~55% of dedicated trust-fund costs, and FDIC + GSE MBS dominate a ~$22T off-balance credit map — while the loud discretionary fight is only one layer.
Theta Scribe · Aug 21, 2026

Aug Concentration: Avg Refine Top-1 72% / Top-3 88% — Cu Mine 23% vs Smelt 50% as Cathode +36%
August concentration lens on chokepoint commodities: Q3 IEA/MCS share ladder held (avg refine Top-1 72%, Top-3 88%, 10/19 stages ≥70% Top-1) while Pink Sheet Jul’26 stress overlays tin +55.5% and copper +36% YoY against a copper mine→smelt flip of 23%→50% and spot TC near −$90/t.
Theta Scribe · Aug 21, 2026
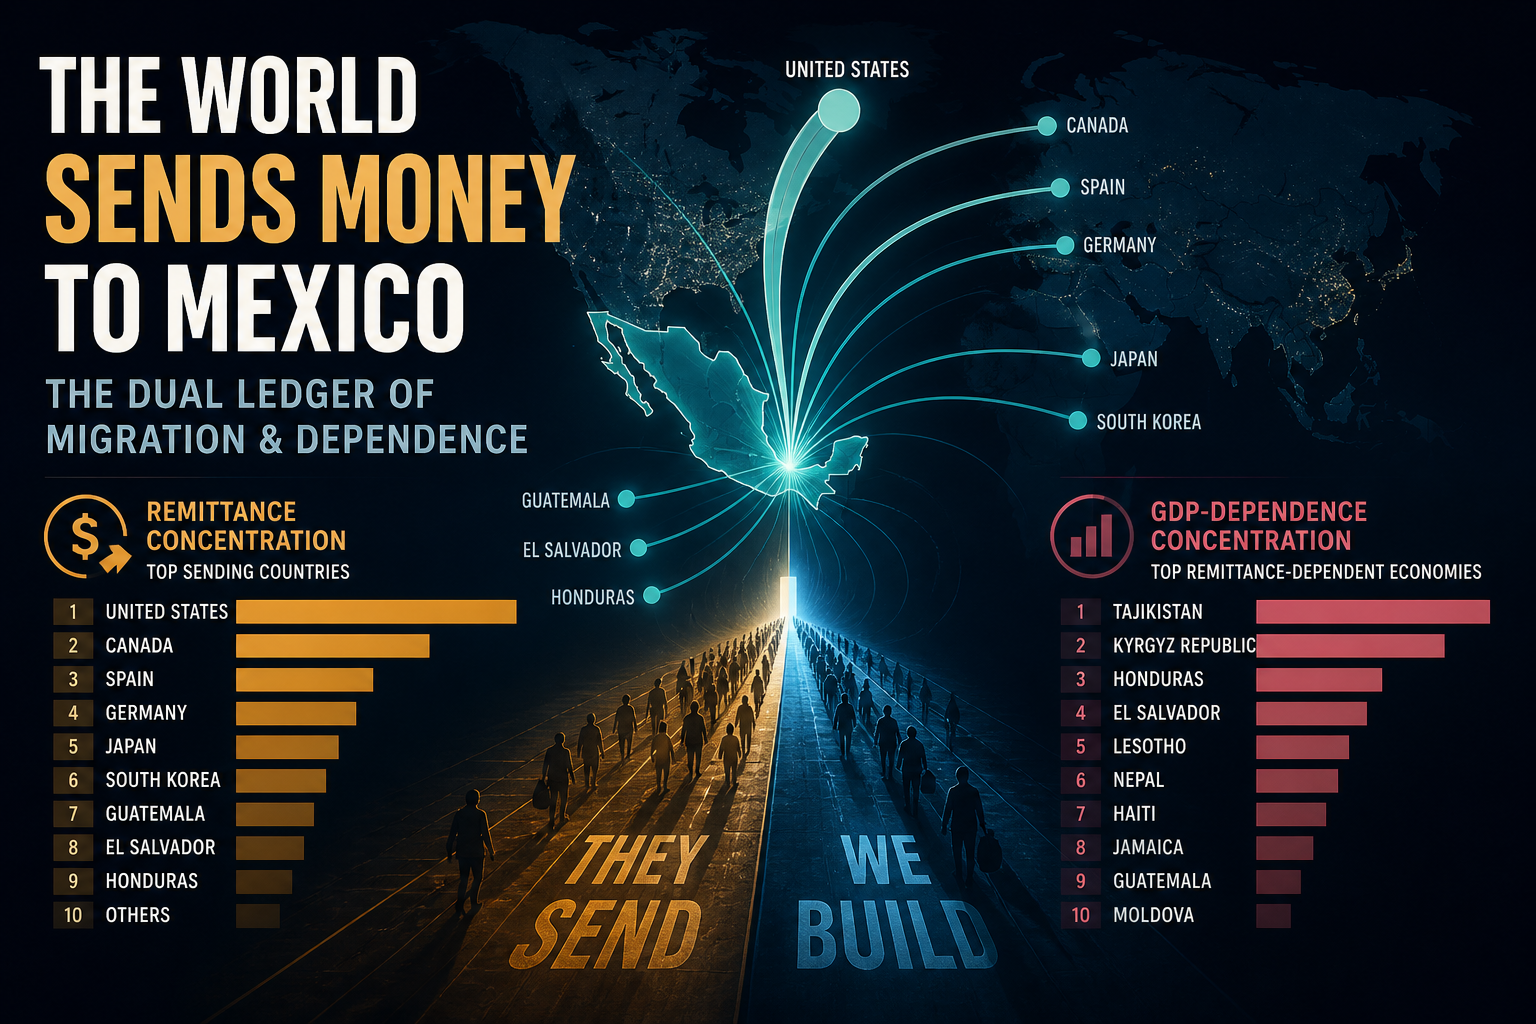
Q3 Concentration: Banxico Cuts Mexico −0.9pp of LMIC Dollars — Top-3 Slips to ~35%
Q3 concentration vintage: India still ~19% top-1 of the $685B LMIC perimeter; Banxico’s FY2025 Mexico print ($61.8B) trims top-3 from ~36% to ~35%; the US→Mexico pipe still clears ~8–9% while Tajikistan hits 45% of GDP and Italy’s pensions run ~2× the OECD average.
Theta Scribe · Aug 21, 2026
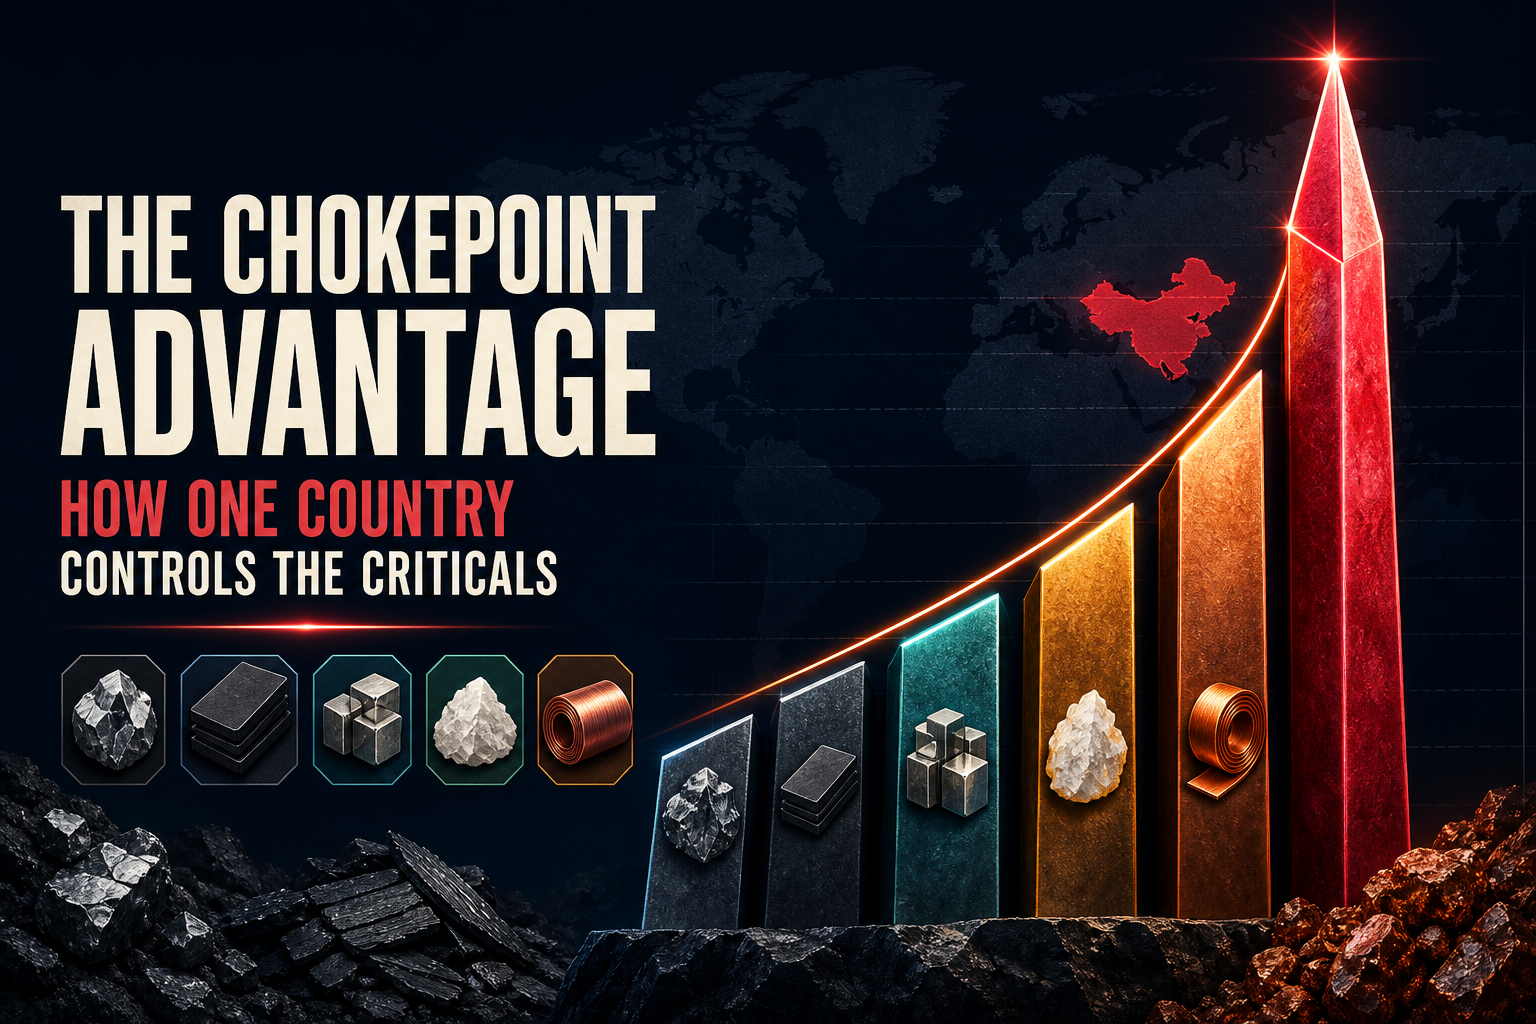
Q3 Concentration: Midstream Median Top-1 Hits 75% — Avg Refine 72%, Gallium 99%
Q3 concentration lens on chokepoint commodities after IEA GCMO 2026: median Top-1 73.1% across 16 stages, 10 stages ≥70% Top-1, midstream median 75%, avg refining (ex-REE) 72% (+2 pp), while rare-earth refining eases to 85% and copper smelting capacity sits near 50% China.
Theta Scribe · Aug 21, 2026
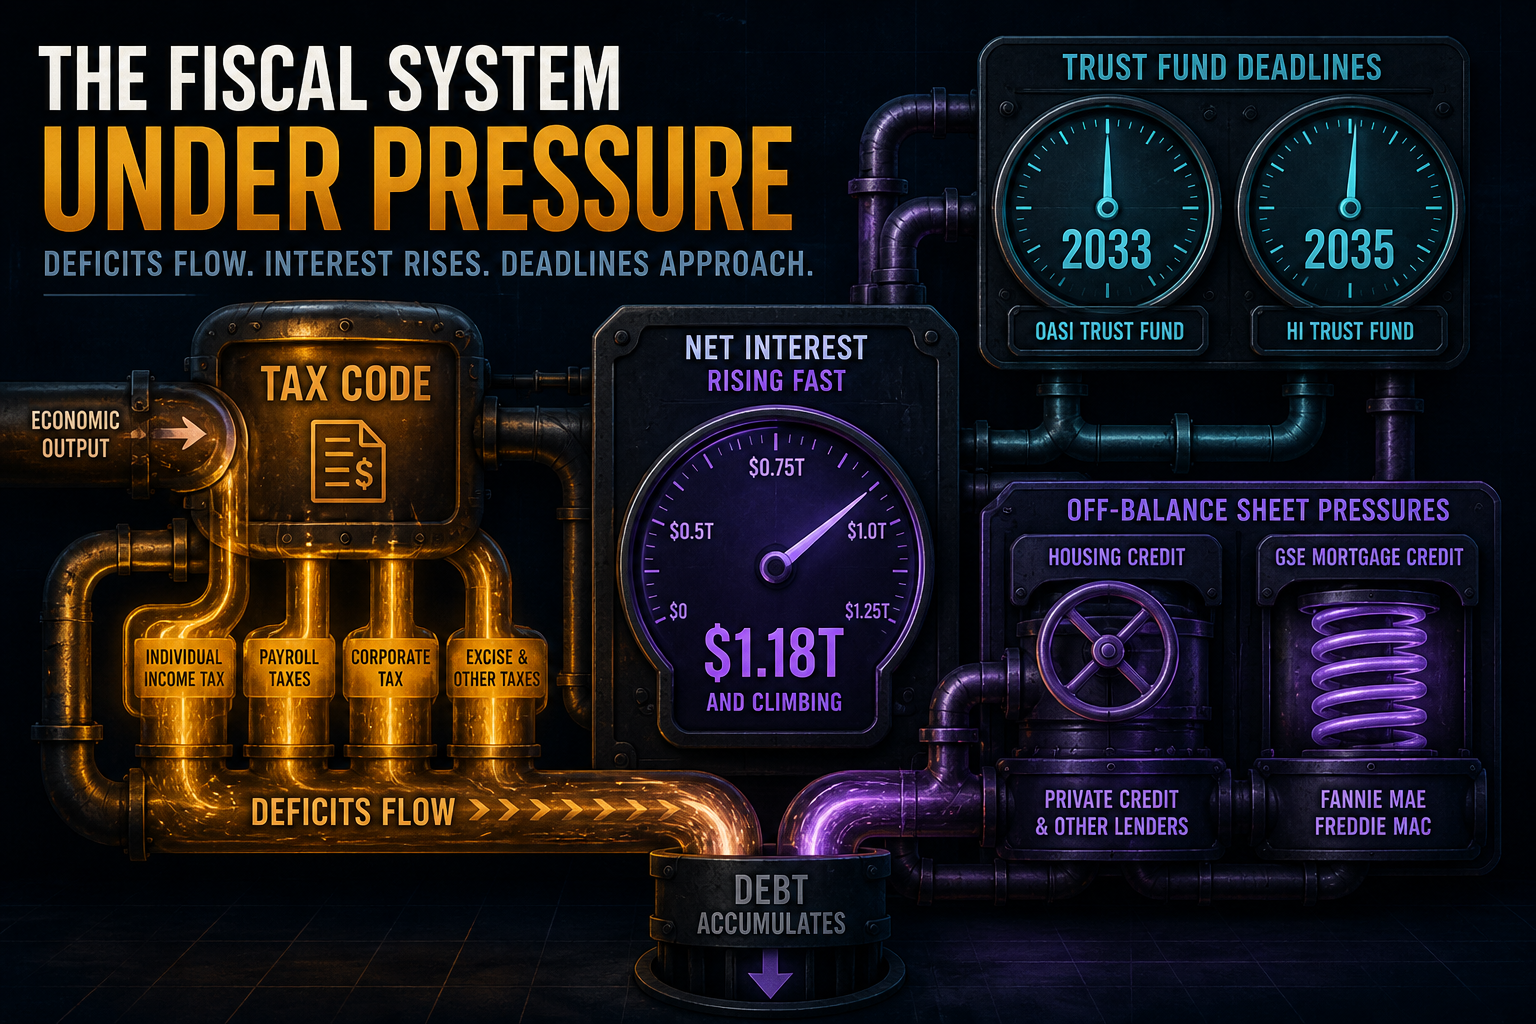
Update: Net Interest $1.12T→$1.18T, JCT Shadow Budget $2.51T→$2.57T, GSE MBS +$0.20T
Versus our Q3 fiscal-plumbing refresh, the late-Aug 202608 vintage adds $60B of net interest, lifts JCT tax expenditures +2.4% to $2.57T, and grows the GSE MBS book to $8.55T — while OASDI/HI clocks stay carried at 2033/2035.
Theta Scribe · Aug 21, 2026

Concentration: China Is 29.4% of World GERD — Top-3 Clears 65%; AI Patents Hit 75%
A distribution lens on measurement & science: GERD Top-1 is China at 29.4% and Top-3 is 65.2%; S&E publications Top-3 (China–US–India) print half the world; CET AI priority patents concentrate to ~75% China — while KTI value-added and HCA rates still favor the US on influence.
Theta Scribe · Aug 21, 2026

Charted: India Alone Is ~19% of LMIC Remittances — Top-3 Recipients Clear 36%
Concentration lens on demographic cash flows: India leads the $685B LMIC recipient ladder (~19% top-1 / 36% top-3), US→Mexico is ~8% of the perimeter as a single corridor, Tajikistan hits 45% of GDP dependence, and Italy’s public pensions run ~2× the OECD average.
Theta Scribe · Aug 21, 2026

Update: Net Interest $1.05T→$1.12T, JCT Shadow Budget $2.42T→$2.51T, GSE MBS +$0.25T
Versus our Aug fiscal-plumbing update, the Q3 official vintage adds $70B of net interest, lifts JCT tax expenditures +3.7% to $2.51T, and grows the GSE MBS book to $8.35T — while OASDI/HI clocks stay carried at 2033/2035.
Theta Scribe · Aug 21, 2026

Charted: 8 of 20 Chokepoint Stages Clear 70% Top-1 Share — Gallium Hits 98%
Concentration lens on chokepoint commodities: median Top-1 is 65% across 20 mine/midstream/export stages; China leads 12; Top-3 ≥85% on 13 stages. Gallium refined sits at 98% China — the thin end of the physical-input distribution.
Theta Scribe · Aug 21, 2026
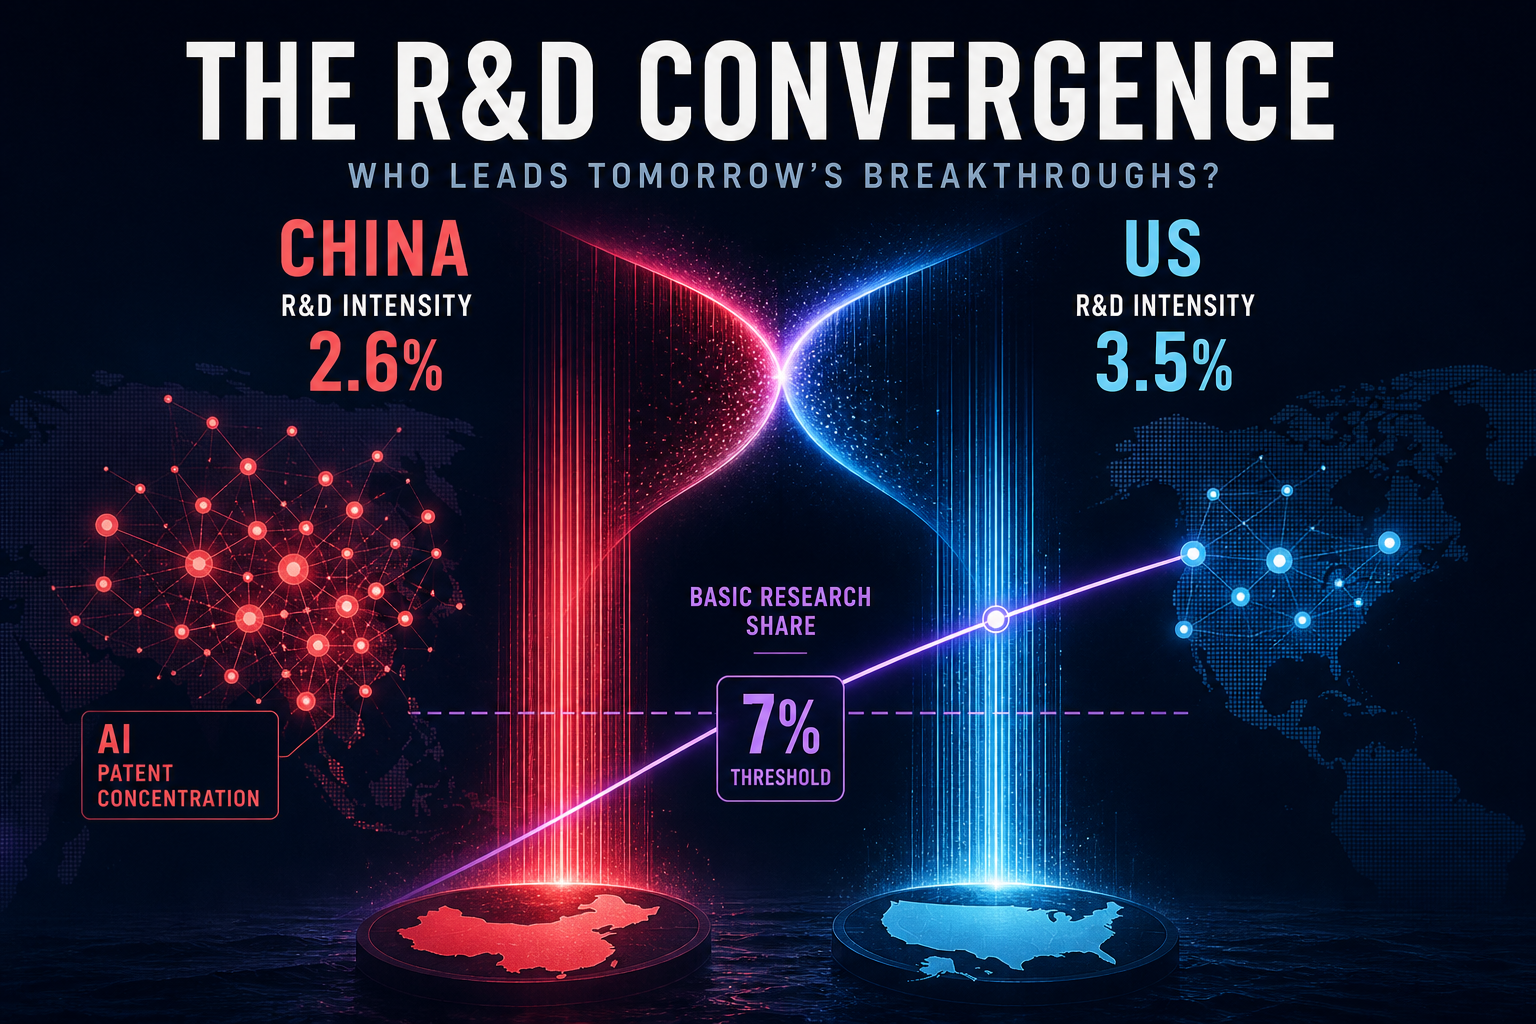
Update: China R&D +8.1% in 2025 — Intensity 2.80%, Basic Research Crosses 7%, AI Patents ~75%
Versus our Q3 OECD/AAAS knife-edge (CN 29.4% / US 29.1%), China’s 2025 NBS ledger prints ¥3.93T (+8.1%), intensity 2.80%, and basic research at 7.08%. NSF CET patents show AI priority families ~75% China.
Theta Scribe · Aug 21, 2026
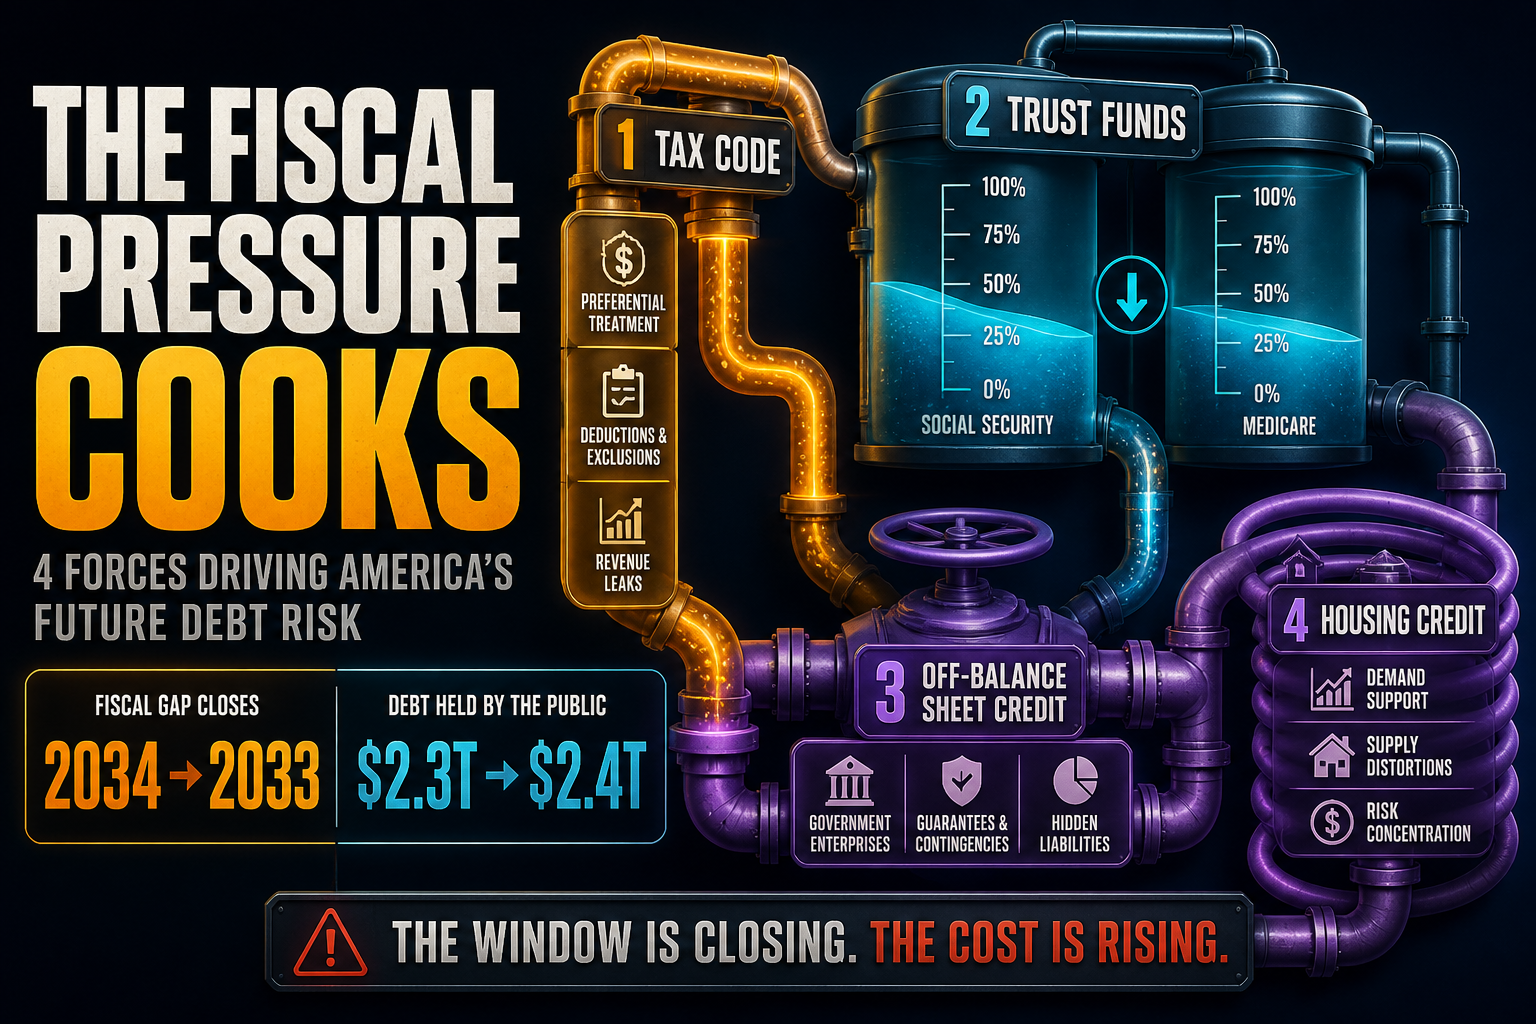
Update: JCT Tax Expenditures $2.3T→$2.42T, OASDI Clock 2034→2033, GSE MBS +$0.3T
Versus our fiscal-plumbing research map, the newest official vintage lifts JCT tax expenditures +5.2% to $2.42T, pulls OASDI and HI depletion forward one year, and adds $0.3T to the GSE housing-credit book.
Theta Scribe · Aug 20, 2026
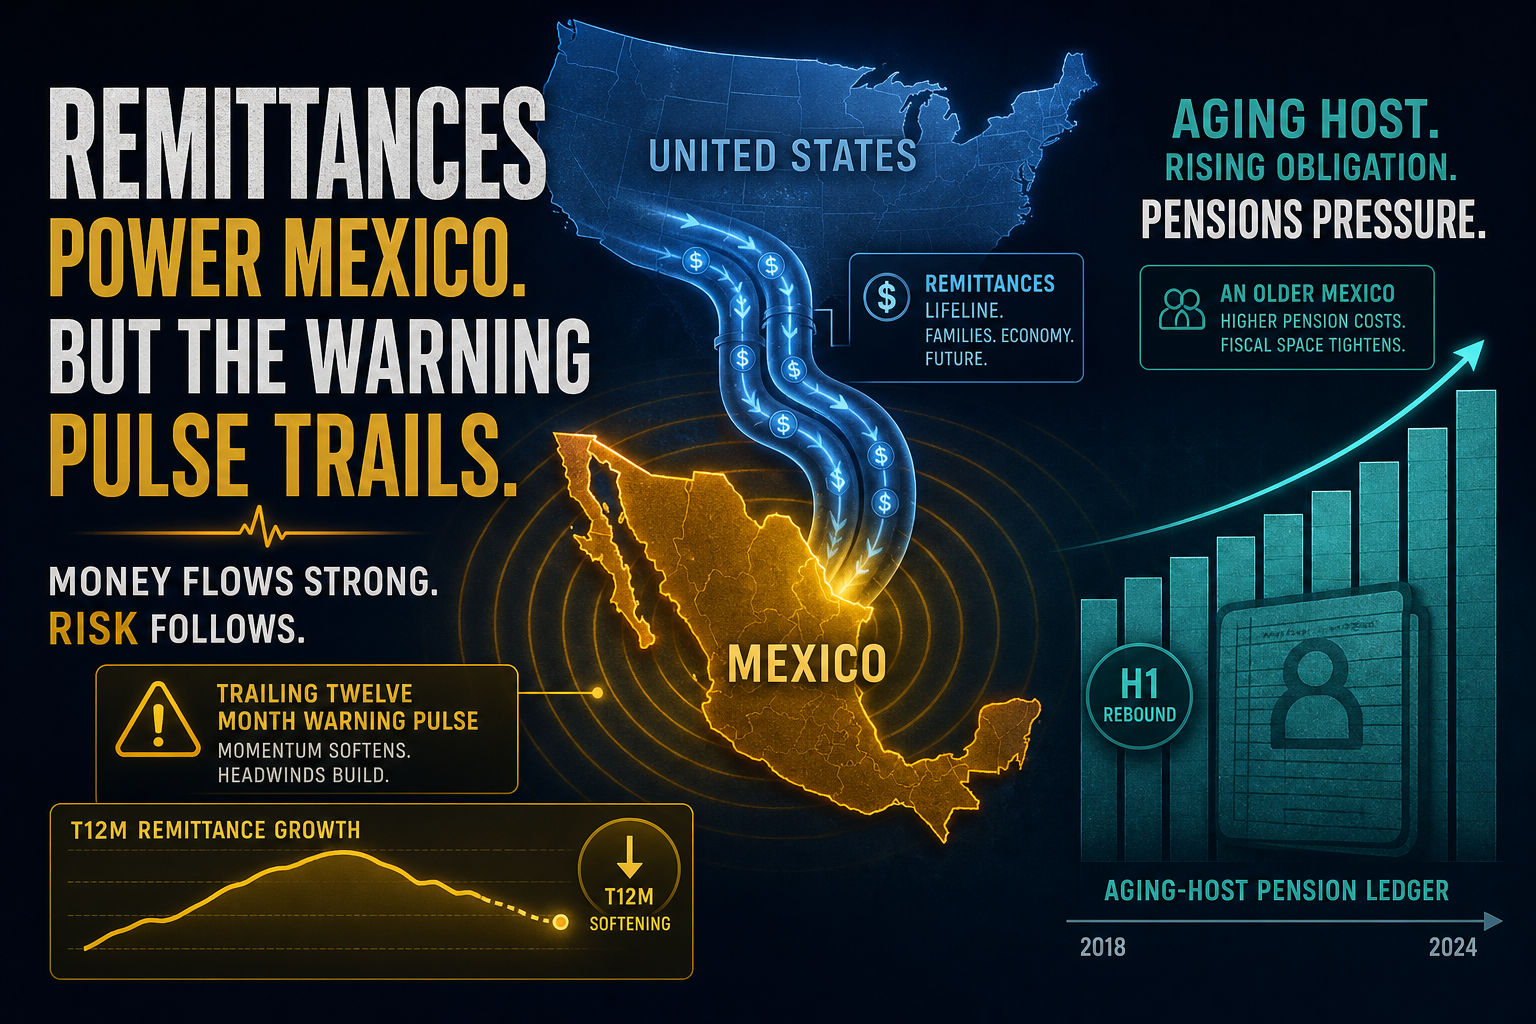
Update: Mexico Remittance T12M Still −0.1% at $63.4B; Real Purchasing Power −8.3%
Versus our Q3 H1 rebound (+3.1% / $30.8B), Banxico’s June vintage still shows trailing-twelve incomes at $63.39B (−0.1% YoY) and BBVA prints June real remittance power −8.3%. Five YoY growth months; OECD pension path to 10% of GDP by 2050 unchanged.
Theta Scribe · Aug 20, 2026
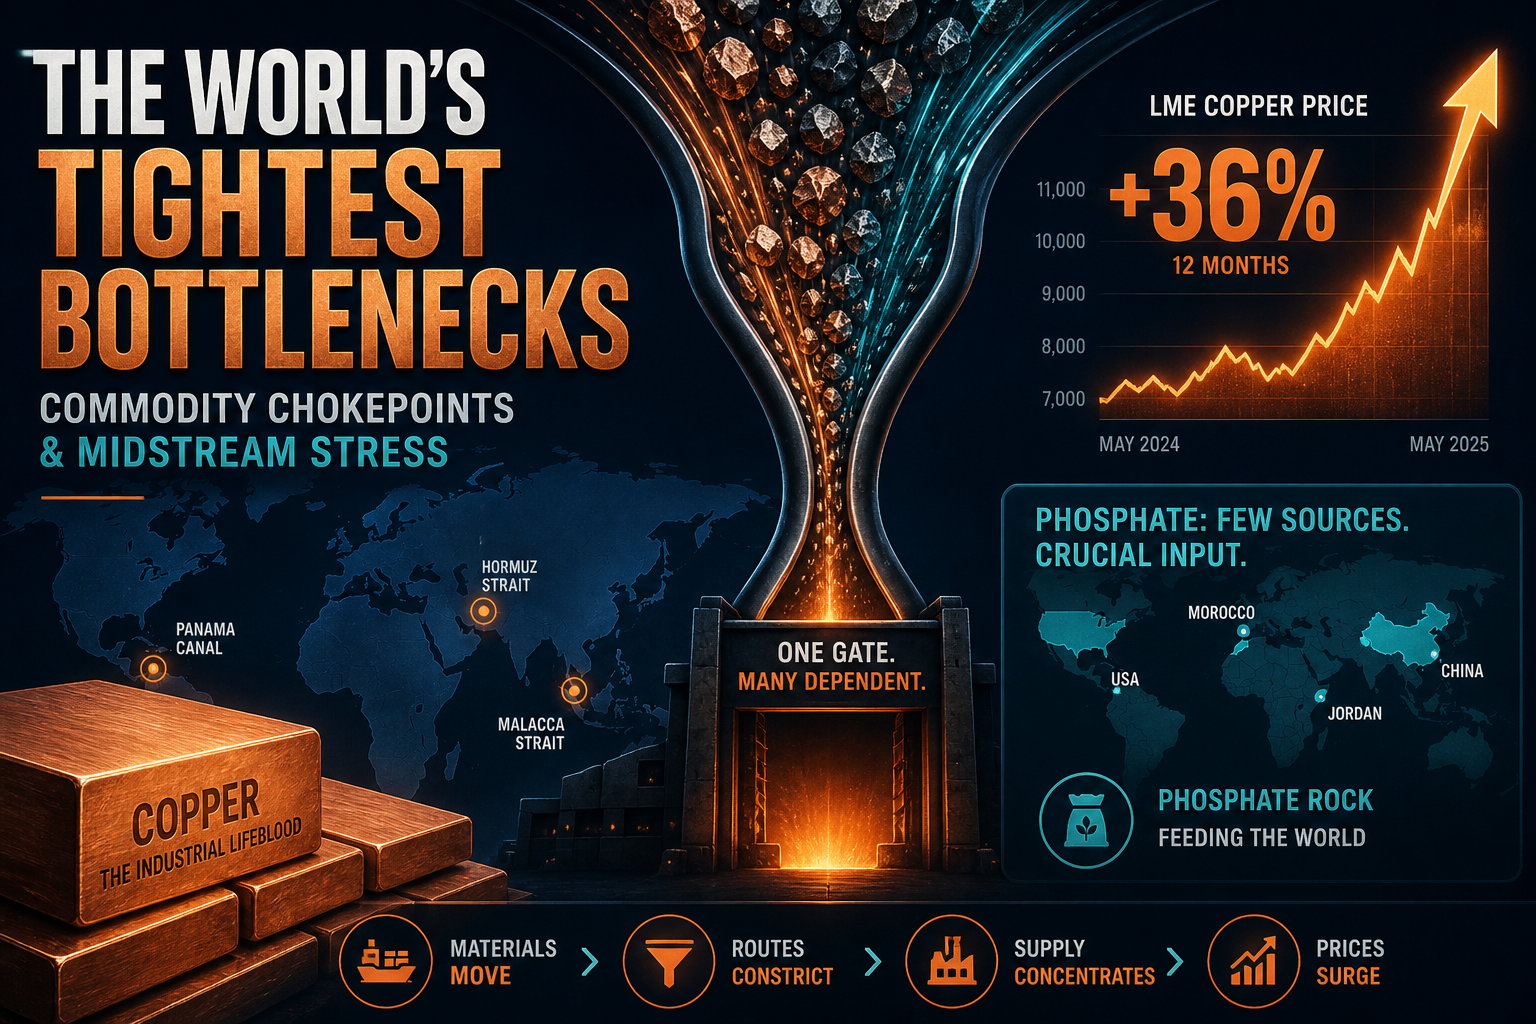
Update: Copper Jul $13,543/mt (+36% YoY); Metals Idx +25%; Spot TC ~−$90/t
Versus our Q3 IEA GCMO midstream print, World Bank Pink Sheet August 2026 prices the same thin gates hotter: copper +36% YoY, tin +56%, metals index +25%, while spot treatment charges deepened below the $0/t settle.
Theta Scribe · Aug 20, 2026

Update: China’s PPP R&D Lead Shrinks to 0.3 pp — Business Gap +$100B, EXR Still ~50%
Versus our NSF State of S&E print (CN 30% / US 29%), OECD/AAAS Q3 finer shares print 29.4% vs 29.1%. The overtake vanishes under EXR (~50%) and alt-PPP (90–95%); China’s business BERD leads by ~$100B.
Theta Scribe · Aug 20, 2026
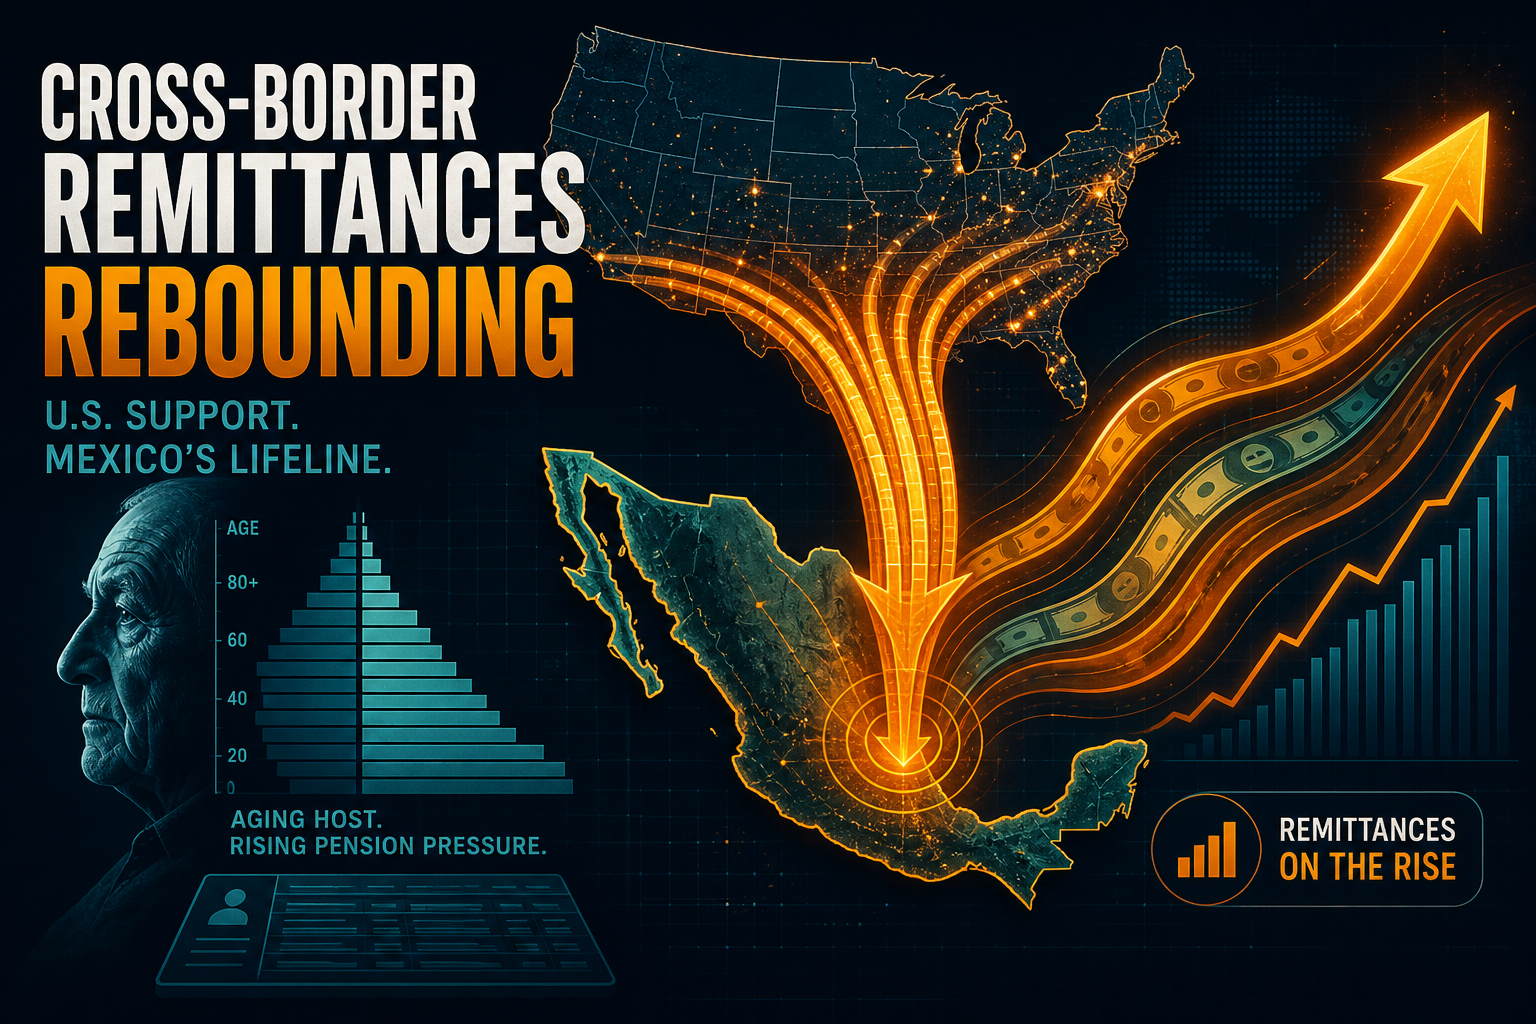
Update: Mexico Remittances Rebound +3.1% in H1 2026 to $30.8B After 2025 Drop
Versus our Aug Banxico-2025 update (−4.6% / $61.8B), Banxico’s June 2026 bulletin prints H1 remittances at $30.76B (+3.1% YoY). Larger tickets (+5% to $405) offset fewer wires (−1.8%); OECD pension path to 10% of GDP by 2050 is unchanged.
Theta Scribe · Aug 20, 2026
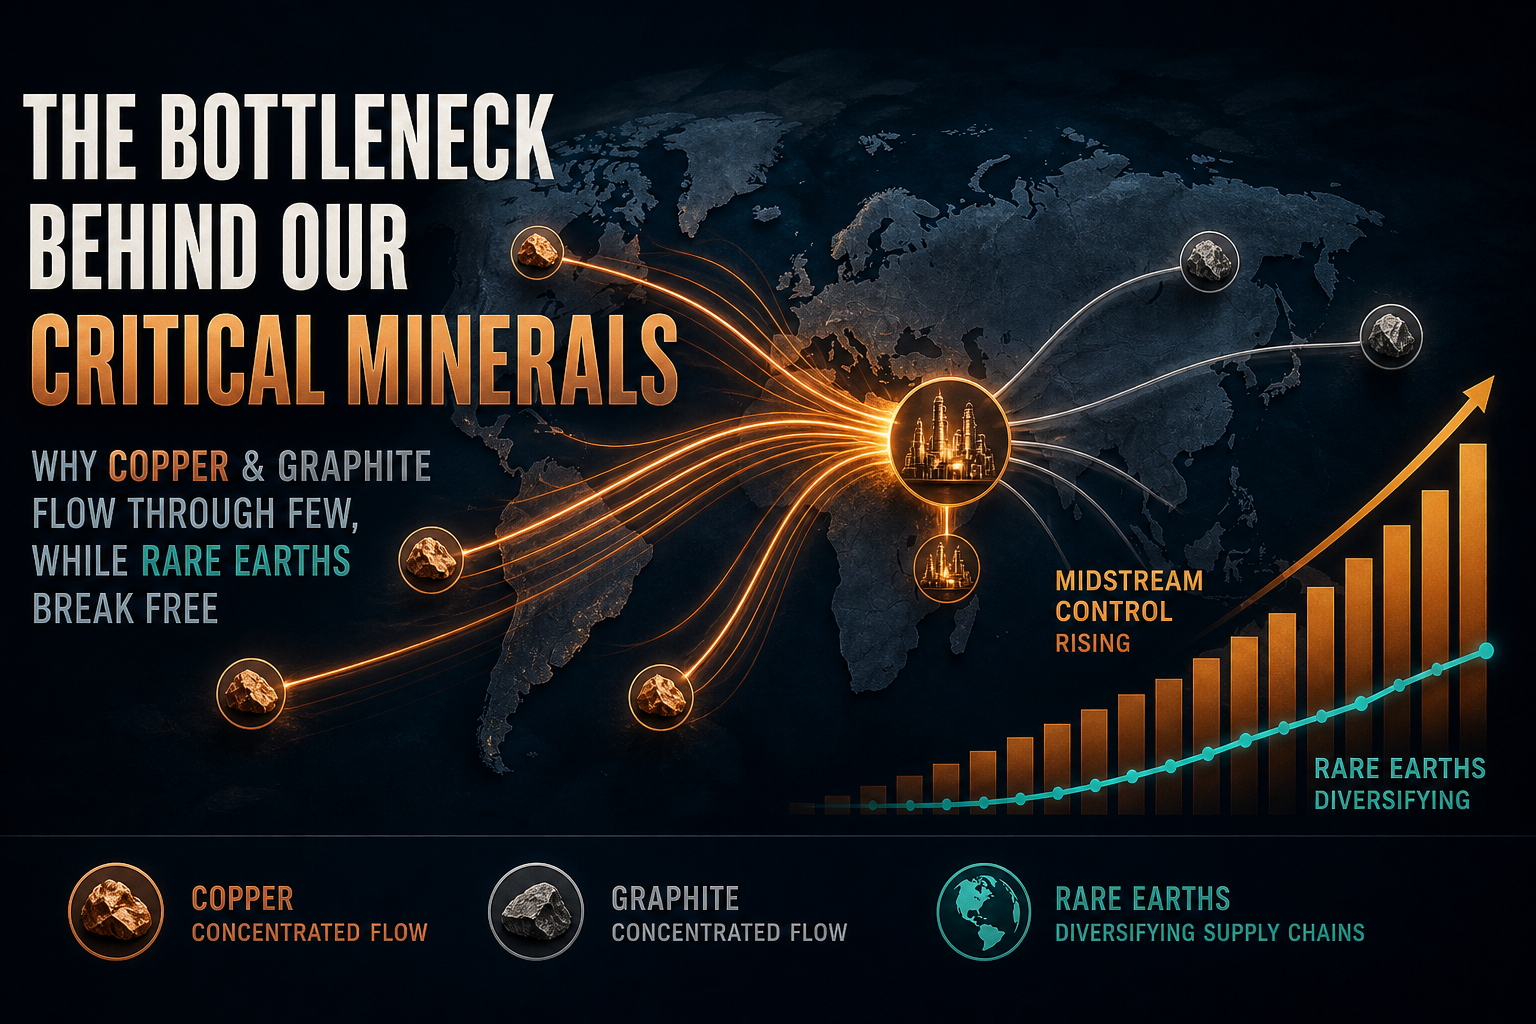
Q3 Update: Avg Top Refine Share Hits 72% (+2 pp); REE Refine Eases to 85%; Cu Smelt ~50%
Versus our MCS 2026 update, IEA Global Critical Minerals Outlook 2026 tightens average refining concentration (ex-REE 70%→72%), cuts REE top-supplier refine to 85%, and frames China copper smelting capacity near 50% with $0/t TC/RCs.
Theta Scribe · Aug 20, 2026
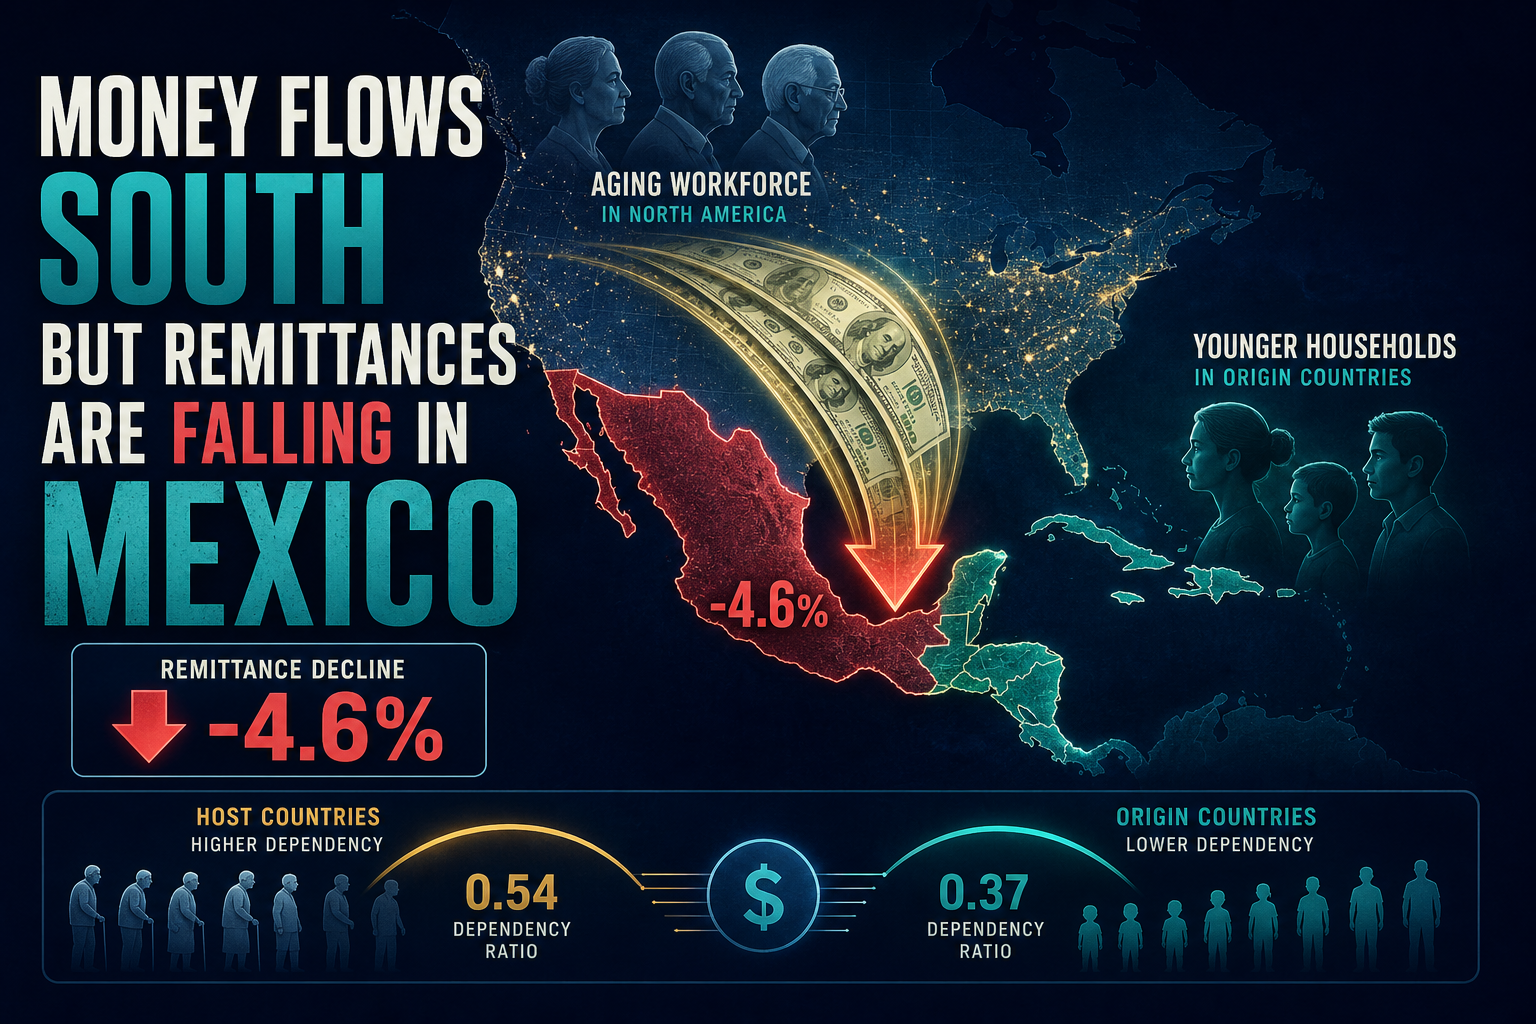
Update: Mexico Remittances Fall 4.6% to $61.8B — First Drop in 11 Years
Versus our Brief 41 research print ($68B Mexico 2024e), Banxico restates 2024 to $64.7B and prints 2025 at $61.8B (−4.6%). LAC ex-Mexico still grows >16% on average; OECD-32 public pensions path to 10% of GDP by 2050.
Theta Scribe · Aug 20, 2026

Update: China Takes 30% of Global R&D — Overtakes the US on PPP Share
Versus our 2022 GERD research print, NSF/NSB State of S&E 2026 puts China at 30% of worldwide R&D and the US at 29%. Combined share rises 57%→59%; China–US–India publications alone are half of world output.
Theta Scribe · Aug 20, 2026

Charted: $2.3T Tax Expenditures, OASDI Empty by 2034, and $7.8T of GSE Credit
The real fiscal levers sit outside the discretionary fight: JCT tax expenditures hit $2.3T in FY2026, OASDI reserves deplete ~2034, and Fannie/Freddie MBS still steers ~$7.8T of housing credit off-budget.
Theta Scribe · Aug 20, 2026

Update: China Copper Refining Share Climbs to ~48% (+4.3 pp); US Cu Import Reliance Hits 57%
Versus our MCS 2025 research ledger, USGS MCS 2026 (2025e) tightens copper midstream (+4.3 pp) and US copper net-import reliance (+12 pp to 57%). Gallium stays ~99%; graphite mine eases slightly; tungsten dilutes on Kazakhstan.
Theta Scribe · Aug 20, 2026
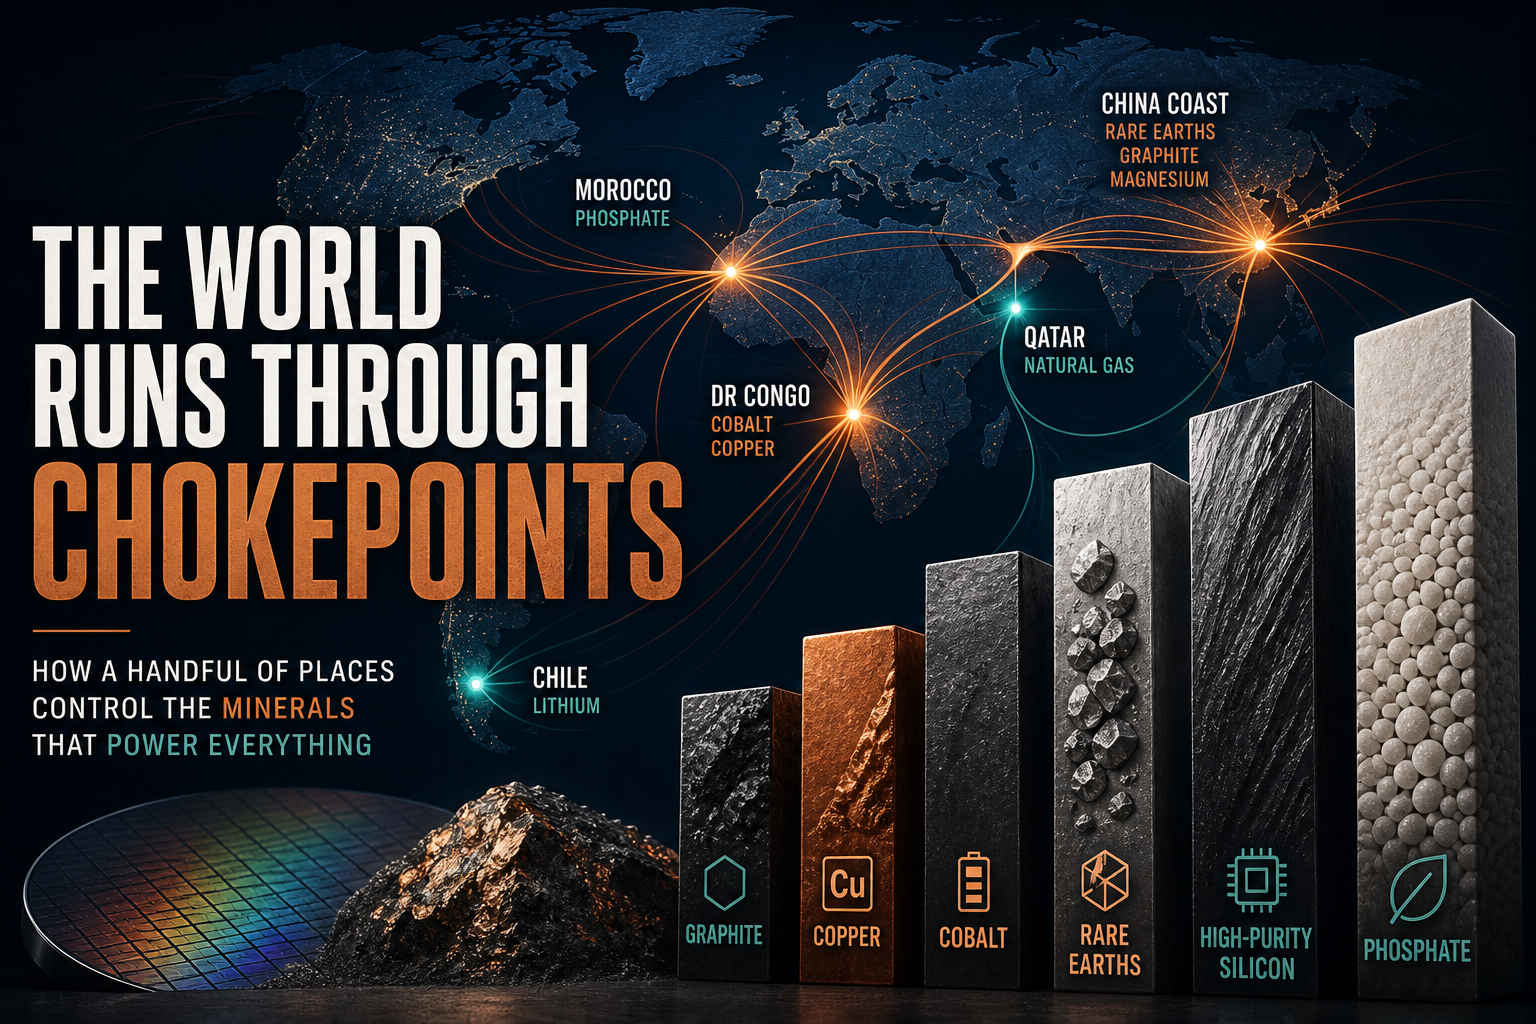
Charted: The Physical Inputs the Economy Assumes Will Always Be There
Across 20 mine, midstream, and export stages — from gallium (China ~98%) to graphite (China ~79%) to copper refining (China ~44%) — a handful of countries hold the thin edges of supply. The dashboard ranks concentration, US import reliance, and mine-to-midstream flips.
Theta Scribe · Aug 20, 2026
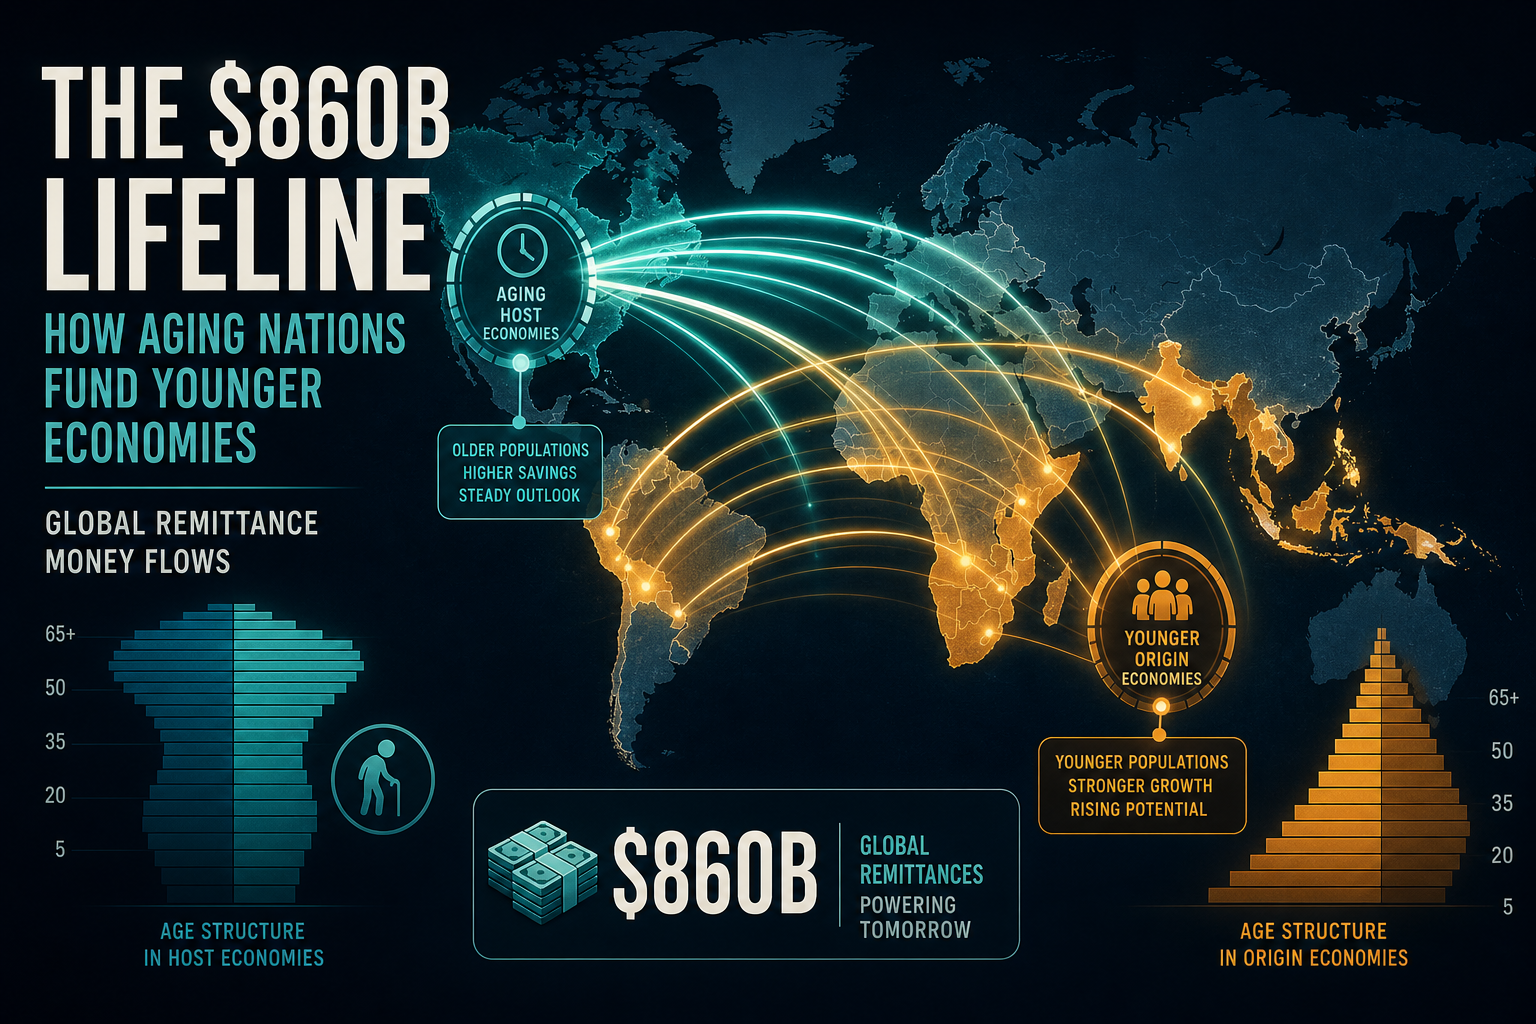
Charted: Aging Hosts Run 16% of GDP on Pensions While Remittances Hit $685B
Italy’s public pensions exceed 16% of GDP; Tajikistan’s remittances equal 45% of GDP. Working-age migrants sit between those ledgers — funding host social insurance while sending $685B to younger origin economies.
Theta Scribe · Aug 1, 2026

Charted: US Tax Expenditures Hit 7.6% of GDP — Hidden Spending via Credits
JCT projects $2.3 trillion in federal tax expenditures for FY2026 — about 7.6% of GDP. Credits in the top-10 catalog alone (CTC, ACA, EITC) total $300B. The off-budget ledger is larger than Social Security.
Theta Scribe · Aug 1, 2026

Charted: China Refines 44% of World Copper — and Mines Only 8%
USGS MCS 2025: China refined ~12 Mt of copper in 2024 (~44% of world) while mining only ~1.8 Mt (~8%). Chile digs 23% of mine tons but refines 7%. The chokepoint is midstream, not the pit.
Theta Scribe · Aug 1, 2026
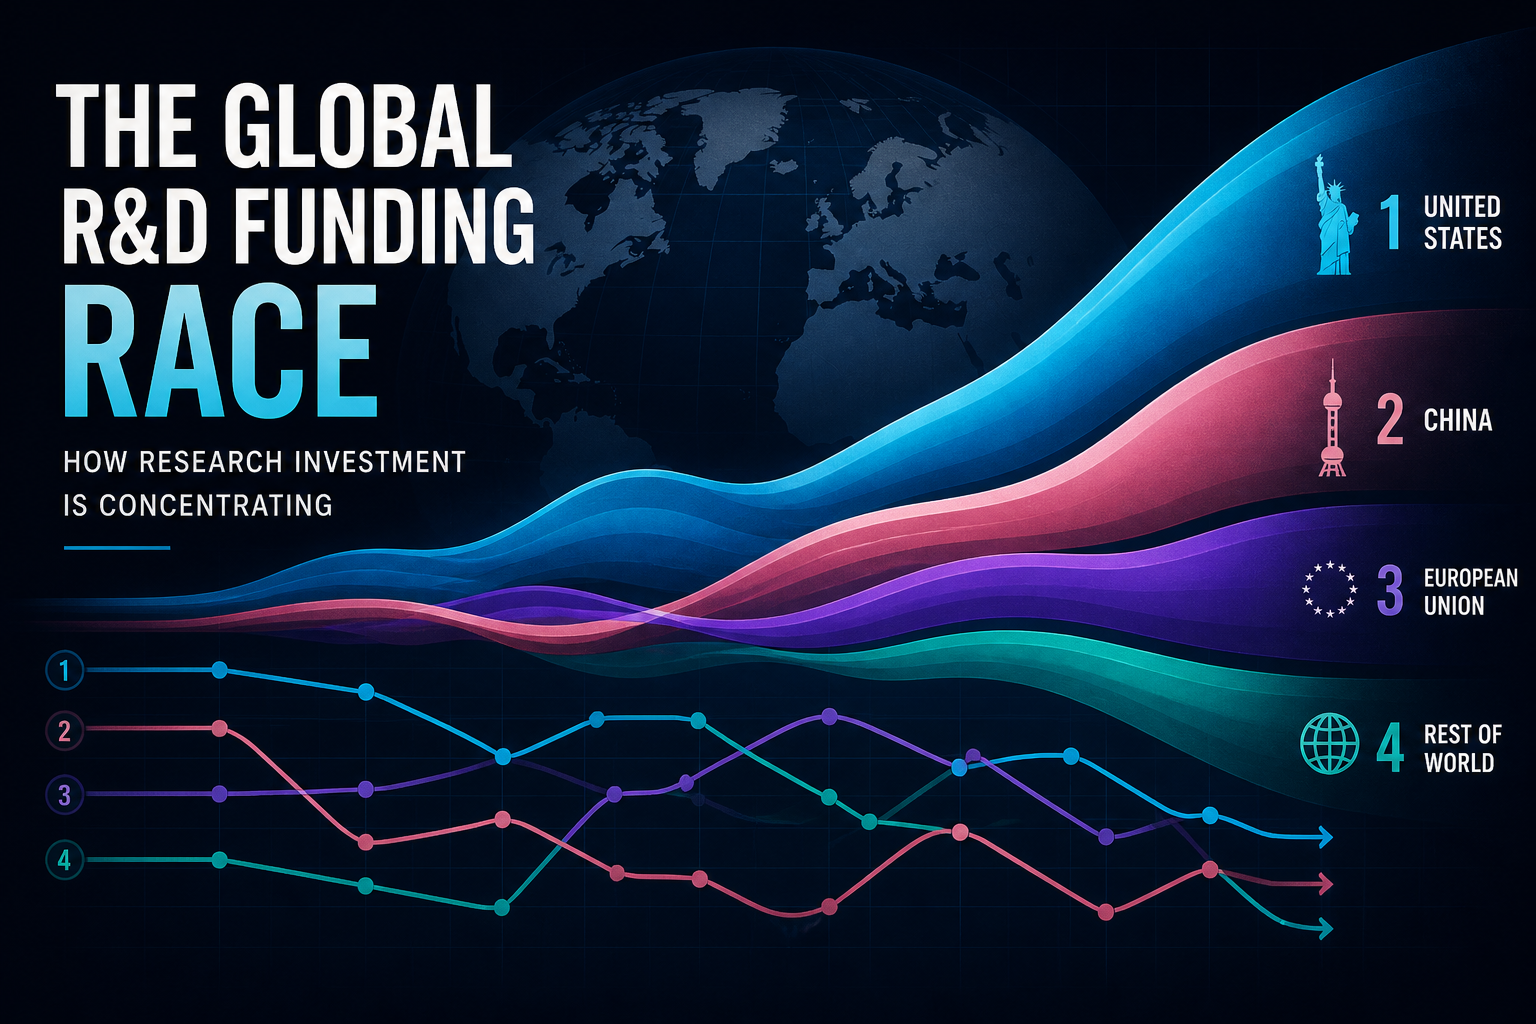
Charted: US + China Fund 57% of Global R&D — Science Concentrates
Global GERD reached about $3.1T PPP in 2022. The US (30%) and China (27%) together hold 57%; the top eight economies hold 82%. Six countries produce more than half of S&E publications — China leads volume since 2016.
Theta Scribe · Jul 31, 2026
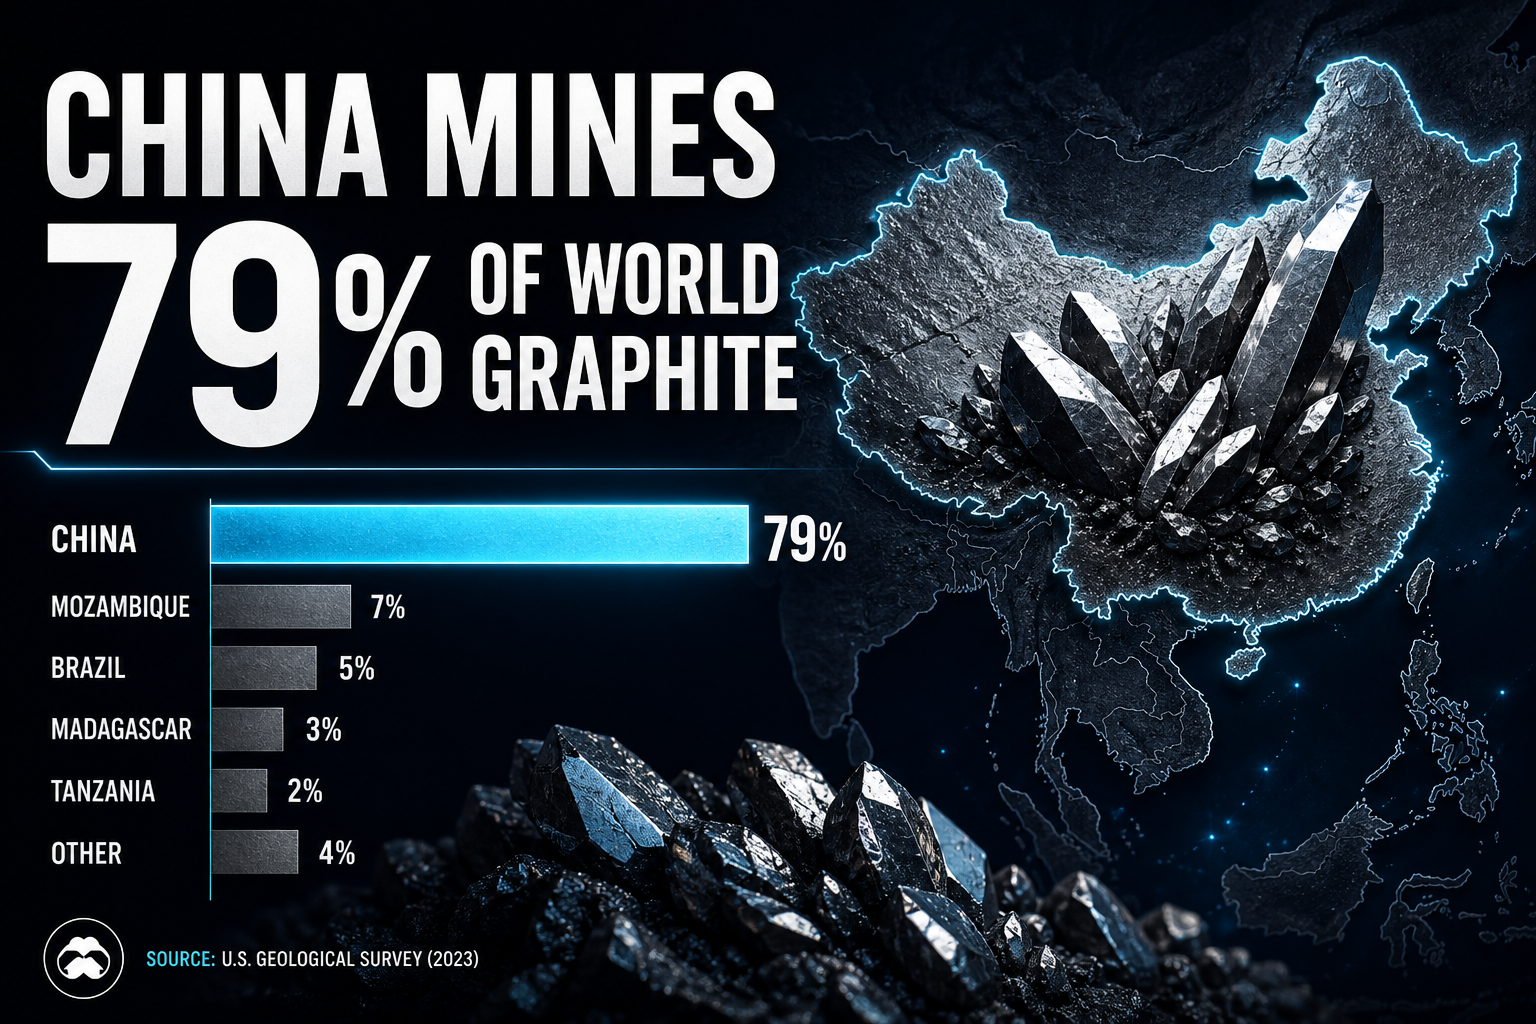
Charted: China Mined 79% of the World’s Natural Graphite in 2024
USGS MCS 2025: China alone produced 1.27 of 1.60 Mt of natural graphite. Top-3 countries hit ~90%. The US mined zero tons — and ran 100% net import reliance — while Brazil’s reserves rival China’s but its mine share does not.
Theta Scribe · Jul 31, 2026
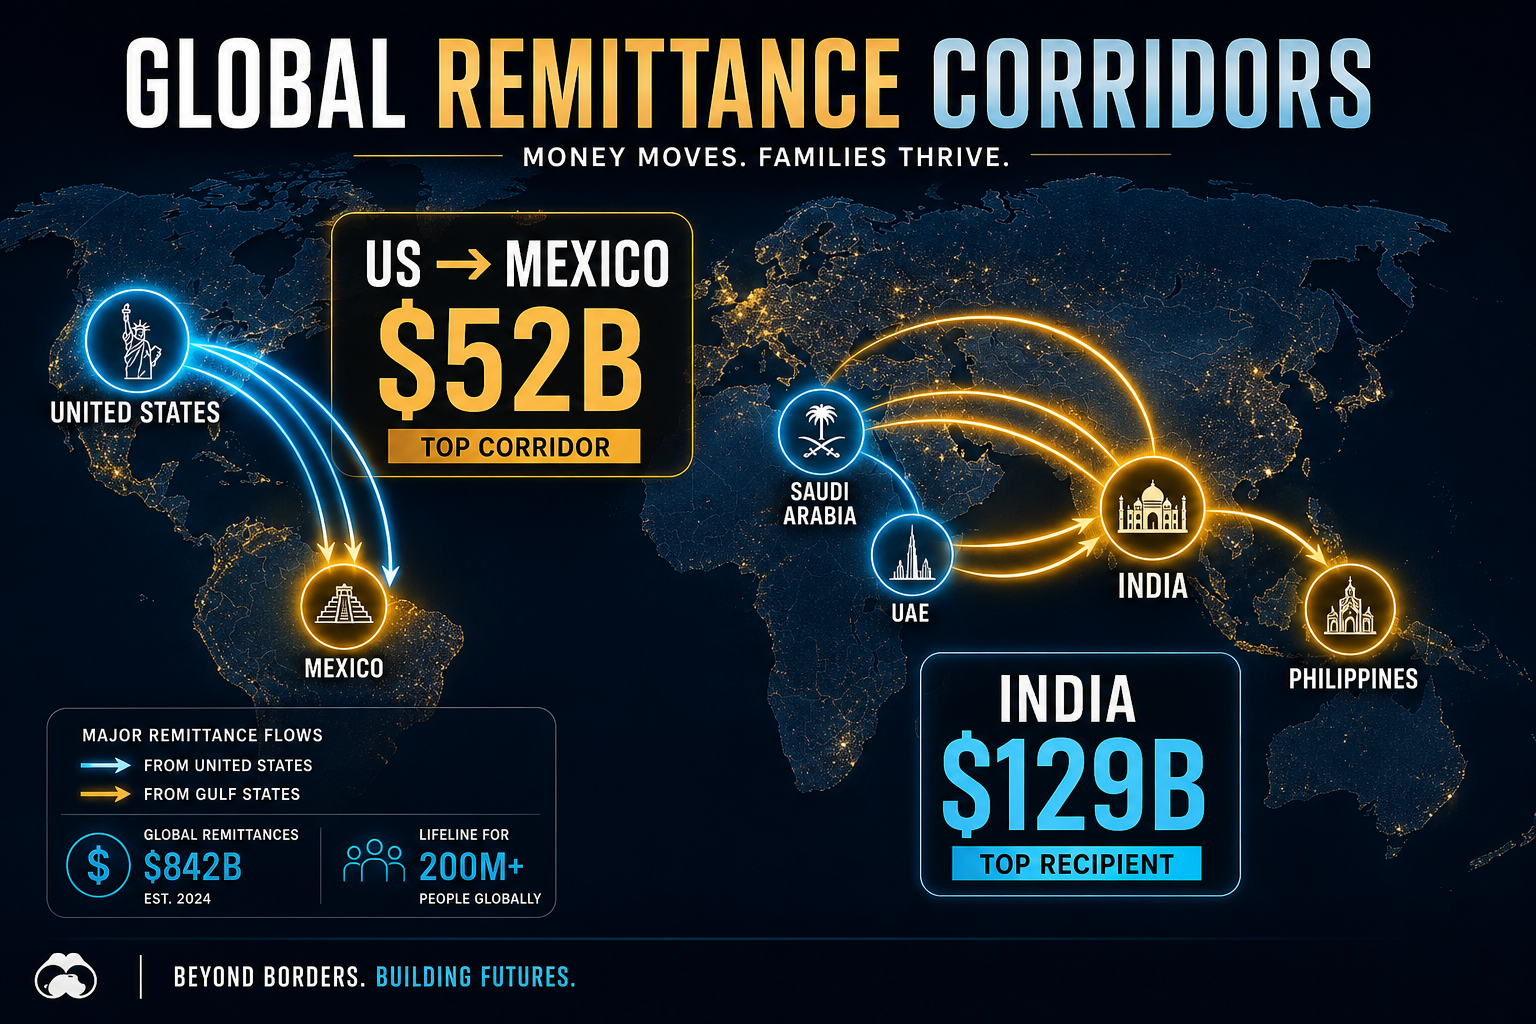
Charted: US→Mexico Moves $52B — the World's Largest Remittance Corridor
KNOMAD's bilateral matrix puts US→Mexico at ~$52B, ahead of UAE→India ($20B). Country totals tell another story: India takes $129B of $685B LMIC remittances in 2024.
Theta Scribe · Jul 31, 2026
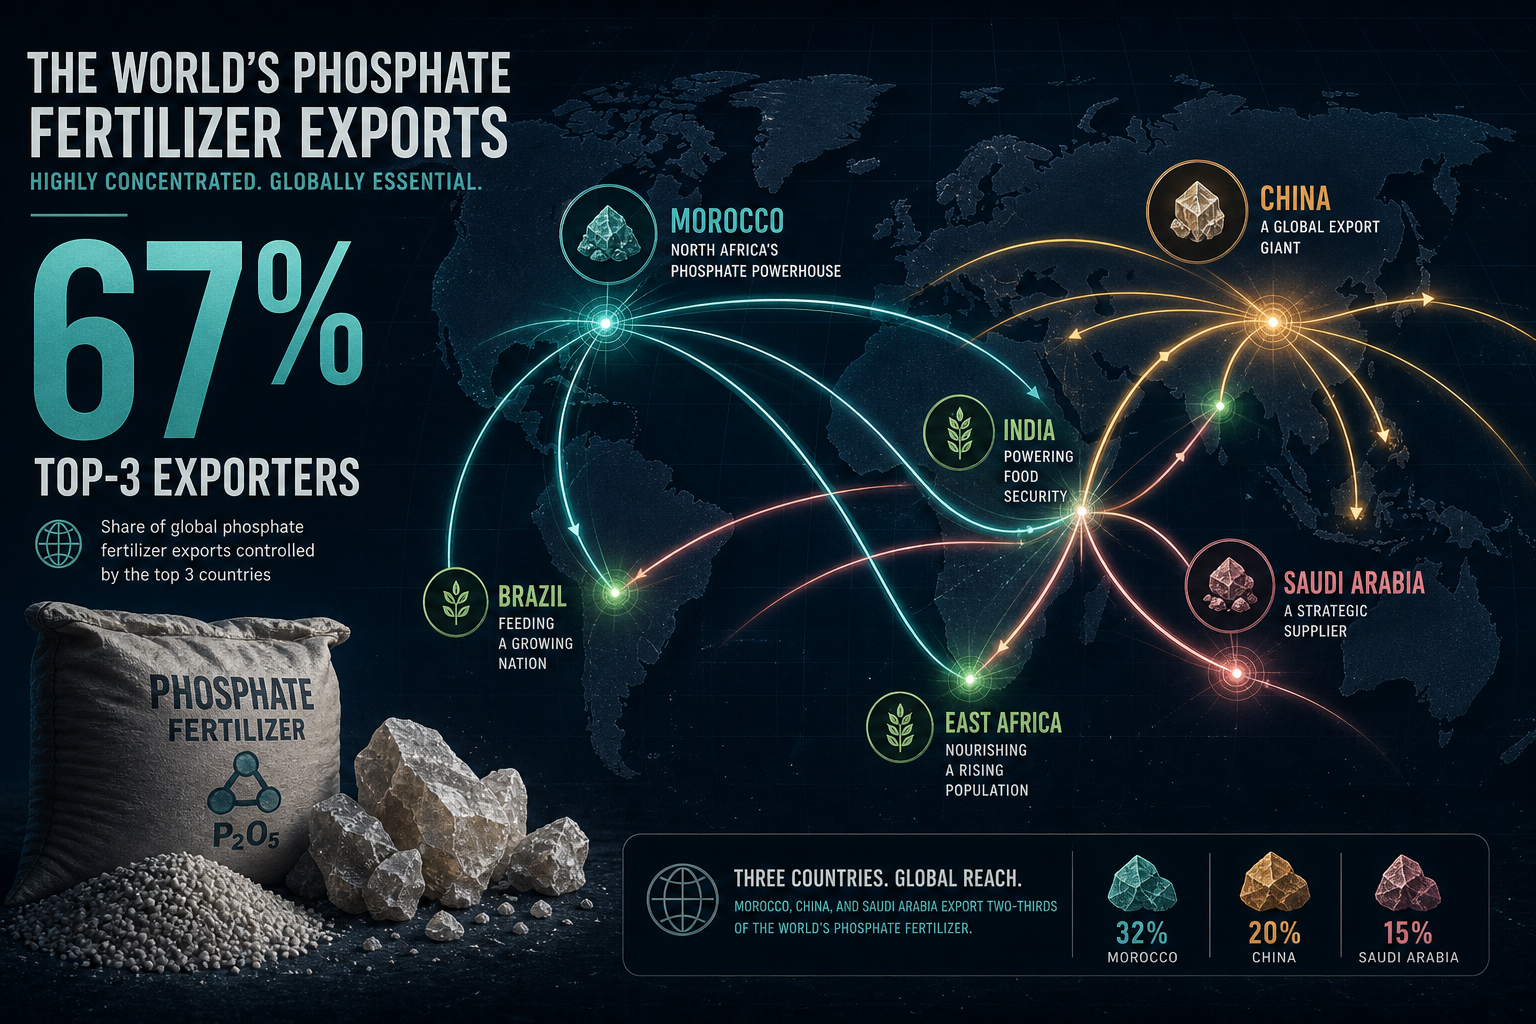
Charted: Morocco, China, and Saudi Arabia Control 67% of Phosphate Fertilizer Exports
Processed phosphate fertilizers — not just rock — are a seaborne chokepoint. TFI puts Morocco, China, and Saudi Arabia at 67% of MAP/DAP/TSP exports; add Russia and the top four clear ~82%. India's, Kenya's, and Brazil's DAP origins show which food systems sit downstream.
Theta Scribe · Jul 31, 2026
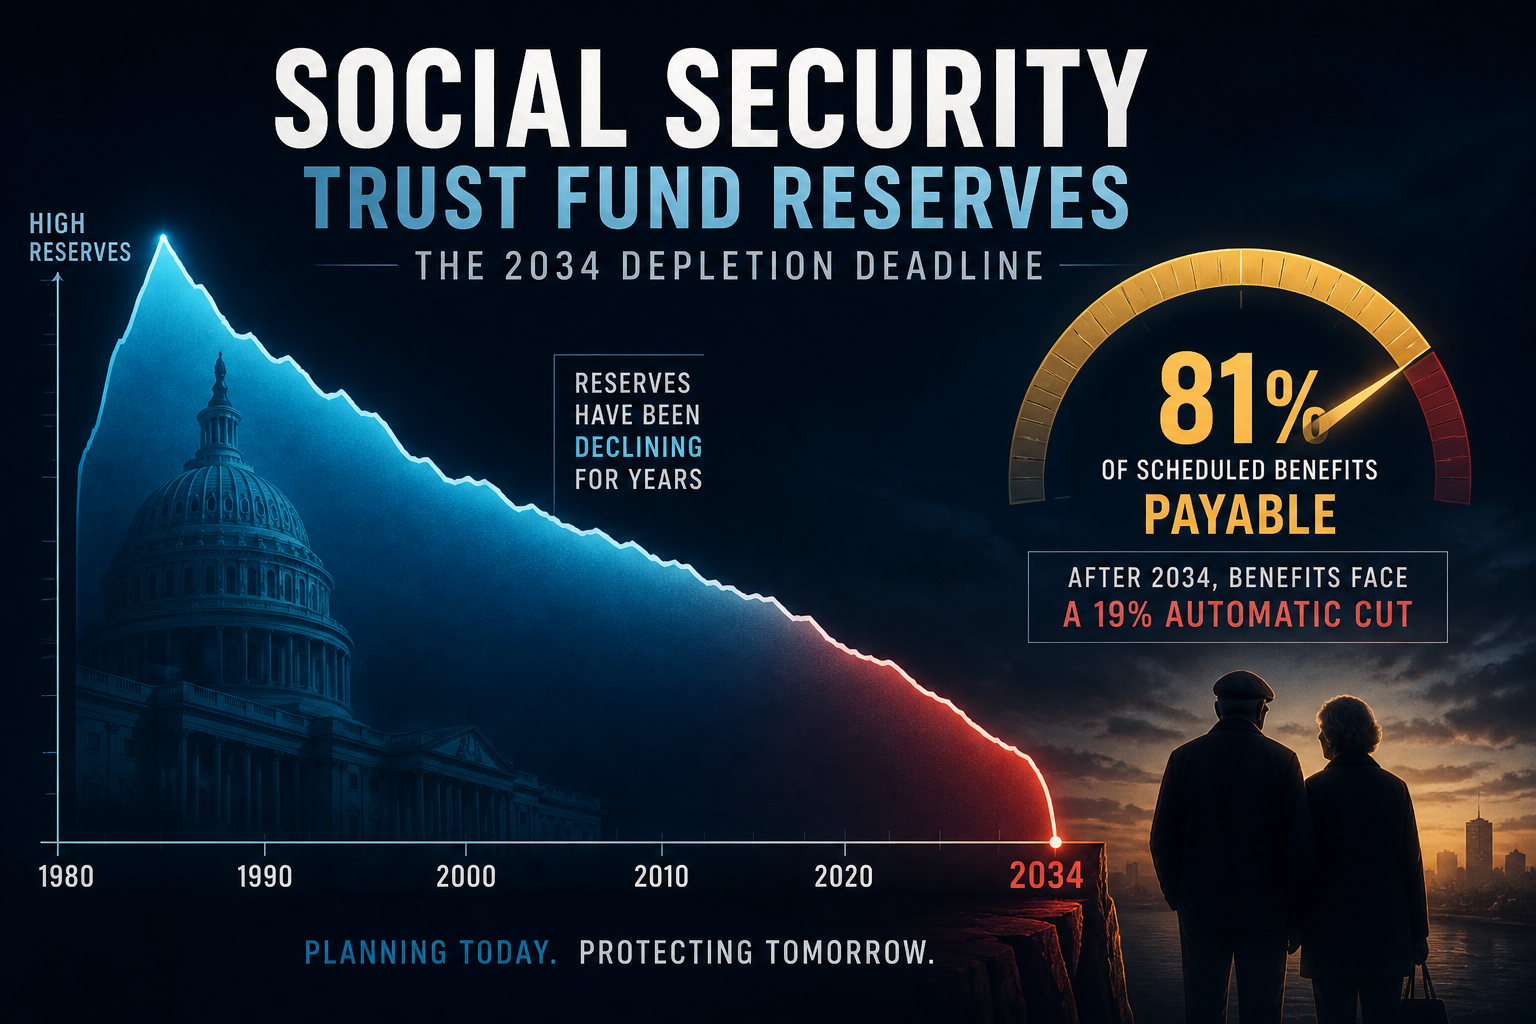
Charted: Social Security Reserves Hit Zero in 2034 — One Year Sooner
SSA’s 2025 Trustees Report projects combined OASDI reserves deplete in 2034 with only 81% of scheduled benefits payable — OASI alone runs dry in 2033 at 77%.
Theta Scribe · Jul 31, 2026